


Abstract
It has been shown that serum homocysteine (Hcy) levels are higher in women with polycystic ovary syndrome (PCOS). However, the specific role of hyperhomocysteinemia (HHcy) in the development of PCOS has never been reported. Adipose tissue inflammation is featured by the infiltration of macrophages, which plays a critical role in the pathogenesis of glucose and insulin intolerance. In this study, C57BL/6 mice were treated with dehydroepiandrosterone (DHEA) and/or a high methionine diet to induce PCOS and HHcy mice models. We showed that DHEA induced a PCOS-like phenotypes, irregular estrous cycles, weight gain, abnormal sex hormone production, glucose and insulin resistance, and polycystic ovaries. HHcy further intensified the effects DHEA on the metabolic, endocrinal, hormonal, and morphological changes in PCOS-like mice. In addition, HHcy attenuated the DHEA-induced increase in serum estrogen levels in mice. Furthermore, HHcy may exacerbate the insulin resistance in PCOS-like mice, most likely through modulating the macrophage M1/M2 polarization pathways via the suppression of estrogen. Most important, our clinical data showed that there were increases in serum Hcy levels in patients with PCOS. These findings deepen our understanding of the pathological roles of HHcy in the development of PCOS and provide a promising target for PCOS therapy in clinical application.
Polycystic ovary syndrome (PCOS) is the most common endocrine and metabolic disorder in women of reproductive age, with a prevalence of 6.5% to 8% based on the National Institutes of Health criteria (1). This heterogeneous disorder displays multiple symptoms, including menstrual irregularity, chronic anovulation, hirsutism, hyperandrogenism, luteinizing hormone hypersecretion, obesity, impaired glucose tolerance, insulin resistance (IR), and dyslipidemia (1). Long-term health consequences of women with PCOS include type 2 diabetes, hypertension, cardiovascular disease, and cancers (1). Among these associated complications, the most substantial metabolic aberration is the presence of IR (a high prevalence of 64% in patients with PCOS), accompanied by compensatory hyperinsulinemia (2). IR in PCOS perturbs glucose metabolism, lipogenesis, and adipokine secretion in insulin target organs, including adipose tissue (3). Emerging evidence linking obesity and IR suggests that a low-grade systemic inflammatory condition is a possible pathogenesis of IR in adipose tissue (4, 5). Moreover, recent studies have shown the correlation of the elevated proinflammatory state with PCOS and obesity (6–9). Homocysteine (Hcy) is a common amino acid formed during the metabolism of methionine. Elevated serum level of Hcy is a high risk of developing cardiovascular morbidity and mortality due to its atherogenic and prothrombotic properties (10). Increased inflammatory cytokine expression is one of the molecular mechanisms by which elevated Hcy induces cellular dysfunction (11). In women with PCOS, levels of Hcy in serum and follicular fluid are negatively correlated with the quality of oocyte and embryo because of the deleterious effects of Hcy on estrogen synthesis as well as the maturation of follicles and oocytes (12). Notably, studies have shown that there is a disturbed Hcy metabolism in women with PCOS (13–15). Indeed, women with PCOS often display several phenotypes in association with hyperhomocysteinemia (HHcy), such as IR, obesity, oxidative stress, and dyslipidemia; all are risk factors for cardiovascular diseases (16, 17). Hcy is also a potent proinflammatory factor that promotes inflammation in both in vitro and in vivo systems (18). In mice deficient in low-density lipoprotein receptor/cystathionine β-synthase, HHcy promotes an increase of inflammatory monocytes in the peripheral tissues and elevates plasma levels of tumor necrosis factor–α (TNF-α), interleukin (IL)–6, and monocyte chemoattractant protein 1 (MCP-1) (19). Clinical data from epidemiological studies suggest that HHcy is closely associated with IR, which is considered a chronic inflammatory status (20). Macrophages are the most abundant immune cells in adipose tissue that play a critical role in regulating IR (21). Specifically, inflammation is either promoted or resolved by different macrophages, which polarize into classically (M1) or alternatively (M2) activated macrophages under various stimuli (22). In addition to the disordered metabolic status, IR is characterized by a transition in macrophage polarization from an alternative M2 state to a proinflammatory M1 state (M2 to M1 phenotype switch) (4, 5).
Taken together, we speculate that HHcy inhibits insulin sensitivity, promotes proinflammatory cytokine production, and facilitates macrophage infiltration, a possible cellular mechanism to address the pathogenesis of IR in women with PCOS.
Materials and Methods
Clinical data
This study was approved by the Ethics Committee of Peking University Third Hospital. Hcy levels were collected from patients who visited the Division of Reproduction Center, Peking University Third Hospital, from December 2012 to August 2015. Women with PCOS were diagnosed according to the 2003 Rotterdam criteria. The control participants were selected from women who reported to the clinic for the in vitro procedure, and the cause of marital infertility was male azoospermia.
Animal model
Female prepuberal (21-day-old) C57BL/6 mice (Department of Experimental Animal Sciences, Peking University Health Science Center, Beijing, China) were randomly divided into four groups [control, Hcy, dehydroepiandrosterone (DHEA), and Hcy + DHEA]. All animal experimental procedures were approved by the Animal Care and Use Committee of Peking University Third Hospital according to the national legislation for animal care. Animals of the DHEA group were injected daily with DHEA (Sigma) (6 mg/100 g body weight, dissolved in 0.1 mL sesame oil) and given a normal diet. Mice in the Hcy group were injected daily with sesame oil and given a high-methionine diet (20 g/kg methionine, added into the diet; Research Diets). Mice in the Hcy + DHEA group were injected daily with DHEA and fed the high-methionine diet. Animals in the control group were injected daily with sesame oil and fed a normal diet. All the animals were treated for 20 consecutive days.
Body weight and body composition analysis
The body weight of the mice was measured every two days from day 1 to day 22. At the end of the treatment schedule, magnetic resonance imaging was performed by placing mice in a clear plastic holder without anesthesia or sedation and inserting them into the EchoMRI device (Echo Medical Systems) for measurement of the body fat mass composition.
Vaginal smears and estrous cycle determination
The vaginal smears were taken daily at 9 am from the 10th to the 20th day after the first day of treatment for at least two cycles. Estrous cycle stage was determined by microscopic analysis of the predominant cell types in the vaginal smears following Shorr staining.
Glucose tolerance test and insulin tolerance test
Mice underwent fasting for 12 hours before the glucose tolerance test (GTT) experiment. Glucose levels were measured by tail vein blood using a blood glucose detecting device (ACCU-CHEK Performa; Roche Diagnostics GmbH), with a range of 0.6 to 33.3 mmol/L. After fasting, glucose levels were measured and mice were given a d-glucose (Sigma; 2 g/kg body weight) intraperitoneal (IP) injection, with tail sampling was performed at 15, 30, 60, and 120 minutes after IP injection.
Two days after the GTT experiment, the mice underwent fasting for four hours before the insulin tolerance test (ITT) experiment. After fasting, the glucose levels were measured, and then the mice were injected (IP) with insulin (Wanbang; 1.5 IU/kg body weight), with tail sampling performed 15, 30, 60, 90, and 120 minutes after IP injection.
Serum analysis
At the end of the treatment, blood was drawn from the inner canthus after the mice fasted for eight hours. The blood samples were collected and the levels of testosterone, estrogen, high-density lipoprotein, low-density lipoprotein, insulin, and Hcy were determined with 125I-labeled RIA kits (Beijing North Institute of Biological Technology). Total cholesterol and triglyceride levels were determined using biochemical kits (China Diagnostics Medical Corporation).
Ovarian morphology
Immediately after the collection of blood samples, the ovaries were quickly removed and fixed in 4% paraformaldehyde, placed in 70% ethanol, dehydrated, and embedded in paraffin. The sections were prepared and stained with hematoxylin and eosin (Beisuo Biotech). The ovaries were longitudinally and serially sectioned at 5 mm (CM1850; Leica). The number of corpora luteum (CL) and the thickness of theca and granulosa cell layers were measured by a microscope (NIS Elements 3.2, Nikon Eclipse 80 i; Nikon, Tokyo, Japan).
Quantitative real-time polymerase chain reaction analysis
Adipose tissues were dissected, quickly frozen, and stored at −80°C for the RNA extraction. Total RNA of the adipose tissues and bone macrophages was extracted using the Trizol reagent (Life Technologies) and reverse transcribed to complementary DNA with the first-strand complementary DNA synthesis kit (Fermentas). Real-time quantitative PCR analysis was performed using SYBR Green PCR master mix (Invitrogen). The expression levels were assessed using the ABI 7500 real-time PCR system (Applied Biosystems). The primer sequences of the genes tested are shown in Table 1.
Antibodies Used
| Antibody | Manufacturer, Catalog No., and/or Name of Individual Providing the Antibody | Species Raised in Monoclonal or Polyclonal | Dilution Used | RRID |
|---|---|---|---|---|
| Liver arginase antibody | Abcam, ab91279 | Rabbit; polyclonal | 1:1000 | AB_10674215 |
| Rabbit anti-NOS2 polyclonal antibody, unconjugated | Santa Cruz, sc650 | Rabbit; polyclonal | 1:500 | AB_631831 |
| Rabbit anti–β-actin monoclonal antibody, unconjugated, clone 13E5 | Cell Signaling, 4970 | Rabbit; polyclonal | 1:1000 | AB_2223172 |
| Phospho-Akt (Ser473) antibody | Cell Signaling, 4060s | Rabbit; polyclonal | 1:1000 | AB_2315049 |
| Akt (pan) (11E7) rabbit mAb antibody | Cell Signaling, 4685s | Rabbit; polyclonal | 1:1000 | AB_10698888 |
Abbreviation: RRID, Research Resource Identifier.
Western blot analysis
Proteins of the adipose tissues were extracted using the RIPA lysis buffer. The protein concentrations were determined with the BCA Protein Assay Kit (Kangwei). Samples were loaded at 50 μg/lane and separated in 10% sodium dodecyl sulfate gels. The separated samples were transferred to nitrocellulose transfer membranes. After incubation with blocking buffer for 1 hour, the membranes were incubated with antibodies against rabbit anti-Arg1 (1:1000; Abcam ab91279), rabbit anti–inducible nitric oxide synthase (iNOS) (1:500; Santa Cruz sc650), rabbit anti-pAkt (1:1000; Cell Signaling 4060s), or rabbit anti-tAkt (1:1000, 4685S; Cell Signaling 4685s) and then normalized to rabbit anti–β-actin (1:1000; Cell Signaling 4970) for whole-cell extract. After washing, blots were incubated with an anti-rabbit immunoglobulin G secondary antibody (1:20,000; LI-COR Biosciences) for 1 hour at room temperature. The immunofluorescence signal was detected by Odyssey IR imaging (LI-COR Biosciences). The Western blot bands were scanned, quantified, and analyzed using ImageJ software (National Institutes of Health). All the experiments were repeated at least three times.
Flow cytometry
Adipose tissues were minced and digested with 1 mg/mL type I collagenase at 37°C for 45 minutes. After centrifugation, the cells were stained with CD206PE, CD4FITC, CD11cAPC, CD8aPE-Cy7, and F4/80PerCP/Cy5.5 (BD Biosciences) for 30 minutes at 4°C protected from light. The labeled cells were thoroughly washed with phosphate-buffered saline and analyzed on a FACSCalibur flow cytometer (Becton Dickinson).
Cytometric bead array analysis
The BD Cytometric Bead Array Mouse Inflammation Kit (Becton Dickinson) was used to quantitatively measure the serum protein levels of IL-6, IL-10, MCP-1, interferon-γ (IFN-γ), TNF-α, and IL-12p70. All of the procedures were performed according to the cytometric bead array kit instruction manual. FCAP Array Software was used to analyze the data.
Cell culture
Bone marrow cells were isolated from six-week-old C57BL/6 female mice and flushed with RPMI medium 1640 supplemented with 10% fetal bovine serum, 1% l-glutamine, and 1% penicillin-streptomycin. The cells were resuspended and plated at a density of 10−6 cells/mL. Granulocyte macrophage colony-stimulating factor (10 ng/mL; Pepro Tech) was added to promote the differentiation of bone marrow cells into macrophages. The cells were cultured for three days at 37°C in 5% CO2. After differentiation, bone macrophages were treated with 300 μM Hcy, 100 nM β-estradiol (Sigma), or Hcy + β-estradiol for 24 hours. The M1/M2 markers (iNOS/Arg1) and β-estradiol markers [interferon regulatory factor 4 (IRF4)/Jumonji domain containing 3 (JMJD3)] were measured in the cells.
Statistics
All data are expressed as mean ± standard error of the mean. One-way analysis of variance and least significant difference Tukey’s post hoc tests were used to evaluate the statistical significance of the differences between more than two groups. The independent samples t test was used to evaluate the statistical significance between two groups. All analysis was performed using SPSS version 19.0 (SPSS, Inc.). Statistical significance was defined as P < 0.05.
Results
Administration of a high-methionine diet resulted in an increase in serum levels of Hcy in mice
To confirm that the administration of a high-methionine diet leads to an HHcy status in mice, we first examined the serum levels of Hcy of four groups of mice after specific treatments. As shown in Fig. 1(a), the serum levels of Hcy are significantly higher in the groups of Hcy and Hcy + DHEA that were given a high-methionine diet for 20 days.
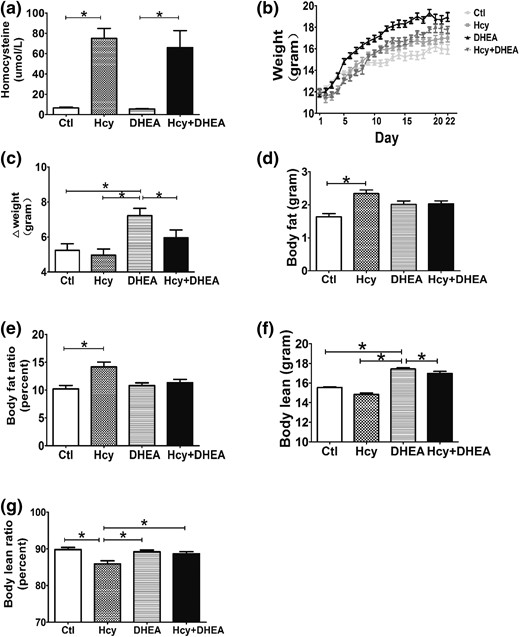
DHEA increases the body weight and Hcy increases the body fat in the DHEA-treated mouse model. (a) Serum homocysteine levels, (b) body weight change curve, (c) body weight gain (n = 10 of each group), (d) body fat, (e) body fat ratio, (f) body lean, and (g) body lean ratio of mice exposed to control, Hcy (administration with a high-methionine diet), DHEA, or Hcy + DHEA (n = 5 of each group) for 20 days of treatment. *P < 0.05, one-way analysis of variance, with Tukey’s post hoc test. Ctl, control.
DHEA treatment increased body weight and HHcy increased body fat content
After specific administration, the DHEA mice gained significantly more weight than the control, Hcy, and Hcy + DHEA groups [Fig. 1(b) and 1(c)]. Notably, HHcy abolished the DHEA-induced increase in weight gain [Fig. 1(b) and 1(c)]. To better understand the assessment of the body fat weight and muscle weight changes, magnetic resonance imaging was used to demonstrate the body fat [Fig. 1(d)], body fat ratio [Fig. 1(e)], body lean [Fig. 1(f)], and body lean ratio [Fig. 1(g)] of these groups. Addition of a high-methionine diet significantly increased the body fat and body fat ratio in the Hcy group compared with controls [Fig. 1(d) and 1(e)]. The results showed that DHEA-treated mice had a higher weight gain, whereas their body fat and body fat ratio had no change, which could be due to the increase in body lean weight [Fig 1(f) and 1(g)]. However, the body lean and body lean ratio were decreased in the Hcy mice [Fig. 1(f) and 1(g)]. The decrease in body lean that is associated with the increase in body fat leads to the result of no difference in the total body weight change in Hcy mice [Fig. 1(c)].
HHcy induced glucose intolerance and insulin intolerance and HHcy exacerbated the DHEA-induced insulin intolerance
Compared with the control group, the fasting glucose levels [Fig. 2(a)] and serum insulin levels [Fig. 2(b)] were significantly higher in the DHEA and Hcy groups. Notably, the Hcy + DHEA group displayed the highest serum insulin level among the four groups [Fig. 2(b)]. After administration of glucose or insulin (GTT or ITT), we found that a high-methionine diet resulted in markedly higher glucose levels in the Hcy and Hcy + DHEA groups than in the control and DHEA groups at the 15-minute and 30-minute points examined [Fig. 2(c)]. A significant difference in glucose level was detected between DHEA and control groups at the 15-minute point examined [Fig. 2(c)]. In addition, the GTT–area under the curve glucose levels, ITT–area under the curve glucose levels, and homeostatic model assessment of IR (HOMA-IR) levels [defined as HOMA = insulin (μUI/mL) × glucose (mmol/L) / 22.5] were significantly higher in the Hcy and DHEA groups compared with the control group [Fig. 2(d), 2(f), and 2(g)]. Moreover, the Hcy + DHEA group showed a higher ITT–area under the curve glucose level than the Hcy and DHEA groups [Fig. 2(f)]. These results indicate that HHcy resulting from a high-methionine diet could exacerbate the impaired glucose tolerance induced by DHEA treatment in mice.
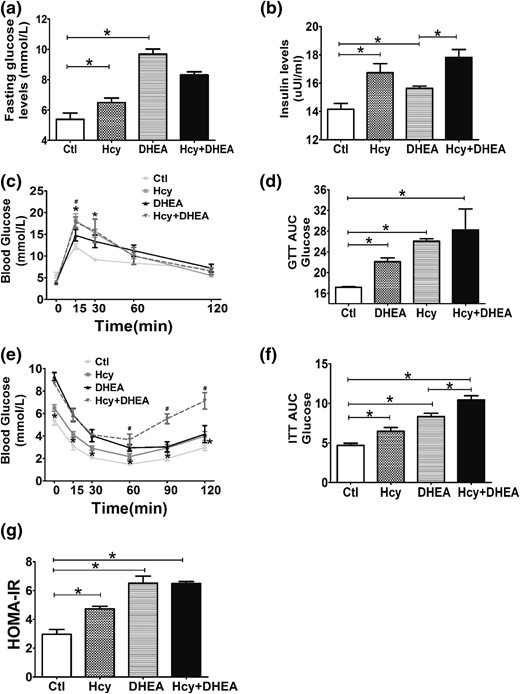
Hcy exacerbates the metabolic disorders induced by DHEA in mice. (a) Fasting blood glucose and (b) insulin levels of mice exposed to control, Hcy, DHEA, or Hcy + DHEA (n = 5 of each group) for 20 days of treatment. (c) GTT, (d) GTT AUC, (e) ITT, (f) ITT AUC, and (g) HOMA-IR (n = 10) results of four groups. *P < 0.05, one-way analysis of variance, with Tukey’s post hoc test. (c, e) *P < 0.05 vs controls, #P < 0.05 vs DHEA. Ctl, control; HOMA-IR, homeostatice model assessment of IR.
DHEA treatment disrupted estrous cycles
To evaluate the reproductive function of the mice, estrous cycles were assessed by daily examination of the vaginal smears. All control mice and most of the high-methionine diet treated mice had a normal estrous cycle of four to five days [Fig. 3(a) and 3(b)]. However, mice treated with DHEA with or without a high-methionine diet (Hcy + DHEA group) had disrupted estrous cycles. Most of the mice displayed constant estrus, indicated by the presence of cornified squamous epithelial cells. Occasionally, cells indicating proestrus or diestrus could be observed in the DHEA and Hcy + DHEA groups [Fig. 3(c) and 3(d)].
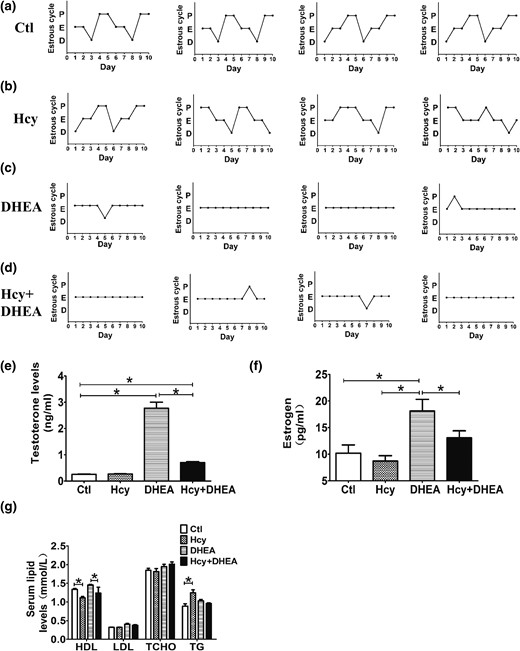
DHEA-treated mice display disrupted estrous cycles and hormonal levels. (a–d) Representative estrous cycles (n = 4 of each groups) of mice exposed to control, Hcy, DHEA, or Hcy + DHEA for 20 days. The serum levels of (e) testosterone, (f) estrogen, and (g) lipids of mice (n = 10) exposed to control, Hcy, DHEA, or Hcy + DHEA for 20 days. *P < 0.05, one-way analysis of variance, with Tukey’s post hoc test. Ctl, control; HDL, high-density lipoprotein; LDL, low-density lipoprotein; TCHO, total cholesterol; TG, triglyceride.
HHcy exacerbated the endocrinal and metabolic dysfunctions induced by DHEA treatment
DHEA-treated mice, with or without a high-methionine diet, had higher levels of serum testosterone than the control mice, whereas the Hcy + DHEA group had lower testosterone levels than the DHEA group [Fig. 3(e)]. In our mouse model, the DHEA group had higher estrogen levels than the control group, and addition of a high-methionine diet (Hcy + DHEA group) attenuated the DHEA-induced increase in serum estrogen levels [Fig. 3(f)]. Interestingly, the metabolic evaluation showed that Hcy and Hcy + DHEA groups had lower high-density lipoprotein levels than the control and DHEA groups [Fig. 3(g)]. Triglyceride levels were increased in the Hcy group but not in the Hcy + DHEA group [Fig. 3(g)].
HHcy intensified the DHEA-induced histomorphological changes in the mouse ovary
Using microscopic inspection, ovaries from control mice had follicles at different stages of development with surrounding theca cells, granulosa cells, and CL. Neither structural abnormalities nor ovarian cysts were found in these ovaries [Fig. 4(a)]. The Hcy group showed some abnormal morphology compared with controls, such as thinner theca and thinner granulosa cell layers and fewer CL [Fig. 4(a–c)]. However, the ovaries from DHEA-treated mice showed a remarkable cyst-like appearance of follicles, fewer CL, much thinner follicular walls, and diminished granulosa cell layers compared with the control group [Fig. 4(a–c)]. Among four groups, the Hcy + DHEA group displayed the most aberrant ovarian morphology: ovaries had the thinnest theca and granulosa cell layers, the most fluid-filled cystic follicles, and the fewest CL. These data indicate that HHcy intensified the DHEA-induced ovarian abnormalities in mice [Fig. 4(a–c)]. The gene expression assay using reverse transcription–quantitative PCR revealed that either HHcy or DHEA induced significant increases in the messenger RNA (mRNA) expression of anti-Müllerian hormone (AMH), which is related to ovary function, and AMH receptor 2 in the mouse follicle cells [Fig. 4(e)]. Interestingly, the increased expression in DHEA alone was exacerbated by the induction of HHcy in the Hcy + DHEA group [Fig. 4(e)].
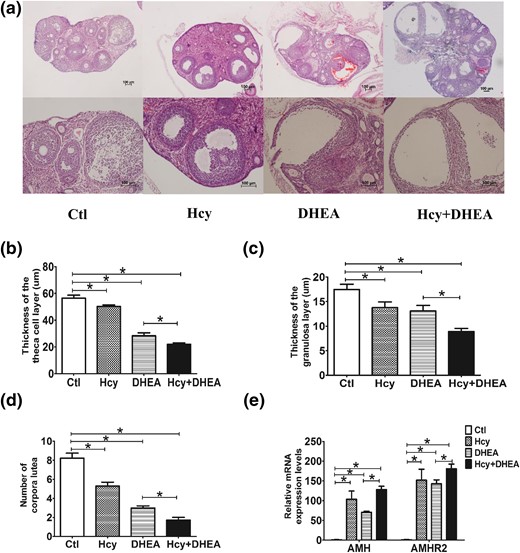
Hcy and DHEA affect the histomorphology of the mouse ovary. (a) The histological staining (hematoxylin and eosin staining) of representative ovaries on day 22 of treatment. Survey views show rat ovaries of control, Hcy, DHEA, Hcy + DHEA. Scale bar =100 μm. Comparison of the thickness of the (b) theca cell layer and (c) granulosa cell layer, as well as the (d) number of corpora lutea in the mouse ovaries of four groups. (e) Comparison of the expression levels of AMH and AMH receptor 2 (AMHR2) of the follicles in the mouse ovaries of four groups (n = 8). *P < 0.05, one-way analysis of variance, with Tukey’s post hoc test. Ctl, control.
HHcy induced increases in inflammatory response markers in the mouse serum samples
The inflammation-related cytokines IFN-γ, TNF-α, MCP-1, IL-6, and IL-12p70 were quantitatively measured in the mouse serum samples. As shown in Fig. 5(a) and 5(b), levels of IFN-γ and TNF-α were significantly higher in the Hcy and Hcy + DHEA groups. Compared with the DHEA group, the MCP-1 levels were higher in the Hcy + DHEA group [Fig. 5(c)]. However, the serum levels of IL-6, IL-10, and IL-12p70 did not significantly differ among the four groups [Fig. 5(d–f)].
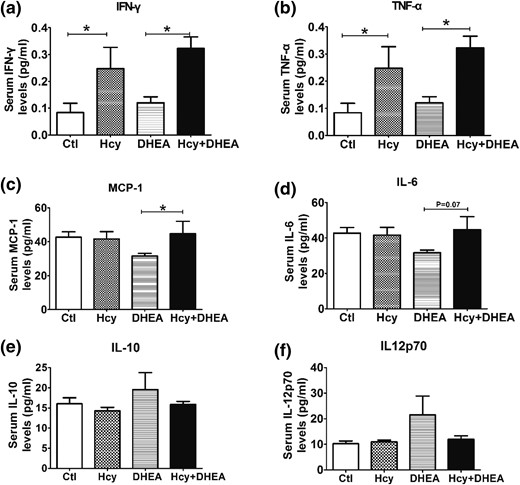
Effects of Hcy and DHEA on the expression of inflammation-related cytokines. The serum levels of (a) IFN-γ, (b) TNF-α, (c) MCP-1, (d) IL-6, (e) IL-10, and (f) IL-12p70 of mice exposed to control, Hcy, DHEA, or Hcy + DHEA for 20 days. *P < 0.05, one-way analysis of variance, with Tukey’s post hoc test. Ctl, control.
HHcy induced M1/M2 imbalance (M2 to M1 phenotype switch) in the PCOS mouse model
In adipose tissues of mice, the mRNA levels of iNOS, CD11c, TNF-α, and IL-1β are used as M1 macrophage markers, and Arg1 and CD206 are used as M2 macrophage markers (23). Our results showed that the iNOS level was significantly higher in the Hcy and Hcy + DHEA groups than in control and DHEA groups [Fig. 6(a)]. In addition, the percentage of M2 macrophages in visceral adipose tissues was lower in the Hcy group than in the control group [Fig. 6(b)]. In the mouse adipose tissues, Arg1 protein levels decreased significantly in the Hcy and DHEA groups compared with the control group [Fig. 6(c) and 6(d)]. Notably, HHcy further decreased the Arg1 protein levels in the Hcy + DHEA group vs the DHEA group [Fig. 6(c) and 6(d)]. Furthermore, the phosphorylated Akt (Ser473) protein levels were lower in the Hcy and DHEA groups, and HHcy enhanced the DHEA-induced suppressive effect on the phosphorylated Akt proteins [Fig. 6(f)].
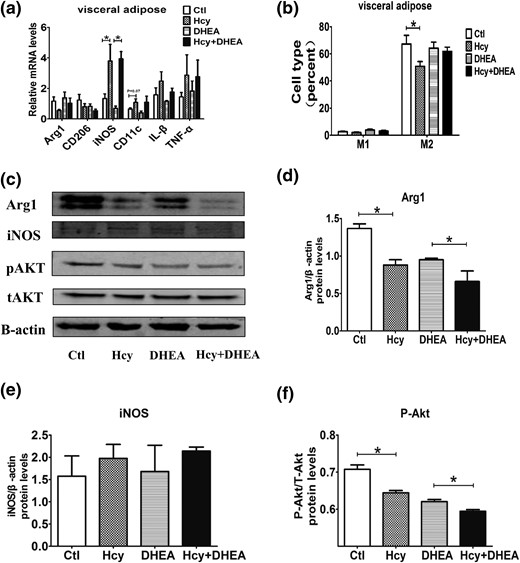
Hcy induces the M2 to M1 phenotype switch. (a) Comparison of the mRNA expression of various inflammatory factors in the mouse visceral adipose tissue using reverse transcription quantitative PCR (n = 8). (b) The percentage of M1 and M2 macrophages in the mouse visceral adipose tissue using fluorescence-activated cell-sorting measurement (n = 5). (c) Comparison of the protein levels of (d) Arg1, (e) iNOS, and (f) pAkt/tAkt in the mouse visceral adipose tissue using Western blot analysis (n = 8). *P < 0.05, one-way analysis of variance, with Tukey’s post hoc test. Ctl, control.
Hcy promoted M2 macrophage differentiation through the suppression of β-estradiol
We found that estrogen decreased significantly in mice with induced HHcy compared with the control and DHEA groups [Fig. 3(f)]. To investigate the role of estrogen in HHcy accompanied with PCOS, two estrogen pathway-related molecules, IRF4 and JMJD3, were measured. The mRNA expression levels of IRF4 and JMJD3 in adipose tissue decreased significantly in the Hcy and Hcy + DHEA groups [Fig. 7(a)]. To further verify the effect of estrogen on the M1/M2 cell balance in vitro, we examined the relative mRNA expression levels of IRF4, JMJD3, Arg1, and iNOS in bone macrophages after administration with β-estradiol. The results showed that β-estradiol upregulated the expression of IRF4, JMJD3, Arg1, and iNOS in bone marrow cells [Fig. 7(b) and 7(c)]. Furthermore, β-estradiol reversed the Hcy-induced suppressive effect on Arg1 expression, and β-estradiol attenuated the Hcy-induced stimulated effect on iNOS expression [Fig. 7(c)].
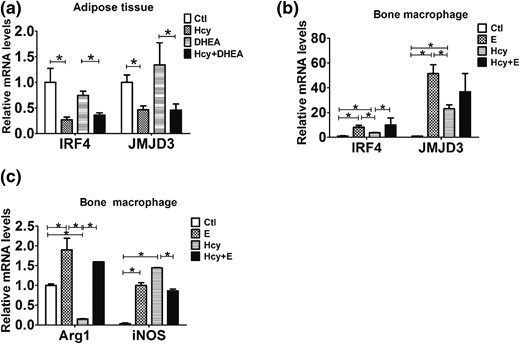
Hcy promotes the M2 macrophage differentiation by inhibiting estradiol expression. (a) Comparison of the mRNA expression of IRF4 and JMJD3 in the mouse visceral adipose tissue using reverse transcription quantitative PCR (n = 8). (b) Comparison of the mRNA expression of IRF4 and JMJD3 in the mouse bone macrophages treated with or without estrogen (E) and Hcy using reverse transcription quantitative PCR (n = 6). (c) Comparison of the mRNA expression of Arg1 and iNOS in the mouse bone macrophages treated with or without estrogen and Hcy using reverse transcription quantitative PCR (n = 8). *P < 0.05, one-way analysis of variance, with Tukey’s post hoc test. Ctl, control.
Serum Hcy levels were increased in patients with PCOS
Of the 347 patients recruited in this study, 168 were patients with PCOS. Among the population, 95 patients were diagnosed as having HHcy, with 67 accompanied with PCOS. The PCOS group (n = 168) had higher serum homocysteine levels (10.48 ± 0.53 vs 7.44 ± 0.30, P < 0.05) than the control group (n = 179). The PCOS group also had a higher percentage of HHcy. Patients with PCOS had a lower average age (28.85 ± 0.26 vs 32.48 ± 0.23, P < 0.05) than the control group (n = 36) (Table 2). These results indicate that HHcy is a risk factor for PCOS.
Нomocysteine Levels in Women With or Without PCOS
| Characteristic | Control | PCOS |
|---|---|---|
| Number | 179 | 168 |
| Number of HHcy | 28 | 67 |
| Age, y | 32.48 ± 0.23 | 28.85 ± 0.26a |
| Hcy, μmol/L | 7.44 ± 0.30 | 10.48 ± 0.53a |
| Percentage of HHcy | 16.67 | 37.43 |
| Characteristic | Control | PCOS |
|---|---|---|
| Number | 179 | 168 |
| Number of HHcy | 28 | 67 |
| Age, y | 32.48 ± 0.23 | 28.85 ± 0.26a |
| Hcy, μmol/L | 7.44 ± 0.30 | 10.48 ± 0.53a |
| Percentage of HHcy | 16.67 | 37.43 |
Data are expressed as mean ± standard error of the mean unless otherwise indicated. Data were analyzed by Student t test (for two groups).
P < 0.05 vs controls.
Discussion
Because the manifestations of PCOS are heterogeneous, it is difficult to generate a perfect model that exactly reproduces the reproductive and metabolic phenotypes of this disorder (24). Hyperandrogenism is the main characteristic of PCOS, and androgenization of animals is the most common approach to induce PCOS symptoms. For this reason, we chose the commonly used DHEA mouse model to induce PCOS-like symptoms in this study (25). We treated the mice with DHEA during the prepuberal stage to induce the PCOS-like symptoms (24, 26). Postnatal treatment of rodents with DHEA resulted in most features of human PCOS, including acyclicity, anovulation, polycystic ovaries, and hyperandrogenism (27). Our study showed that DHEA treatment in mice significantly increased body weight, and a high-methionine diet–induced HHcy increased the fat mass. In addition, both DHEA and Hcy can impair the glucose tolerance by increasing the fasting blood glucose and insulin level, and the GTT and ITT curves in our study supported this result. Furthermore, serum lipids such as triglyceride and high-density lipoprotein were significantly changed after treatment with Hcy or Hcy + DHEA [Fig. 3(g)]. These results indicate that HHcy may enhance the metabolic effects induced by DHEA.
Mice from the DHEA and DHEA + Hcy groups exhibited disrupted estrous cycles, whereas control and Hcy-treated mice had a normal cycle. This indicates that DHEA can disrupt estrous cycles, as the serum testosterone levels were elevated in the DHEA and HHcy + DHEA groups (Fig. 3). As such, the sex hormones, including testosterone and estrogen, were significantly changed after treatment.
The ovaries of DHEA-treated mice have a thin theca layer and a compact layer of granulosa cells. Notably, the thin theca cell layer does not match the follicular phenotype in women with PCOS (24, 28, 29). The phenotypes of thin theca and granulosa cell layers as well as fewer CL in DHEA-treated mice could be further exacerbated by the addition of high methionine-induced HHcy. These results indicate that HHcy not only affects the metabolic and hormonal conditions but also influences the morphological changes of the mouse ovary. Higher levels of AMH are associated with both anovulation and hyperandrogenism (30), as well as contribute to the anovulatory phenotype and other pathophysiological characteristics of PCOS (31). Recent studies indicated that AMH is one of the most useful single parameters to reflect the severity of PCOS (32). The relative mRNA expression of AMH and AMH receptor 2 was significantly higher in the DHEA group than in the control group. Treatment with Hcy and DHEA increased the expression further. Consistent with the results from the ovarian morphological study, HHcy can intensify the DHEA-induced abnormal oocyte development, ovulatory dysfunction, and anovulation.
Previous studies have shown that HHcy mice displayed glucose intolerance, IR, and an impaired insulin-signaling pathway (18). In addition, Hcy may promote IR by upregulating the locally produced adipokines in differentiated adipocytes (17, 33). PCOS has been shown to closely link to the functional disorders in adipose tissue, which could release more than 50 cytokines (6, 34), The results from the current study showed evidence of a low-grade chronic inflammation reflected by minor but significant increases in circulating levels of TNF-α, IL-6, IL1-β, IL-18, and MCP-1. Notably, the expression of IFN-γ, TNF-α, and MCP-1 was significantly increased in our DHEA- and/or methionine-treated mice, suggesting a functional role of Hcy in regulating inflammation in a PCOS mouse model (Fig. 4). In human monocytes, Hcy induced the expression and secretion of proinflammatory factors, such as MCP-1 and IL-8 (35). HHcy inhibited adipose insulin sensitivity by inducing endoplasmic reticulum stress, promoting proinflammatory cytokine production, and facilitating macrophage infiltration (33). Proinflammatory M1 macrophages inhibit insulin sensitivity by producing cytokines, whereas anti-inflammatory M2 macrophages have the opposite effect (36). Our study demonstrated that in mouse adipose tissue, M1-associated cytokines such as iNOS, CD11, IL-β, and TNF-α were activated, whereas M2-associated cytokine Arg1 was suppressed in the mice induced with Hcy and DHEA + Hcy. These results were further confirmed by measuring cytokines of different types of macrophages in adipose tissue, as we have shown that IFN-γ, TNF-α, MCP-1, and IL-6 were increased in the Hcy and DHEA + Hcy groups (Fig. 6). Therefore, we can speculate that Hcy aggravates the systemic insulin sensitivity and chronic inflammation in PCOS mice by influencing the proportion of M1 and M2 macrophages.
Estrogens act as potent anti-inflammatory regulators and may promote alternative macrophage polarization (37–41). Recent research has shown the beneficial effects of estrogen on the promotion of tissue repair, which are partly mediated through the ERα-mediated alternative macrophage activation (37). IL-4–induced M2 polarization is enhanced with the addition of exogenous β-estradiol at micromolar doses in mouse bone marrow–derived macrophages. IRF4 is a transcription factor induced by granulocyte macrophage colony-stimulating factor that is critical for CD11b+ dendritic cell development in vivo, acting as a target of ERα signaling during this process (42, 43). JMJD3 also has been shown to be involved in the activation of macrophages. The JMJD3-IRF4 axis regulates M2 macrophage polarization (44). In our study, we found that the expression levels of mRNA of IRF4 and JMJD3 were significantly downregulated when treated with Hcy, and these suppressive effects can be reversed by addition of the exogenous β-estradiol. We also found that addition of β-estradiol reversed the Hcy-induced decrease in Arg1 expression. Furthermore, β-estradiol attenuated the Hcy-induced increase in iNOS expression (Fig. 7). Consistent with these results, our data showed that Hcy suppressed serum estrogen levels in both Hcy and Hcy + DHEA groups [Fig. 3(f)]. Taken together, all of these findings indicate that Hcy can promote M2 macrophage differentiation through inhibiting estrogen production.
There is a growing body of evidence that the serum Hcy levels are increased and metabolism is disturbed in women with PCOS (12, 16, 17). Indeed, our clinical information was in accordance with that of previous studies. Taken together, we may speculate that the occurrence of HHcy is correlated with IR, whereas the causality of these two events warrants further investigation. Further studies aimed at addressing the functional role of homocysteine in the human reproductive pathophysiology will be of great interest.
Conclusion
In conclusion, treatment of female mice with DHEA induced PCOS-like symptoms, such as irregular estrous cycles, abnormal levels of sex hormones, and polycystic ovaries. Administration of a high-methionine diet resulted in an HHcy status in mice, and HHcy further intensified the effects of DHEA on the metabolic, endocrinal, hormonal, and morphological changes in PCOS-like mice. Furthermore, HHcy may exaggerate the IR in PCOS-like mice, most likely via the estrogen-mediated imbalance of macrophage M1/M2 polarization. Most important, our clinical information confirmed that HHcy is a risk factor for PCOS. These findings deepen the understanding of the pathological roles of HHcy in the development of PCOS and will improve the diagnosis and treatment of this endocrine disorder.
Abbreviations:
- AMH
anti-Müllerian hormone
- CL
corpora luteum
- DHEA
dehydroepiandrosterone
- GTT
glucose tolerance test
- Hcy
homocysteine
- HHcy
hyperhomocysteinemia
- IFN-γ
interferon-γ
- IL
interleukin
- iNOS
inducible nitric oxide synthase
- IP
intraperitoneal
- IR
insulin resistance
- IRF4
interferon regulatory factor 4
- ITT
insulin tolerance test
- JMJD3
Jumonji domain containing 3
- MCP-1
monocyte chemoattractant protein 1
- mRNA
messenger RNA
- PCOS
polycystic ovary syndrome
- PCR
polymerase chain reaction
- TNF-α
tumor necrosis factor–α.
Acknowledgments
This work was supported by the National Natural Science Funds for Key Program Grant 31230047 (to J.Q.) and National Natural Science Foundation of China Grants 81401168, 81300482, and 81471427. This work was also supported by the Beijing Advanced Innovation Center for Genomics at Peking University.
Author contributions: X.Q. researched data and wrote manuscript. B.Z. and Y.Z. researched data. R.L. reviewed and edited the manuscript. H.-M.C. contributed to discussion and reviewed and edited the manuscript. Y.P. and J.Q. researched data, contributed discussion, and wrote the manuscript.
Disclosure Summary: The authors have nothing to disclose.
References
Author notes
Address all correspondence and requests for reprints to: Jie Qiao, MD, PhD, Center for Reproductive Medicine, Department of Obstetrics and Gynaecology, Peking University Third Hospital, 49 North Garden Road, Haidian District, Beijing 100191, China. E-mail: [email protected]; or Yanli Pang, MD, Center for Reproductive Medicine, Department of Obstetrics and Gynaecology, Peking University Third Hospital, 49 North Garden Road, Haidian District, Beijing 100191, China. E-mail: [email protected].
