


Abstract
Mammalian target of rapamycin complex 1 (mTORC1) activity is often increased in the adrenal cortex of patients with primary aldosteronism (PA), and mTORC1 inhibition decreases aldosterone production in adrenocortical cells, suggesting the mTORC1 pathway as a target for treatment of PA.
To investigate the effect of mTORC1 inhibition on adrenal steroid hormones and hemodynamic parameters in mice and in patients with PA.
(i) Plasma aldosterone, corticosterone, and angiotensin II (Ang II) were measured in mice treated for 24 hours with vehicle or rapamycin. (ii) Plasma aldosterone levels after a saline infusion test, plasma renin, and 24-hour urine steroid hormone metabolome and hemodynamic parameters were measured during an open-label study in 12 patients with PA, before and after 2 weeks of treatment with everolimus and after a 2-week washout.
(i) Change in plasma aldosterone levels. (ii) Change in other steroid hormones, renin, Ang II, and hemodynamic parameters.
Treatment of mice with rapamycin significantly decreased plasma aldosterone levels (P = 0.007). Overall, treatment of PA patients with everolimus significantly decreased blood pressure (P < 0.05) and increased renin levels (P = 0.001) but did not decrease aldosterone levels significantly. However, prominent reduction of aldosterone levels upon everolimus treatment was observed in four patients.
In mice, mTORC1 inhibition was associated with reduced plasma aldosterone levels. In patients with PA, mTORC1 inhibition was associated with improved blood pressure and renin suppression. In addition, mTORC1 inhibition appeared to reduce plasma aldosterone in a subset of patients.
Primary aldosteronism (PA) is characterized by inappropriately high and relatively autonomous aldosterone production by the adrenal cortex, which results in hypertension, sodium retention, suppression of renin, and increased potassium excretion. It is one of the most frequent causes of secondary hypertension (1), affecting ∼6% of the general hypertensive population and up to 30% of hypertensive patients in specialized referral centers (2). The most common causes of PA are bilateral adrenal hyperplasia and adrenal aldosterone-producing adenoma (APA).
Compared with age-, sex-, and blood pressure-matched patients with essential hypertension, patients with PA have an increased risk of cardio- and cerebrovascular morbidity and mortality (3, 4), structural and functional renal abnormalities (5, 6), and metabolic syndrome (7). Targeted treatment can prevent or at least partially reverse the consequences of PA (8–10).
Depending on the subtype of PA, patient characteristics and preference, treatment comprises unilateral adrenalectomy or mineralocorticoid receptor antagonists. However, not all patients are suitable for surgery, and mineralocorticoid receptor antagonists can be associated with intolerable side effects. Therefore, additional therapeutic options are of major interest.
Although mutations in ion channels and ATPases have been identified in a high percentage of APA patients, the molecular mechanism of PA development remains poorly understood (11, 12). Recently, it has been demonstrated that the activity of the mammalian target of rapamycin complex 1 (mTORC1) is commonly increased in the adrenal glands of patients with PA, caused by both adrenal cortex hyperplasia and APA (13). Furthermore, treatment of adrenocortical cells with an mTORC1 inhibitor decreases their steroid hormone production (13, 14) and proliferation (13–15) and increases their apoptosis (16). Accordingly, mTORC1 inhibition decreases adrenocortical carcinoma growth in a mouse xenograft model (17).
Here, we analyze expression of mTORC1 components in APA. Furthermore, we investigate whether a systemic mTORC1 inhibition affects circulating aldosterone levels in mice and patients with PA, and blood pressure and renin suppression in patients with PA.
Materials and Methods
Animal experiments
All animal experiments were approved by the Kantonales Veterinäramt of Kanton Basel-Stadt (Basel, Switzerland). Mice were housed at 22°C in a conventional facility with a 12-hour light/12-hour dark cycle. C57BL/6J, 129/SvJae, and BALB/cJ (in-house husbandry) mice (13 to 16 weeks old) were injected IP with rapamycin (LC Laboratories, Woburn, MA; 2 mg/kg of body weight) or vehicle (5% PEG-400, 4% ethanol, and 5% Tween 80) and euthanized after 24 hours. Animals were injected and euthanized between 1600 hour and 1630 hour. Only males were used in this study.
Adrenal glands were homogenized in radioimmunoprecipitation assay buffer containing Complete Proteinase Inhibitor Cocktail and PhosSTOP phosphatase inhibitor cocktail (both from Roche). Equal amounts of protein were separated by SDS-PAGE, transferred onto nitrocellulose membranes, and probed with antibodies against S6K, S6K-pThr389 (Cell Signaling Technology, Leiden, Netherlands; catalog no. 2780 and no. 9234), and actin (Millipore, Darmstadt, Germany; catalog no. MAB1501).
Plasma steroid hormone levels were determined, as described previously (18), and plasma angiotensin II (Ang II) levels were determined using Ang II ELISA kit (Biotrend, Köln, Germany).
Immunoblot and mass spectrometry analyses of APA and matched control adrenal cortex samples
Quantification of mTORC1 activity and expression of mTORC1 components and proteins involved in mTORC1 regulation in APA and control adrenal cortex samples (Ctrl) of the same adrenal are based on the analysis of immunoblot and mass spectrometry (MS) data obtained in the course of other investigations (19).
Clinical study design and participants
This open-label, proof-of-concept study was conducted at the University Hospital Basel between June 2017 and June 2018 and included 14 patients with PA, diagnosed according to current guidelines of the Endocrine Society (2). Additional eligibility criteria included age ≥18 years and an office blood pressure <160/90 mm Hg. Key exclusion criteria were signs of current infection, ongoing immunosuppressive treatment or documented immunodeficiency, clinically significant kidney or liver disease, uncontrolled congestive heart failure, and pregnancy or breastfeeding. Sample size was based on clinical and practical considerations for a pilot study. As a result of costs, development of a true placebo was not affordable. All participants provided written, informed consent after the nature and possible consequences of the study were explained. Subject characteristics are provided in Table 1.
Demographic and Clinical Baseline Characteristics of Subjects
| Characteristic | Median (IQR) or Number (%) |
|---|---|
| Sex | |
| Male, n (%) | 7 (58) |
| Female, n (%) | 5 (42) |
| Ethnicity | |
| Caucasian, n (%) | 9 (75) |
| African, n (%) | 3 (25) |
| Age, y | 49 (44–58) |
| Body mass index, kg/m2 | 32.6 (26.3–35.4) |
| Duration of hypertension, y | 2.5 (0.25–7) |
| 7-Day home blood pressure | |
| Systolic, mm Hg | 132 (129–150) |
| Diastolic, mm Hg | 87 (80–94) |
| Number of antihypertensive drugs, n | 2.5 (1–5) |
| Lateralization on adrenal venous sampling, n (%) | 6/10 (60) |
| Histology | |
| APA, n (%) | 3 (25) |
| Bilateral adrenal hyperplasia, n (%) | 4 (33) |
| Micronodular hyperplasia, n (%) | 3 (25) |
| Unknown, n (%) | 2 (17) |
| Hypokalemia, n (%) | 10 (83) |
| Potassium substitution, mmol/d | 100 (60–140) |
| Plasma aldosterone, pM | 640 (504–1054) |
| Direct renin concentration, ng/L | 0.7 (0.3–1.4) |
| Serum potassium, mM | 4.1 (3.7–4.3) |
| GFR, mL/min/1.73 | 100 (85–108) |
| HbA1c, % | 5.5 (5.3–5.8) |
| Total cholesterol, mM | 4.98 (4.21–5.40) |
| LDL, mM | 2.62 (2.25–3.08) |
| HDL, mM | 1.40 (1.16–1.54) |
| Triglycerides, mM | 1.8 (1.21–2.50) |
| CRP, mg/L | 2.6 (1.3–4.9) |
Discrete variables are expressed as counts with percentages (%) and continuous variables as median with interquartile (IQR) range.
Abbreviations: CRP, C-reactive protein; GFR, glomerular filtration rate; HbA1c, hemoglobin A1c; HDL, high-density lipoprotein; LDL, low-density lipoprotein.
The study was approved by the Regional Ethical Committee (EKNZ 2015-400) and Swissmedic (2017DR2062) and was conducted in accordance with the guidelines for Good Clinical Practice and the Declaration of Helsinki. The trial was registered at Clinicaltrials.gov (NCT03174171).
Intervention
All participants received everolimus (Certican®; Novartis Pharma AG, Rotkreuz, Switzerland) 0.75 mg orally twice per day for 14 days. This dosing regimen is commonly used in the clinic to prevent allograft rejection in heart and kidney transplant patients and has a well-described safety profile.
Study assessment
All participants attended a screening visit and five study visits (Fig. 1). An additional visit was planned to gather histological and clinical data if adrenalectomy was performed after the last saline infusion test. The dosage of beta-blockers, central α-2 agonists, angiotensin-converting enzyme inhibitors, angiotensin receptor blockers, and diuretics was maintained unchanged for the duration of the trial. Where applicable, subjects were taken off mineralocorticoid receptor antagonists at least 6 weeks before the baseline measurements. When required, potassium was substituted orally, aiming for a serum potassium level of ≥3.9 mM.
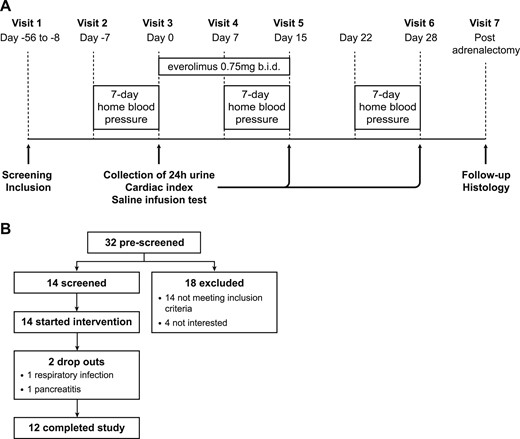
Clinical study design. (A) Study timeline. (B) Enrollment. b.i.d., twice per day.
Baseline measurements included standardized 7-day home blood pressure measurements (Model Omron M6 or Omron M400; OMRON Healthcare, Hoofddorp, Netherlands), performed as recommended by the European Society of Hypertension (20), hemodynamic measurements using the noninvasive thoracic electrical bioimpedance HOTMAN system (Hemo Sapiens Inc., San Ramon, CA), 24-hour urine collection for measurement of steroid hormone metabolites, baseline plasma aldosterone, as assessed with standardized recumbent saline infusion test (2), and other baseline plasma steroid hormone levels, as mentioned below (visits 2 and 3). The measurements were repeated after 14 days of everolimus treatment (visit 5) and after a 2-week washout period (visit 6). In addition, plasma everolimus levels were measured (visits 4, 5, and 6) to ensure medication adherence.
Plasma aldosterone, renin, cortisol (F), adrenocorticotropic hormone (ACTH), dehydroepiandrosterone-sulfate (DHEA-S), testosterone, (17)estradiol, everolimus level, and urine creatinine were measured at the routine laboratory (Department of Clinical Chemistry, University Hospital Basel, Switzerland). Aldosterone was quantified using a competitive chemiluminescence immunoassay [LIAISON® aldosterone (Ref. 310450); DiaSorin Inc., Stillwater, MN]. Renin was measured by a noncompetitive chemiluminescence immunoassay (LIAISON® direct renin (Ref. 310470); DiaSorin Inc., Stillwater, MN].
Twenty-four-hour urinary steroid hormone metabolite levels [aldosterone, tetrahydroaldosterone (TH-Aldo), 18-hydroxycortisol, 18-hydroxycorticosterone, 11-deoxycortisol, F, tetrahydrocortisol (THF), 5α-THF (α-THF), cortisone (E), tetrahydrocortisone (THE), 5α-THE, β-cortol, α-cortolone, β-cortolone, corticosterone, and 11-dehydrocorticosterone and their tetrahydro-metabolites, 11-deoxycorticosterone, dehydroepiandrosterone (DHEA), progesterone, 17α-hydroxyprogesterone, androsterone, 11β-hydroxyandrosterone, androstenedione, and testosterone] were determined as follows: for enzymatic de-glucuronidation, urinary samples (0.5 mL) were pH adjusted with sodium acetate buffer (1 mL, 0.1 M, pH 4.3) and incubated (2 hours, 55°C) with β-glucuronidase from Helix pomatia (80 µL, ≥100 000 U/mL; Sigma-Aldrich, St. Louis, MO) prior solid-phase extraction (SPE). For extraction of free urinary steroids by SPE, de-conjugated urine samples (1.5 mL) and nontreated urine (1 mL) samples were diluted with sodium acetate buffer (0.1 M, pH 4.3) containing internal standard solution [aldosterone-D7 (4 ng/mL), THF-D5 (750 ng/mL), F-D4 (300 ng/mL), E-D2 (300 ng/mL), 11-deoxycortisol-D5 (45 ng/mL), corticosterone-D8 (75 ng/mL), testosterone-D2 (15 ng/mL), 17-OH-progesterone-D8 (150 ng/mL), androstenedione-D7 (45 ng/mL), DHEA-D6 (450 ng/mL), progesterone-D8 (75 ng/mL), etiocholanolone-D5 (300 ng/mL), and androsterone-D2 (450 ng/mL)] to a final volume of 2 mL. Samples were centrifuged (10 minutes, 16,000g, 4°C), and supernatants (1.5 mL) were transferred to Oasis HBL SPE (60 mg, 3 mL; Waters, Baden-Dättwil, Switzerland) cartridges, preconditioned with ethyl acetate and water (3 mL each). Columns were washed with water/ammonium hydroxide (3 × 1 mL, 98:2 v/v), methanol/water/ammonium hydroxide (3 × 1 mL, 20/78/2 v/v/v), and water (3 × 1 mL). Steroids were eluted with ethyl acetate (2 × 0.75 mL), evaporated to dryness (1.5 hours, 35°C), and reconstituted in methanol (50 µL, 10 minutes, 4°C, 1300 rpm). Steroid content was analyzed by ultraperformance liquid chromatography tandem MS (UPLC-MS/MS) using an Agilent 1290 UPLC coupled to an Agilent 6490 triple quadrupole mass spectrometer equipped with a jet-stream electrospray ionization interface (Agilent Technologies, Santa Clara, CA). Analyte separation was achieved within 19 minutes using a reverse-phase column (1.7 µm, 2.1 mm × 150 mm; Acquity UPLC BEH C18; Waters) and water-acetonitrile-formic acid (solvent mixture B: 95:5:0.1 v/v/v and A: 5:95:0.1 v/v/v) as mobile phases. Data acquisition and quantitative analysis were performed by MassHunter (Version B.09.00; Agilent Technologies). THF, α-THF, THE, α- and β-cortolone, β-cortol, 11-deoxycortisol, F, and E were summarized as total glucocorticoid metabolites for analysis. Small volumes and low, 24-hour creatinine levels of the returned urine recorded for some patients indicated possible incomplete, 24-hour collection. To correct for this, we normalized metabolite concentrations to the 24-hour creatinine value.
Study endpoints
The predefined primary endpoint was change in plasma aldosterone in the standard recumbent saline infusion test after 14 days of everolimus treatment compared with baseline. Predefined secondary endpoints were changes in mean systolic and diastolic blood pressure during standardized home blood pressure measurement, change in cardiac index, changes in serum potassium level and dose of potassium substitution, changes in 24-hour urine aldosterone metabolites, and changes in plasma ACTH, renin, F, DHEA-S, testosterone, and (17)estradiol levels after 14 days of everolimus treatment compared with baseline.
With the consideration of the moderate reproducibility of plasma aldosterone in repeated saline infusion tests (21) with a difference of the means by 14%, we defined responders as a reduction of ≥30% from baseline for our post hoc analysis.
Statistical analysis
Data were analyzed using Prism v8.0 (GraphPad Software Inc., La Jolla, CA). Discrete variables are expressed as counts (percentages) and continuous variables as medians with interquartile (IQR) ranges. Statistical analyses were performed using the Mann-Whitney test (mouse experiments) and nonparametric one-way ANOVA (Friedman) with Dunnett post hoc test (clinical study data). P < 0.05 was defined as significant.
Results
Increased activity of mTORC1 in APA is not caused by overexpression of mTORC1 components or its regulators
Previous studies, including ours, reported increased mTORC1 activity in the majority of APAs (13, 19, 22) (Fig. 2A and 2B). To establish whether the observed increased mTORC1 activity is a result of changes in expression of mTORC1 components or proteins involved in mTORC1 regulation, we analyzed the results of deep quantitative MS analysis of six pairs of APA and matched Ctrl (19). The expression of mTORC1 components was not changed in any APA analyzed (Fig. 2C). Three APAs displayed increased expression of insulin receptor and/or IGF2 receptor (Fig. 2D). However, these changes did not correlate with mTORC1 activity (Fig. 2B). The expression of AMP-activated protein kinase (AMPK) components was not altered in APAs (Fig. 2E). Adenomas expressed higher levels of multiple proteins involved in mTORC1 stimulation in response to amino acids (Fig. 2F). However, the most pronounced changes were observed in APAs not characterized by increased mTORC1 activity (patients 1 and 4). Thus, most likely, increased expression of positive mTORC1 regulators is not the underlying cause of increased mTORC1 activity in APAs. Further studies are required to determine whether elevated mTORC1 activity observed in most APAs is a result of common changes in activities of known signaling pathways upstream of mTORC1.
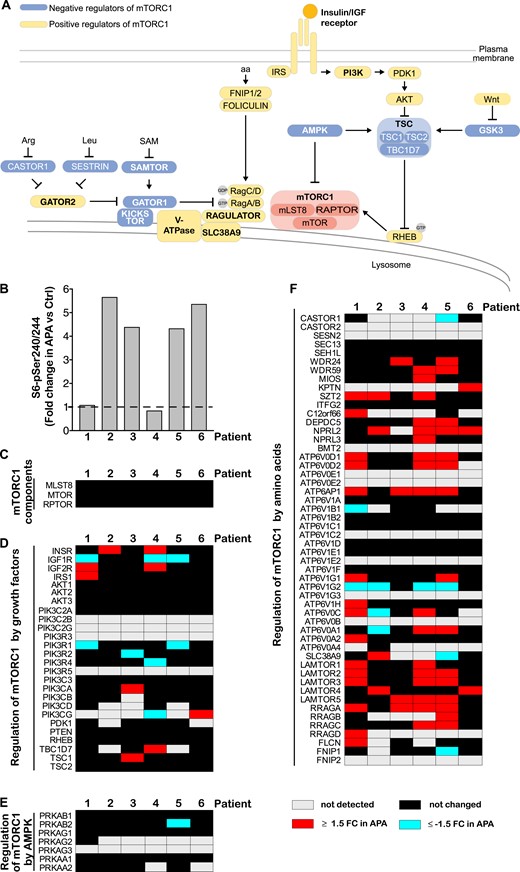
Increased activity of mTORC1 in APA is not caused by overexpression of mTORC1 components or its regulators. (A) Signaling upstream of mTORC1. mTORC1 consists of mTOR, mLST8, and RAPTOR and responds to a diverse set of inputs, most notably, growth factors, amino acids (aa), and cellular energy levels. Insulin and IGFs activate mTORC1 by binding to their cognate receptors, which leads to phosphatidylinositol 3-kinase (PI3K) stimulation and phosphoinositide-dependent kinase 1 (PDK1)-dependent protein kinase B (Akt) activation. Akt phosphorylates and inactivates tuberous sclerosis complex 2 (TSC2), a member of the TSC complex that functions as a GTPase-activating protein toward rat sarcoma homolog protein enriched in brain (RHEB). GTP-bound RHEB binds and activates mTORC1 (23). Amino acids stimulate mTORC1 by modulation of the activity of various proteins and protein complexes that regulate RAG heterodimers. Activated RAGs recruit mTORC1 to the lysosomal surface, where it interacts with RHEB. Amino acids are required for mTORC1 activation in response to any other signal (24). Energy stress (manifested as increased AMP/ATP ratio) suppresses mTORC1 signaling by activation of AMP-activated protein kinase (AMPK), which, in turn, inhibits RAPTOR and activates the TSC complex. Bold font indicates protein complexes (23). (B) mTORC1 activity in APAs. Levels of S6-pSer240/244, a well-established marker of mTORC1 signaling, were quantified in APA and Ctrl of the same patient by immunoblot. (C–F) Expression of (C) mTORC1 components and proteins involved in mTORC1 regulation by (D) growth factors, (E) AMPK, and (F) amino acids in APAs. Proteins were quantified in APA and matched Ctrl by deep quantitative MS. Proteins were considered deregulated in APA when they were differentially expressed by >1.5-fold (P < 0.05, ANOVA-based t test), or they were detected exclusively either in Ctrl or APA samples. APTOR, regulatory protein associated with mTOR; Arg, arginine; FNIP 1/2, folliculin interacting protein 1/2; FC, fold change; GATOR 1, GAP activity toward Rags 1; GSK, glycogen synthase kinase 3; IRS, insulin receptor substrate; Leu, leucine; mLST8, mammalian lethal with Sec13 protein 8; RTBC1D7, TBC1 domain family member 7; SAM, S-adenosylmethionine; SAMTOR, S-adenosylmethionine sensor for the mTORC1 pathway; SLC38A9, solute carrier family 38 member 9.
Systemic inhibition of mTORC1 decreases plasma aldosterone levels in mice
mTORC1 inhibition decreases steroid hormone secretion from primary adrenocortical cells and adrenocortical cell lines (13, 22). To assess whether mTORC1 affects adrenal steroid synthesis in vivo, we systemically treated mice with the mTORC1 inhibitor rapamycin and assessed their plasma aldosterone and corticosterone levels. Treatment with rapamycin (24 hours) reduced adrenal mTORC1 activity (Fig. 3A) and significantly reduced plasma aldosterone levels (P = 0.007; Fig. 3B). Plasma corticosterone levels tended to be lower in rapamycin-treated animals, but the difference was not statistically significant (Fig. 3B). Aldosterone is regulated mainly by Ang II. However, the levels of plasma Ang II did not change upon rapamycin treatment (Fig. 3C). Thus, systemic mTORC1 inhibition with rapamycin reduces circulating aldosterone levels independent of Ang II. Whether rapamycin lowers plasma aldosterone levels directly by affecting aldosterone synthesis in the adrenal gland or indirectly by affecting the expression of paracrine factors regulating aldosterone synthesis and/or aldosterone metabolism requires further studies.
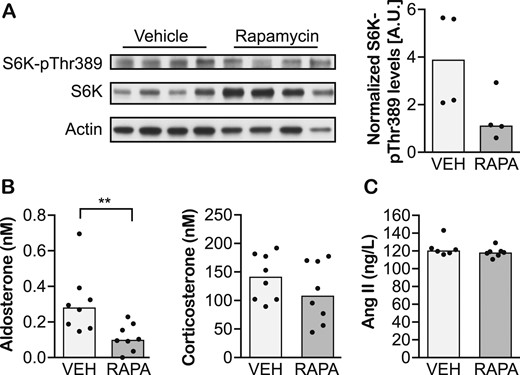
Systemic inhibition of mTORC1 decreases plasma aldosterone levels in mice. (A) Immunoblot evaluating levels of S6K-pThr389, the activated form of S6K, and direct target of mTORC1 signaling in adrenal glands of mice treated with vehicle (VEH) or rapamycin (RAPA) for 24 h. (B) Plasma aldosterone and corticosterone, and (C) Ang II levels in mice treated with vehicle or rapamycin for 24 h. Data are shown as medians. n = 4–8 animals per group. **P < 0.01 (Mann-Whitney test).
Systemic mTORC1 inhibition with everolimus decreases plasma aldosterone levels in some PA patients
To assess whether systemic mTORC1 inhibition could decrease aldosterone levels also in PA patients, we designed an open-label, proof-of-concept study on treatment of PA with the oral mTORC1 inhibitor everolimus. In this study, subjects received everolimus for 2 weeks, and their plasma steroid hormone levels, along with other biochemical and clinical parameters, were assessed before and after treatment, as well as after a 2-week washout period (Fig. 1A). Fourteen patients with PA were enrolled, of which 12 completed the study (Fig. 1B). One dropout was a result of a respiratory tract infection, and another was because of acute pancreatitis requiring hospitalization with full recovery without sequelae. The latter was reported as a serious, adverse event, probably related to everolimus. Ten subjects reported mild to moderate adverse events, which were mainly skin or mucosal changes. Participant adherence was good, as reflected by detectable plasma everolimus levels during the treatment.
Median postinfusion plasma aldosterone levels were comparable at baseline, after the 2-week everolimus treatment, and after the washout period (Fig. 4A). However, post hoc individual subject analysis allowed identification of four responders defined by a ≥30% reduction in plasma aldosterone levels after treatment (Fig. 4B). Importantly, aldosterone levels in the responder cohort returned to the baseline values after the washout period (Fig. 4B), indicating the causative effect of the treatment. The effect of everolimus appears to be specific to aldosterone among the measured steroid hormones, as no similar changes were observed for F (Fig. 4C and 4D), testosterone (Fig. 5A and 5B), DHEA-S (Fig. 5C and 5D), or (17)estradiol (Fig. 5E and 5F). The apparent reduction in plasma F levels after the washout period (Fig. 4C) was most likely an artifact as a result of varying stress levels at repeated visits and therefore, not treatment related. The observed changes in aldosterone were not accompanied by changes in plasma ACTH concentrations (Fig. 4E and 4F) or serum potassium levels (Table 2). Thus, everolimus treatment appears to lower plasma aldosterone in a subset of PA patients independently of changes in ACTH or potassium concentration. There was no apparent correlation among age, sex, severity of hypertension, presence of hypokalemia, or underlying cause of PA and everolimus response. Thus, further studies are needed to distinguish between potential responders and nonresponders.
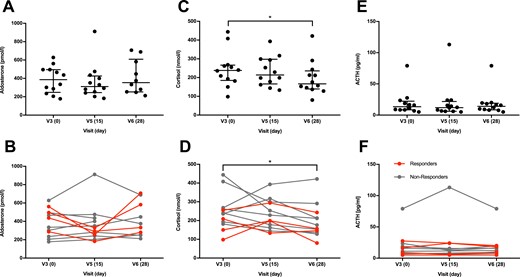
Systemic mTORC1 inhibition with everolimus decreases plasma aldosterone levels in some PA patients. (A–D) Plasma hormone levels at the baseline (V3, d0) and after a 2-week everolimus treatment (V5, d15) and a 2-wk washout period (V6, d28). (A) Overall, postinfusion plasma aldosterone levels were not significantly changed (P = 0.436) after a 2-wk everolimus treatment, (B) but a marked reduction was observed in four subjects, shown as responders in red, as opposed to nonresponders in gray. (C and D) This pattern was not observed for F, which was significantly lower after washout (P = 0.017, post hoc–adjusted P = 0.024). (E and F) The tendency of reduced aldosterone levels and decreased F was not reflected by changes in ACTH (P = 0.320). Data are shown with median and IQR range. Data were analyzed with nonparametric one-way ANOVA (Friedman) and Dunnett post hoc test. n = 10, as a result of missing values at visit 6 for subjects 11 and 12 for aldosterone; n = 12 for F and ACTH. *P < 0.05.
![Systemic mTORC1 inhibition with everolimus does not influence sex hormones. After a 2-week everolimus treatment, no significant changes were observed in plasma testosterone [P = 0.078; (A) men; (B) women], DHEA-S [P = 0.179; (C) men; (D) women], or (17)estradiol [P = 0.843; (E) men; (F) women]. Data are shown with median and IQR. n = 12. Data analysis with Friedman test. Subjects who showed a marked decrease of plasma aldosterone after everolimus treatment are marked as responders in red; nonresponders are marked in gray. Men and women are shown separately as a result of differing reference ranges and variability of sex hormones during the menstrual cycle.](https://oup.silverchair-cdn.com/oup/backfile/Content_public/Journal/jcem/104/10/10.1210_jc.2019-00563/1/m_jc.2019-00563f5.jpeg?Expires=1749705795&Signature=E4Y~SI1-u3j3z4fwdfYTRa-BqQWAd0QUNyJtw~lzgUMjGnmdlnUPmbb3fnwDmSLxd~ZIVszzQxURA3d7-QvijhYsUqaUUpibGecnan-axCq0LdQGUoeA5IWd9t2YN80xHuR7HznpM8OekdeFrDSmCfiCFvo2Ce2xl3Wywk~AbIXl7Hs88t7zgO7RYSS738MqVAY0xzdzt4zrzA2OE8UNVEh1ZW3cICJlqI4p0x4auebhhu6EK9DrlZqEIVMgrJbC~hDgq0H86pmT7QpSXPl-g1Gk06aMezJYui-wV28bJTt7Qr81TgnYgtq6ZxWxBI6yUHYPU7~C-TQMQCe1Cj2Syw__&Key-Pair-Id=APKAIE5G5CRDK6RD3PGA)
Systemic mTORC1 inhibition with everolimus does not influence sex hormones. After a 2-week everolimus treatment, no significant changes were observed in plasma testosterone [P = 0.078; (A) men; (B) women], DHEA-S [P = 0.179; (C) men; (D) women], or (17)estradiol [P = 0.843; (E) men; (F) women]. Data are shown with median and IQR. n = 12. Data analysis with Friedman test. Subjects who showed a marked decrease of plasma aldosterone after everolimus treatment are marked as responders in red; nonresponders are marked in gray. Men and women are shown separately as a result of differing reference ranges and variability of sex hormones during the menstrual cycle.
Everolimus Lowers Plasma Aldosterone Levels in Some PA Patients, Decreases Blood Pressure, and Attenuates Renin Suppression
| V3 (D 0) | V5 (D 15) | V6 (D 28) | |
|---|---|---|---|
| Basal plasma aldosterone, pM | 640 (504–1054) | 668 (468–831) | 675 (427–981) |
| Direct renin concentration, ng/L | 0.7 (0.3–1.4) | 1.5 (0.7–4.7)a | 0.7 (0.2–3.9)b |
| Plasma F, nM | 238 (185–267) | 214 (166–298) | 167 (139–236)b |
| ACTH, pg/mL | 13.5 (8.4–22.3) | 12.0 (6.2–21.8) | 14.1 (8.4–19.1) |
| Copeptin, pM | 6 (3.9–8.9) | 6 (4.7–9.2) | 5.7 (3.4–9.7) |
| Serum potassium, mM | 4.1 (3.7–4.3) | 4.0 (3.9–4.2) | 3.8 (3.7–4.0) |
| Potassium substitution, mmol/d | 100 (60–140) | 120 (60–140) | 120 (60–140) |
| 7-Day home blood pressure | |||
| Systolic, mm Hg | 132 (129–150) | 130 (125–140)b | 134 (129–149) |
| Diastolic, mm Hg | 87 (80–94) | 84 (78–90)b | 86 (82–95) |
| Cardiac index, L/min/m2 | 2.5 (1.6–3.4) | 2.7 (2.4–3.3) | 2.5 (1.5–2.9) |
| Heart rate, beats per min | 55 (52–68) | 61 (54–66) | 63 (57–66) |
Comparison of baseline measurements (V3, day 0) after a 2-wk treatment with everolimus (V5, d 15) and after a 2-wk washout period (V6, d 28). Data are shown with median and IQR.
P < 0.001 vs baseline (Friedman test with Dunnett post hoc test).
P < 0.05.
Everolimus treatment influences 24-hour urine steroid metabolome
To distinguish whether the treatment-associated decrease in plasma aldosterone in the responder cohort resulted from the decreased synthesis or enhanced metabolism, we measured the levels of aldosterone and its major metabolite TH-Aldo in urine collected over 24 hours. Three responders displayed a marked decrease in urine aldosterone and TH-Aldo levels upon everolimus treatment (Fig. 6A and 6B), suggesting reduced aldosterone synthesis. It was impossible to determine changes in urine aldosterone and TH-Aldo levels in the fourth responder as a result of the loss of the baseline sample. Similar to plasma measurement, no changes in median urine aldosterone and TH-Aldo concentrations were observed when patients were analyzed together (Fig. 6A and 6B). Furthermore, no consistent changes in urine F, total glucocorticoid metabolites, testosterone, 11β-hydroxyandrosterone, and progesterone levels were observed (Fig. 6C–6G). Additionally, no changes were observed in the levels of 11-deoxycorticosterone, 18-hydroxylated F, and corticosterone or the tetrahydro-metabolites of corticosterone. Taken together, these data suggest that in a subset of PA patients, everolimus specifically reduces aldosterone synthesis but does not show a consistent effect on other adrenal steroids, including those with mineralocorticoid effects.
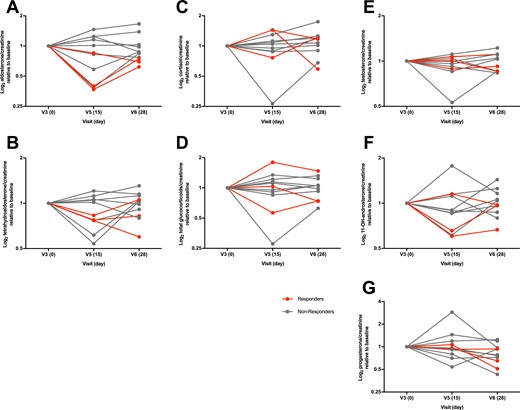
Everolimus treatment influences 24-h urine steroid metabolome. Steroid hormone metabolites were normalized to 24-h creatinine to account for possible incomplete urine collection. The 24-h excretion of (A) aldosterone (P = 0.629), (B) TH-Aldo (P = 0.732), (C) F (P = 0.100), (D) total glucocorticoid metabolites (THF, α-THF, THE, α- and β-cortolone, β-cortol, cortexolone, F, and E; P = 0.976), (E) testosterone (P = 0.470), (F) 11β-hydroxyandrosterone (P = 0.470), and (G) progesterone (P = 0.117) was not significantly different after a 2-wk everolimus treatment (V5, d15) and a 2-wk washout (V6, d28) compared with baseline (V3, d0). Subjects who showed a marked decrease of plasma aldosterone after everolimus treatment are marked as responders in red; nonresponders are marked in gray. Data are shown with median and IQR. Data analysis with nonparametric one-way ANOVA (Friedman) and Dunnett post hoc test. n = 11 as baseline 24-h urine for steroid metabolome from subject one was not collected.
Everolimus treatment decreases blood pressure
To assess whether everolimus treatment could lower blood pressure in PA patients, we asked the study participants to take standardized home blood pressure measurements during the trial. Systolic and diastolic blood pressure measurements were significantly improved after the everolimus treatment and returned to the baseline values after the washout period (Fig. 7A and 7B). The observed changes in blood pressure were independent of changes in cardiac index (Fig. 7C). Thus, everolimus treatment lowers blood pressure in hypertensive PA patients. Whether these changes are a consequence of reduced aldosterone levels requires further studies.
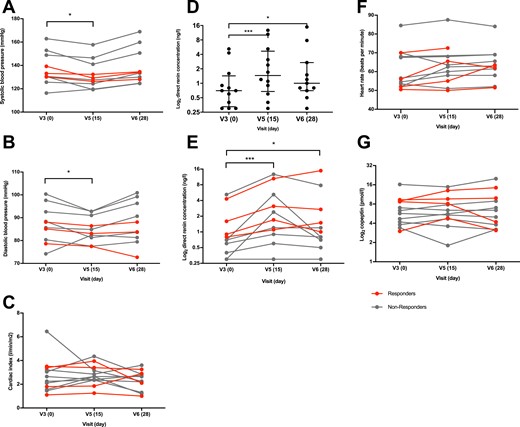
Everolimus treatment decreases blood pressure and attenuates renin suppression. (A and B) 7-Day home blood pressure measurements showed a significant decrease in systolic (P = 0.001, adjusted P = 0.011 d15 vs d0 and P > 0.999 day 28 vs d0) and diastolic (P < 0.026, adjusted P = 0.042 d15 vs d0 and P > 0.999 d28 vs d0) blood pressure. (C) Cardiac index (P = 0.179) was not significantly changed. (D and E) Renin increased significantly after everolimus treatment (P < 0.0001, adjusted P = 0.001 d15 vs d0 and P = 0.023 d28 vs d0). (F) Heart rate (P = 0.168) and (G) copeptin (P = 0.937) showed no significant difference. Subjects who showed a marked decrease of plasma aldosterone after everolimus treatment are marked as responders in red; nonresponders are marked in gray. (D) Data are shown with median and IQR. Data analysis with nonparametric one-way ANOVA (Friedman) and Dunnett post hoc test. n = 10 for blood pressure and heart rate, n = 11 for renin as a result of missing data, n = 12 for cardiac index and copeptin. *P < 0.05, ***P < 0.001.
Everolimus treatment attenuates renin suppression
High aldosterone levels characteristic of PA lead to suppression of renin, a protease secreted by the renal glomeruli and involved in the regulation of angiotensin and aldosterone. We evaluated whether everolimus treatment would reduce renin suppression. Indeed, plasma renin concentrations were significantly increased after the everolimus treatment compared with baseline (Fig. 7D and 7E), although still remained in the suppressed range. Heart rate (Fig. 7F), urine volume (Table 2), and copeptin, a marker for stress response and antidiuretic hormone release, remained unchanged (Fig. 7G). Thus, the effect of everolimus on plasma renin concentration appears not to be a result of volume depletion. Whether this effect is a result of subtle changes in aldosterone levels or the action of everolimus outside adrenal glands remains to be determined.
Discussion
Plasma aldosterone levels decreased markedly after everolimus treatment and returned close to baseline after the washout period in four out of 12 subjects. This pattern was mirrored by changes in urinary aldosterone and TH-Aldo levels, strongly suggesting a treatment-related reduction in aldosterone synthesis in a subset of PA patients.
There may be several reasons why everolimus did not lower plasma aldosterone levels in all subjects. First, mTORC1 is hyperactivated in most but not all PA adrenals (13, 22). Second, everolimus response might depend on the nature of the molecular event leading to PA development, and APAs differ considerably on a molecular level (25). Whereas transcriptome and methylome analyses have revealed upregulation of genes involved in the Wnt signaling pathway (Fig. 2A) in APAs with somatic mutations in the gene encoding KCNJ5 (25), the molecular characteristics of APAs with less frequent somatic mutations are less well described. Third, even though the genetic basis for sporadic bilateral adrenal hyperplasia is still poorly understood (26), germline variations in the KCNJ5 gene might also play a role in certain patients with bilateral adrenal hyperplasia (27). Scholl et al. (28) have reported that certain macrolides can inhibit excessive aldosterone production caused by KCNJ5G151R and KCNJ5L168R mutations. Thus, it is plausible that everolimus, which also has a macrolide structure, might inhibit aldosterone production only in adrenocortical cells harboring particular KCNJ5 mutations or mutations in another ion channel(s). Further studies are required to correlate responsiveness to everolimus treatment with molecular characteristics of PA adrenal glands.
Although plasma aldosterone levels were prominently reduced only in four study participants, we observed a general reduction in median systolic and diastolic blood pressure and increased renin levels after the 2-week treatment with everolimus. It is possible that these changes were related to subtle changes in aldosterone concentrations that were not detected by the standardized recumbent saline infusion test or steroid metabolome assessment in 24-hour urine. The saline infusion test might not be sensitive enough to evaluate modest changes in aldosterone synthesis, as the reproducibility of the test has been reported to be moderate (21) under renin-angiotensin-aldosterone system (RAAS)-neutral therapy. Furthermore, everolimus has been reported to be associated with hypertension (29) rather than hypotension. However, it is usually used at higher doses and in combination therapies for transplant and cancer patients. Reports on the effect of everolimus alone on blood pressure and the RAAS are scarce. Alternatively, everolimus could affect the hypothalamus and sympathetic nervous system activity and consecutively lead to increased plasma renin concentration (30). It should be noted that a substantial proportion of patients took beta-blockers and central α-2 agonists, which lower renin levels and might have mitigated the rise in renin. Nevertheless, this would not explain the parallel fall in blood pressure. In addition, as this study was not powered to detect changes in blood pressure, a further study comprising a larger cohort and a longer treatment period is needed to elucidate potential effects of everolimus on the RAAS and blood pressure and to understand fully the differences between potential responders and nonresponders. Moreover, with the consideration of the potential side effects and the finding from a recent retrospective cohort study that only an increase in plasma renin activity to ≥1 μg/L/h reverses the excess risk for cardiovascular morbidity and mortality in PA compared with essential hypertension (31), the most appropriate dosage or an mTORC1-inhibiting compound with an improved efficacy and safety profile should be investigated.
One limitation of our study is the single-arm, open-label design, and therefore, only changes from baseline can be reported. Furthermore, the included subjects had only mild hypertension, most likely as a result of diagnosis at earlier stages of the disease, resulting from an increasing awareness for PA and broadened indications for screening. Therefore, the study population might not represent the historically described population with PA, which presented most often with moderate to severe hypertension (32, 33).
In conclusion, we suggest that increased mTORC1 activity in APA is most likely a result of downstream signaling changes rather than of overexpression of its components or canonical positive regulators. We provide evidence that mTORC1 inhibition selectively lowers aldosterone in mice and a subset of PA patients and significantly reduces blood pressure and renin suppression in the tested patient cohort. Our findings highlight that the mTORC1 signaling pathway plays a relevant role in PA.
Acknowledgments
We thank Susanne Rüsch for support in conducting the clinical study.
Financial Support: M.N.H. and M.M.S. received funding from Novartis Foundation for Medical Biological Research; M.M.S. received funding from Novartis/University of Basel Excellence Scholarship for Life Sciences; A.O. received funding from the Swiss National Science Foundation (31003A-179400); and F.B. and M.R. have been supported by the Deutsche Forschungsgemeinschaft (DFG) within the CRC/Transregio 205/1 “The Adrenal: Central Relay in Health and Disease” and Else Kröner-Fresenius Stiftung (2013_A182 to F.B. and 2015_A171 to M.R.).
Clinical Trial Information: Clinicaltrials.gov no. NCT03174171 (registered 2 June 2017).
Disclosure Summary: The authors have nothing to disclose.
Abbreviations:
- ACTH
adrenocorticotropic hormone
- AMPK
AMP-activated protein kinase
- Ang II
angiotensin II
- APA
aldosterone-producing adenoma
- Ctrl
control adrenal cortex samples
- DHEA
dehydroepiandrosterone
- DHEA-S
dehydroepiandrosterone-sulfate
- E
cortisone
- F
cortisol
- IQR
interquartile
- MS
mass spectrometry
- mTORC1
mammalian target of rapamycin complex 1
- PA
primary aldosteronism
- RAAS
renin-angiotensin-aldosterone system
- SPE
solid-phase extraction
- TH-Aldo
tetrahydroaldosterone
- THE
tetrahydrocortisone
- THF
tetrahydrocortisol
- UPLC
ultraperformance liquid chromatography
- α-THF
5α-tetrahydrocortisol
