


Abstract
Regulatory T (Treg) cells and T-helper-17 (Th17) cells may be involved in endometriosis. Information on the pattern of change in the percentages of Treg and Th17 cells in the peripheral blood (PB) and peritoneal fluid (PF) of women with early and advanced endometriosis is unclear.
To investigate the pattern of change in the percentages of Treg and Th17 cells in the PB and PF of women with early and advanced endometriosis.
We recruited 31 women with laparoscopically and histologically confirmed, revised American Society of Reproductive Medicine stage I-II endometriosis, 39 women with stage III-IV endometriosis, and 36 control subjects without visible endometriosis. PB and PF samples were collected and T-cell subpopulations analyzed by flow cytometry using specific monoclonal antibodies recognizing CD4+, CD25+, FOXP3+, and IL-17A+ markers. PF concentrations of TGF-β and IL-17 were measured by ELISA.
The percentages of CD25+FOXP3+ Treg cells within the CD4+ T-cell population were significantly higher in the PF of women with advanced endometriosis than in either early endometriosis or in control subjects (P < 0.05 for both). A persistently lower percentage of CD4+IL-17A+ Th17 cells was found in both PB and PF of women with early and advanced endometriosis. Compared with IL-17 levels, PF levels of TGF-β were significantly higher in women with endometriosis (P = 0.01).
Our findings reconfirmed the current speculation that endometriosis is related to alteration of Treg and Th17 cells in the pelvis causing survival and implantation of ectopic endometrial lesions.
Endometriosis is a multifactorial, chronic inflammatory condition affecting 6% to 10% women of childbearing age and is clinically manifested with dysmenorrhea, chronic pelvic pain, and infertility (1). Many theories have been proposed to explain the development of endometriosis, and one of the most accepted is the retrograde menstruation theory (2). It has been proposed that a complementary theory may be involved by which defective immune response could determine survival and implantation of ectopic endometrial cells (3–6). According to this theory, inflammatory reactions send signals to immune systems to scavenge endometrial cells at the ectopic sites; however, in women with endometriosis, an impairment of this process promotes reduced attack on ectopic endometrial cells, with consequent survival and implantation in pelvis.
There is a growing evidence that endometriosis is associated with disturbed local and systemic immune responses. These may include increased levels of activated peritoneal macrophages and various proinflammatory cytokines, abnormal T- and B-lymphocyte activation, reduced natural killer cell activity, and the production of various autoantibodies (1, 4, 7–10). One emerging focus on endometriosis pathogenesis is the role of specialized anti-inflammatory populations of T lymphocytes termed regulatory T (Treg) cells. Upon their first molecular characterization as CD4+CD25+ Treg cells in 2001, Treg cells were detected in diverse inflammatory pathologies such as allergies, autoimmune diseases, and cancer (11). Treg cells are potent suppressors of inflammatory immune responses and are essential in preventing destructive immunity in all tissues. Currently, Treg cells are characterized by the expression of CD25+CD127-FOXP3+ cells, because CD25 and transcription factor Forkhead box protein P3 (FOXP3) are constitutive markers to isolate Treg cells (12–14).
The production of IL-17 by a subset of T cells was discovered in 1999 using T-cell clones from the joints of patients with rheumatoid arthritis (15, 16). The results were subsequently confirmed in mice and the term T-helper-17 (Th17) subset was introduced in 2005 in the mouse as a T-helper subset distinct from Th1 and Th2 cells (16–18). Because of the opposite effect on the immune response, the Th17/Treg balance is critical in maintaining immune homeostasis and persistence of inflammation (19, 20). A tug of war between destructive immune cells (Th1/Th17) and protective or immuno-tolerant cells (Treg cells) operates in human body in an attempt to clear microbes or unwanted attached cells, thereby protecting the body against infection or development of a lesion (20, 21). Sequence screening identified an IL-17 family comprising six members from IL-17A to IL-17F. Among them, IL-17A and IL-17F are the closest members, with 50% homology, and they share most of their activities, with IL-17A being more potent than IL-17F (16). Increases in the level of IL-17A in peritoneal fluid (PF) correlated with the severity of endometriosis and infertility associated with this disorder (22). Another observation showed the presence of Th17 cells in the PF of women with advanced endometriosis confirmed the presence of IL-17A–producing cells in ovarian endometrioma, and researchers suggested a role of IL-17 in the pathogenesis of endometriosis (23). Numasaki et al. (24) reported that IL-17A promotes angiogenesis and tumor growth. A more recent study using a small number of patients demonstrated that the percentage of Th17 cells in PF was higher in severe endometriosis (stage III-IV) than in early (stage I-II) endometriosis (25). Detailed information on Treg and Th17 cell profiles in the peripheral blood (PB) and PF derived from women with early endometriosis and those with advanced endometriosis is limited.
Some elegant studies demonstrated that Treg cells are in higher concentration in tissues and body fluids (eutopic endometrium, PF, and PB) of women with endometriosis when compared with women without endometriosis (7, 26–28). The authors speculated that an increased amount of Treg cells could promote anti-inflammatory environment by suppressing a possible immune response against lesion development and permitting ectopic endometrial implantation and propagation. It is important to note that most of these studies were limited to patients with advanced endometriosis. A differential increased pattern of FOXP3+ Treg-cell accumulation in the endometria was observed during the proliferative phase (29) or during the secretory phase (26) of the menstrual cycle. Information on the pattern of Treg cells and Th17 cells in the PB and PF of women with and without endometriosis across the different phases of menstrual cycle is unclear.
In this study, we investigated the levels of CD25+FOXP3+ Treg cells and IL-17A+ Th17 cells within the CD4+ T-cell population in the PB and PF collected from control subjects (i.e., women without any visible endometriosis), women with early endometriosis (stage I-II), and advanced endometriosis (stage III-IV). We analyzed the levels of Treg cells and Th17 cells on the basis of the different phases of menstrual cycle and color of peritoneal lesions. We measured levels of TGF-β, one of the differentiation factors of Treg cells, and IL-17, one of the potential cytokines released by the effector immune cells in the PF collected from these three groups of women. Finally, we discussed the potential role of Treg and Th17 cells in the initiation and progression of endometriosis.
Materials and Methods
Patients
We collected PB and PF samples from two different populations of control subjects, women with early endometriosis and advanced endometriosis for the analysis of Treg cells and Th17 cells. Between October 2015 and September 2016, PF and PB samples were prospectively collected during laparoscopic surgery from 39 women with endometriosis and 21 control subjects for analysis of Treg cells. Among the 39 women with endometriosis, 15 women had stage I-II endometriosis and 24 had stage III-IV endometriosis. The control group consisted of women without any visible endometriosis, pelvic inflammation, or related pathology who underwent laparoscopic surgery for dermoid cyst, serous cyst adenoma, mucinous cyst adenoma, or paraovarian cyst.
Because it is difficult to analyze Treg cells and Th17 cells in additional samples from the same patient at the same time, PF and PB samples were prospectively collected from a separate group of 31 women with endometriosis and 15 control subjects for the analysis of Th17 cells between March 2017 and December 2017. Among the 31 women with endometriosis, 16 had stage I-II endometriosis and 15 had stage III-IV endometriosis. As in the earlier control group, the 2017 control group consisted of women who underwent laparoscopic surgery for dermoid cyst, subserosal myoma, mucinous cyst adenoma, and paraovarian cyst without any other pelvic pathology. Women with endometriosis underwent either elective laparoscopy for infertility or diagnostic laparoscopy for dysmenorrhea or chronic pelvic pain.
The staging and the morphological distribution of peritoneal lesions were based on the revised classification of the American Society of Reproductive Medicine (ASRM) (30). Peritoneal lesions of endometriosis were diagnosed by their macroscopic color according to published criteria (31) and categorized as red, black, and white lesions, as proposed in the latest revision of the ASRM classification (30). The diagnosis of all cases with and without endometriosis was confirmed morphologically during surgery and subsequently by histopathology. None of the patients and control subjects in the Treg- and Th17-cell analysis group had any other chronic inflammatory or autoimmune disorders. Four patients in the control group and three patients in the endometriosis group who underwent Th17-cell analysis received hormonal medication within 3 months before undergoing surgery. None of the patients and control subjects in the Treg-cell analysis group received any hormonal medication in the 3 months before surgery.
The phases of the menstrual cycle in women with and without endometriosis were determined by histological dating of eutopic endometrial samples taken simultaneously with pathological lesions. All samples were collected in accordance with the guidelines of the Declaration of Helsinki and with the approval of the institutional review board (IRB) of Nagasaki University (IRB no. 14011). An informed consent was obtained from all women.
Collection and preparation of PF and PB
PF was aspirated from the cul-de-sac at the beginning of the laparoscopic procedure under general anesthesia. All samples of PF contaminated with blood were excluded from the study. Mononuclear cells (MNCs) were isolated from PF samples of patients by Lymphocyte Separation Medium (PromoCell, Heidelberg, Germany) and density-gradient centrifugation at 450g for 40 minutes. Mononuclear cells from heparinized blood were separated by RosetteSep reagent with a SepMate collection tube according to the manufacturer’s instruction (STEMCELL Technologies, Vancouver, BC, Canada). Cells were collected, washed twice with PBS containing 2% fetal bovine serum [i.e., fluorescent-activated cell sorting (FACS) buffer]. The cells were suspended in 100 μL of FACS buffer and mixed with 1 mL of 1×Pharm Lyse (BD Biosciences, San Jose, CA). After incubation for 15 minutes at room temperature (RT), the cells were collected by centrifuge at 200g for 5 minutes, washed twice with FACS buffer, and suspended at 5×10⁴/μL in FACS buffer for flow cytometry analysis.
Flow cytometry analysis of Treg cells
The cell suspension was then mixed with the same volume of the fluorescein isothiocyanate–conjugated anti-human CD4 and the allophycocyanin-conjugated anti-human CD25 antibodies (both from BD Biosciences) for 20 minutes at RT with a light shield. Cells were then washed with FACS buffer, fixed, and permeabilized with Human FoxP3 Buffer Set (BD Biosciences) according to the manufacturer’s instruction. The cells were then further stained with the phycoerythrin-conjugated antihuman FoxP3 antibody (BD Biosciences) for 30 minutes at RT. The cells were washed and suspended in FACS buffer and then applied to flow cytometric measurements on a BD LSR Fortessa X-20 using FACS Diva software (BD Biosciences). Isotype-matched antibodies conjugated with respective fluorochromes were used for controls.
Flow cytometry analysis of Th17 cells
PB (1 mL) or cells collected from PF (suspended in 1 mL of RPMI1640 containing 10% fetal bovine serum) were stimulated with 50 ng/mL phorbol 12-myristate 13-acetate and 1 μg/mL ionomycin (both from Sigma-Aldrich, St. Louis, MO) for 4 hours at 37°C in an atmosphere containing 5% CO2, followed by additional incubation for 1 hour in the presence of GoldiStop (BD Biosciences). Cells were collected, washed, and stained with fluorescein isothiocyanate–conjugated anti-human CD4 antibody, as described. The cells were then fixed and permeabilized with BD Cytofix/Cytoperm Fixation and Permeabilization Solution (BD Biosciences) according to the manufacturer’s instruction, and further stained with the allophycocyanin-conjugated anti-human IL-17A antibody (Affimetrics, San Diego, CA) for 20 minutes at RT. The cells were washed and suspended in FACS buffer and then applied to flow cytometric measurements on a BD LSR Fortessa X-20 using FACS Diva software (BD Biosciences). Isotype-matched antibodies conjugated with respective fluorochromes were used for controls.
TGF-β and IL-17 levels in the PF
The concentrations of TGF-β and IL-17 were measured in the PF of 21 control subjects and 39 women with endometriosis. All PF samples were collected prospectively and assays were performed retrospectively. Before any internal manipulation, all visible PF was aspirated from the anterior and posterior cul-de-sac. The PF samples were then clarified by centrifugation at 200g for 10 minutes; the supernatant was isolated and stored at −70°C until assayed. Samples contaminated with blood were not included. PF concentrations of TGF-β and IL-17 collected from each patient were measured in duplicate using a commercially available sandwich ELISA (Quantikine; R&D System, Minneapolis, MN) according to the manufacturer’s instructions. The antibodies used in TGF-β and IL-17 determination do not cross-react with other cytokines. The limit of detection was 15.4 pg/mL and 15.0 pg/mL for TGF-β and IL-17, respectively. The intra-assay and interassay coefficients of variation were <10% for this assay.
Statistical analysis
All results are expressed as mean ± SD or median and interquartile ranges (IQRs). The clinical characteristics of the subjects between groups in each study population were analyzed by one-way ANOVA. Because the percentages of Treg/Th17 cells in PB or PF and concentrations of TGF-β/IL-17 in the PF were not normally distributed, any difference in the percentage of Treg or Th17 cells and PF levels of TGF-β/IL-17 between groups was analyzed by nonparametric tests such as the Mann-Whitney U test. For nonparametric analysis among groups, the Kruskal-Wallis test was used to determine any difference among the groups (among control subjects, stage I-II endometriosis and stage III-IV endometriosis, or among phases of the menstrual cycle). The distribution of Treg cells and Th17 cells in the PB/PF and PF levels of TGF-β/IL-17 according to groups was expressed using box-and-whisker plots with the medians and IQR. A value of P < 0.05 was considered statistically significant. Data analysis was conducted using SAS software, version 9.4 (SAS Institute Inc. Cary, NC).
Results
The clinical characteristics of patients with and without endometriosis from whom PB and PF samples were prospectively collected from two different populations for the analysis of CD25+FoxP3+ Treg cells and IL-17A+ Th17 cells within the CD4+ T-cell population are shown in Tables 1 and 2, respectively. Results of the Kruskal-Wallis test indicated no significant difference in the age distribution among control subjects, women with stage I-II endometriosis, and women with stage III-IV endometriosis in either of these two populations. There was no difference in the other clinical parameters among these three groups of women.
Clinical Profiles of Patients With and Without Endometriosis From Whom Samples Were Collected for the Analysis of Treg Cells in the PB and PF
| Control | Revised ASRM Stage I-II | Revised ASRM Stage III-IV | |
|---|---|---|---|
| (n = 21) | (n = 15) | (n = 24) | |
| Age, mean ± SD, y | 31.6 ± 11.9 | 38.1 ± 6.7 | 37.8 ± 8.2 |
| Age range, y | 20–52 | 27–46 | 21–52 |
| Menstrual cycle | |||
| P/S/M/A | 5/12/4/0 | 4/9/2/0 | 10/11/3/0 |
| Revised ASRM staging | |||
| I / II / III / IV | 0/0/0/0 | 11/4/0/0 | 0/0/11/13 |
| Ovarian endometrioma | |||
| Unilateral/bilateral | 0/0 | 0/0 | 19/5 |
| Distribution of peritoneal lesions | |||
| Red/black/white | 0/0/0 | 6/8/1 | 3/8/6 |
| Complaint of dysmenorrhea | |||
| Present/absent | 0/0 | 4/11 | 8/16 |
| Distribution of pelvic adhesion | |||
| Filmy/dense/none | 0/0/21 | 0/0/15 | 3/9/12 |
| Coexistence of benign disease | |||
| Endometriosis/dermoid cyst/ | |||
| SCA/MCA/POC | 0/16/2/1/2 | 15/0/0/0/0 | 24/0/0/0/0 |
Data given as number unless otherwise indicated.
Abbreviations: A, amenorrhea; M, menstrual phase; MCA, mucinous cyst adenoma; P, proliferative phase; POC, paraovarian cyst; S, secretory phase; SCA, serous cyst adenoma.
Clinical Profiles of Patients With and Without Endometriosis From Whom Samples Were Collected for the Analysis of Th17 Cells in the PB and PF
| Control | Revised ASRM Stage I-II | Revised ASRM Stage III-IV | |
|---|---|---|---|
| (n = 15) | (n = 16) | (n = 15) | |
| Age, mean ± SD, y | 38.5 ± 7.0 | 33.2 ± 6.1 | 37.6 ± 7.6 |
| Age range, y | 29–50 | 20–42 | 25–45 |
| Menstrual cycle | |||
| P/S/M/A | 1/7/3/4 | 4/10/0/2 | 4/9/1/1 |
| Revised ASRM staging | |||
| I / II / III / IV | 0/0/0/0 | 14/2/0/0 | 0/0/7/8 |
| Ovarian endometrioma | |||
| Unilateral/bilateral | 0/0 | 0/0 | 9/6 |
| Distribution of peritoneal lesions | |||
| Red/black/white/mixed | 0/0/0/0 | 3/8/0/5 | 1/12/0/0 |
| Complaint of dysmenorrhea | |||
| Present/absent | 0/0 | 5/11 | 6/9 |
| Distribution of pelvic adhesion | |||
| Filmy/dense/none | 2/0/13 | 1/0/15 | 4/5/6 |
| Coexistence of benign diseases | |||
| Endometriosis/dermoid cyst/ | |||
| myoma/MCA/POC | 0/6/6/2/1 | 16/0/0/0/0 | 15/0/0/0/0 |
Data given as number unless otherwise indicated.
Abbreviations: A, amenorrhea; M, menstrual phase; MCA, mucinous cyst adenoma; P, proliferative phase; POC, paraovarian cyst; S, secretory phase; SCA, serous cyst adenoma.
Analysis of total CD4+ T cells and CD4+CD25+ Treg cells
FACS analysis demonstrated that the median prevalence of total CD4+T lymphocytes in the PB of control women and women with endometriosis was 20.4% and 20.1%, respectively, and this difference was not statistically significant. The similar median values in the PF of control women and women with endometriosis were 2.5% and 2.8%, respectively, without showing any significant difference between them. Similarly, when we analyzed CD25 expression in PB and PF samples, no significant difference between the endometriosis and control groups was found in terms of CD25 expression within the CD4+ T-cell population (data not shown).
Analysis of CD25+FoxP3+ Treg cells in PB and PF of women with and without endometriosis
Flow cytometry results showing identification of CD25+FoxP3+ Treg cells within the CD4+ T-cell population in the PB and PF from a woman with endometriosis are presented in Fig. 1. The cells were specifically analyzed by selective gating. The results were based on the analysis of ≥100,000 cells and are shown as the percentage of positively labeled cells.
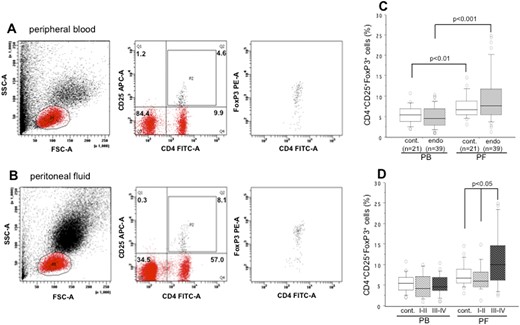
Representative flow cytometry result showing identification of CD25+FoxP3+ Treg cells within the CD4+ T-cell population in (A) Peripheral blood (PB) and (B) peritoneal fluid (PF) derived from a patient with endometriosis. Numbers represent the percentages of the dots in each gated area. (C) The prevalence in the percentages of CD25+FoxP3+ Treg cells within the CD4+ T-cell population in the PB and PF of control subjects and in women with endometriosis. (D) Their distributions in women with revised ASRM stage I-II and stage III-IV endometriosis. The boxes represent the IQRs and horizontal lines in the boxes represent median values. A significantly higher percentage of CD25+FoxP3+ cells between PF and PB was observed for women with stage III-IV endometriosis (P < 0.001). cont., control; endo, endometriosis; FSC-A, forward scatter area; P1, lymphocyte gate; P2, CD4+CD25+ cell population; SSC-A, side-scatter area.
A comparison of total CD25+FoxP3+ cells within CD4+ cells in the PB and PF of the control group and women with endometriosis is shown in Fig. 1C. Compared with PB, the percentages of CD25+FoxP3+ cells were significantly higher in the PF of control subjects (P < 0.01) and of women with endometriosis (P < 0.001). No significant difference was found in the percentage of CD25+FoxP3+ cells in either PB or PF samples between control subjects and women with endometriosis. The percentage distribution of CD25+FoxP3+ cells within CD4+ cells, based on the revised-ASRM staging of endometriosis, in the PB and PF of women is shown in Fig. 1D. Although no significant difference was observed in the percentages of CD25+FoxP3+ cells in the PB between women with stage I-II endometriosis and stage III-IV endometriosis, a significantly higher percentage of CD25+FoxP3+ cells was found in the PF of women with stage III-IV endometriosis than in women with stage I-II endometriosis (P < 0.05) or in control subjects (P < 0.05). Kruskal-Wallis test confirmed the same result among these three groups of women with significantly higher PF levels of CD25+FoxP3+ cells in women with stage III-IV endometriosis. Although a significantly higher percentage of CD25+FoxP3+ cells was observed between PF and PB samples from women with stage III-IV endometriosis (P < 0.001), this difference was not observed for women with stage I-II endometriosis (Fig. 1D). The respective median percentages (IQR) of CD25+FoxP3+ cells in the PF of control subjects, women with stage I-II endometriosis, and women stage III-IV endometriosis were 6.8% (3.2% to 14.9%), 6.0% (1.4% to 11.4%), and 10.1% (2.6% to 24.5%).
Analysis of IL-17A+Th17 cells in PB and PF of women with and without endometriosis
Flow cytometry results showing identification of IL-17A+ Th-17 cells within the CD4+ T-cell population in the PB and PF from a woman with endometriosis are presented in Fig. 2. The cells were specifically analyzed by selective gating. The results were based on analysis of ≥100,000 cells and are shown as the percentage of positively labeled cells.

Intracellular expression patterns of IL-17A in the (A) peripheral blood (PB) and (B) peritoneal fluid (PF) derived from a patient with endometriosis. In the right upper and lower panels, Q2 refers to IL-17A+ cells within CD4+ T cells. Numbers represent the percentages of the dots in each gated area. (C) The prevalence in the percentages of IL-17A+CD4+ Th17 cells within the CD4+ T-cell population in the PB and PF of control subjects and in women with endometriosis. (D) Their distributions in women with revised ASRM stage I-II and stage III-IV endometriosis. The boxes represent the IQRs and horizontal lines in the boxes represent median values. cont., control; endo, endometriosis; FSC-A, forward scatter area; P1, lymphocyte gate; SSC-A, side-scatter area.
There was no significant difference in the percentage of CD4+IL-17A+ cells in either PB or PF samples between control subjects and women with endometriosis (Fig. 2C). When we analyzed FACS results of IL-17A+ cells in the PB and PF, we did not find any difference in the percentage of CD4+IL-17A+ cells between women with stage I-II endometriosis and stage III-IV endometriosis in either of these two fluid compartments (Fig. 2D). No remarkable difference in the percentages of IL-17A+Th17 cells between PB and PF was observed in control subjects and in women with endometriosis (Fig. 2C). The respective median percentages (IQR) of IL-17A+ cells in the PF of control subjects, women with stage I-II endometriosis, and women stage III-IV endometriosis were 0.3% (0% to 0.9%), 0.3% (0.1% to 2.9%), and 0.6% (0% to 2.3%). The details of distribution in the frequencies of Treg cells and Th17 cells in the PB and PF of women with and without endometriosis are listed in Table 3.
Frequencies of Treg and Th17 Cells in the PB and PF of Women With and Without Endometriosis
| Control | Revised ASRM Stage I-II | Revised ASRM Stage III-IV | |
|---|---|---|---|
| Peripheral blood: | |||
| CD4+CD25+FoxP3+ | |||
| Treg cells | 5.5 ± 2.3 | 4.8 ± 2.9 | 5.2 ± 2.5 |
| Range in frequency | 2.2–10.9 | 1.0–10.1 | 1.2–10.5 |
| CD4+IL-17A+ | |||
| Th17 cells | 0.5 ± 0.4 | 0.5 ± 0.4 | 0.3 ± 0.3 |
| Range in frequency | 0–1.3 | 0–1.3 | 0–0.9 |
| Peritoneal fluid: | |||
| CD4+CD25+FoxP3+ | |||
| Treg cells | 7.6 ± 2.8 | 6.9 ± 3.3 | 11.4 ± 6.8a |
| Range in frequency | 3.2–14.9 | 1.4–11.4 | 2.6–24.5 |
| CD4+IL-17A+ | |||
| Th17 cells | 0.4 ± 0.3 | 0.7 ± 0.8 | 0.7 ± 0.6 |
| Range in frequency | 0–0.9 | 0.1–2.9 | 0–2.3 |
Data given as mean % ± SD.
P < 0.05, stage III-IV endometriosis vs stage I-II endometriosis and control group.
Analysis of CD25+FoxP3+Treg cells and IL-17A+Th17 cells in the PB and PF based on the phases of menstrual cycle
The distribution of CD25+FoxP3+ cells and IL-17A+Th17 cells within the CD4+ T-cell population in the PB and PF of women with and without endometriosis based on the phases of menstrual cycle is shown in Fig. 3. Although no significant difference was found in the PB levels of CD25+FoxP3+ cells in control subjects across the phases of menstrual cycle, a trend in the PF toward higher levels of CD25+FoxP3+ cells was observed in the proliferative phase than in the secretory phase (P = 0.05) without showing any difference between secretory phase and menstrual phase. A modest increase of CD25+FoxP3+ cells in the PF was found than in the PB during the proliferative phase in control subjects (Fig. 3A).

The distribution in the percentages of CD25+FoxP3+ Treg cells and IL-17A+CD4+ Th17 cells within the CD4+ T-cell population in the (A) PB and (B) PF of control subjects and (B, D) women with endometriosis, based on the phases of the menstrual cycle. The boxes represent the IQRs, and horizontal lines in the boxes represent median values. (B) When we analyzed the difference of CD25+FoxP3+ cells between PB and PF in women with endometriosis, a significant increase was observed in the proliferative phase (P < 0.05) and in the menstrual phase (P < 0.01), and there was a trend toward higher numbers of CD25+FoxP3+ cells during the secretory phase (P = 0.06). No significant differences in the percentages of IL-17A+ cells within CD4+ T cells were observed in the PB and PF between phases or among phases of the menstrual cycle in either (C) control subjects or (D) women with endometriosis. A, amenorrhea; M, menstrual phase; P, proliferative phase; S, secretory phase.
In women with endometriosis, PB did not reveal any significant difference in CD25+FoxP3+ cells among three phases of the menstrual cycle. On the other hand, a moderate increase in the PF levels of CD25+FoxP3+ cells was observed in the proliferative and the menstrual phases than in the secretory phase (Fig. 3B). When we analyzed the difference of CD25+FoxP3+ cells between PB and PF in women with endometriosis, a significant increase was observed in the proliferative phase (P < 0.05) and in the menstrual phase (P < 0.01), and there was a trend toward a greater difference during the secretory phase (P = 0.06; Fig. 3B).
Neither nonparametric analysis nor the Kruskal-Wallis test indicated a significant difference in the PB and PF levels of IL-17A+ Th17 cells between phases or among phases of the menstrual cycle in either the control group or the endometriosis group (Figs. 3C and 3D). Compared with CD25+FoxP3+ cells in PB and PF, a persistently lower percentage of IL-17A+ Th17 cells was found in control subjects and in women with endometriosis across the phases of the menstrual cycle.
Analysis of CD25+FoxP3+Treg cells and IL-17A+Th17 cells in the PB and PF based on the color of peritoneal lesions
The distribution of CD25+FoxP3+ cells and IL-17A+ Th17 cells within the CD4+ T-cell population in the PB and PF of women with stage I-II endometriosis based on the color of peritoneal lesions in the pelvis is shown in Fig. 4. The PF level of CD25+FoxP3+ cells was significantly higher in women harboring red lesions than those with black lesions (P < 0.01). The level of CD25+FoxP3+ cells in women with red lesions was statistically different between PF and PB (P < 0.05; Fig. 4A). IL-17A+Th17 cells in the PB did not differ among peritoneal lesions. In contrast, PF levels of IL-17A+ Th17 cells in women with black lesions in the pelvis were significantly higher than in women with mixed lesions (P = 0.04) and modestly higher than in red lesions (not statistically significant; Fig. 4B). Mixed lesions mean each of five women in this group had coexistence of either black and white lesions or black and red peritoneal lesions in the pelvis.
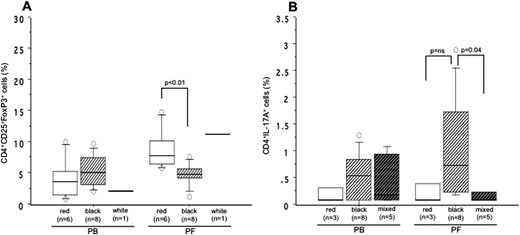
The distribution in the percentages of (A) CD25+FoxP3+ Treg cells and (B) IL-17A+CD4+ Th-17 cells within the CD4+ T-cell population in the PB and PF based on the color of peritoneal lesions in the pelvis of women with revised ASRM stage I-II endometriosis. The boxes represent the IQRs and horizontal lines in the boxes represent median values. PF levels of CD25+FoxP3+ cells were significantly higher in women with red lesions than in black lesions (P < 0.01). Women with red lesions also had a statistically significant difference in (A) the levels of CD25+FoxP3+ cells between PF and PB (P < 0.05). (B) PF levels of IL-17A+Th17 cells in women with black lesions in the pelvis were significantly higher than in mixed lesions (P = 0.04) and modestly, but not significantly, higher than in red lesions.
TGF-β and IL-17 levels in the PF
The PF concentration of TGF-β (P < 0.0001) and IL-17 (P = 0.004) was significantly higher in women with endometriosis than that in control subjects. Compared with IL-17, TGF-β levels in the PF were significantly higher (P = 0.01) in women with endometriosis (Fig. 5A). This difference between TGF-β and IL-17 was not observed in control subjects. When we distributed levels of these cytokines in the PF on the basis of the revised ASRM staging, we found a significant difference between TGF-β and IL-17 levels in women with only stage III-IV endometriosis (P = 0.04; Fig. 5B). Compared with the control group, women with stage I-II endometriosis and stage III-IV endometriosis had significantly higher PF concentrations of TGF-β (P < 0.0001 for each) and IL-17 (P = 0.005 and **P = 0.001, respectively; Fig. 5B). When we distributed TGF-β and IL-17 levels on the basis of the phases of the menstrual cycle, we found a significant increase in the PF levels of TGF-β compared with IL-17 levels (P = 0.04) during the secretory phase in women with endometriosis (Fig. 5C). Compared with the proliferative phase, PF levels of TGF-β and IL-17 were significantly higher during the secretory phase (P = 0.02 and P = 0.01, respectively) and during the menstrual phase (P = 0.01 and P = 0.009, respectively; (Fig. 5C). Results of the Kruskal-Wallis test indicated a similar pattern of higher concentrations of TGF-β and IL-17 in the PF from the secretory phase to the menstrual phase in women with endometriosis. Neither nonparametric analysis nor the Kruskal-Wallis test found a significant difference in the PF levels of TGF-β and IL-17 in control subjects across the phases of the menstrual cycle (Fig. 5C).
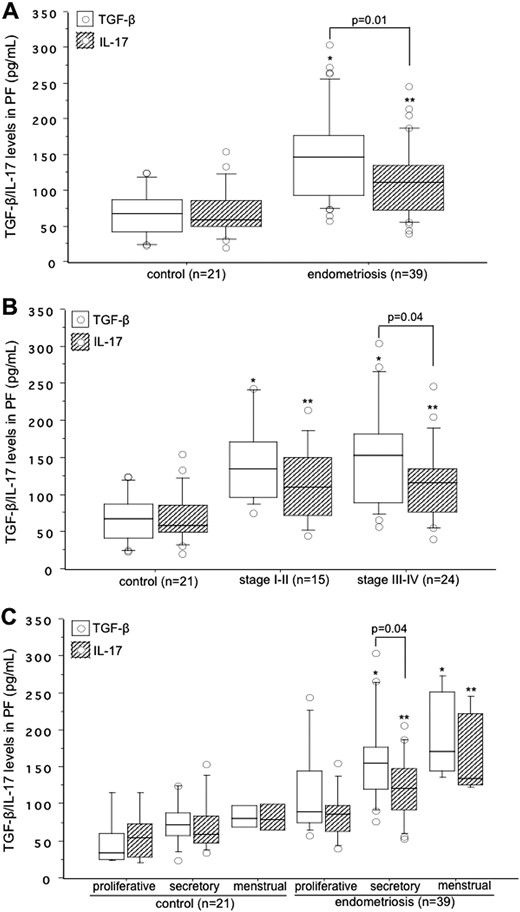
Concentrations of TGF-β (white box) and IL-17 (hatched box) in the (A) PF collected from control subjects and women with endometriosis, (B) their distribution based on the revised ASRM staging of endometriosis, and (C) based on the phases of the menstrual cycle. The boxes represent the IQRs and horizontal lines in the boxes represent median values. (A) PF concentrations of both TGF-β and IL-17 were significantly higher in women with endometriosis than in control subjects. *P < 0.0001; **P = 0.004. (B) Women with stage I-II endometriosis: *P < 0.0001 vs control for TGF-β; **P = 0.005 vs control for IL-17. Women with stage III-IV endometriosis: *P < 0.0001 vs control for TGF-β; **P = 0.001 vs control for IL-17. (C) PF levels of TGF-β in women with endometriosis: *P = 0.02 between secretory phase and proliferative phase: *P = 0.01 between menstrual phase and proliferative phase; PF levels of IL-17 in women with endometriosis: **P = 0.01 between secretory phase and proliferative phase: **P = 0.009 between menstrual phase and proliferative phase.
Comparison of CD25+FoxP3- effector T cells and CD25+FoxP3+ Treg cells in PB and PF
We compared the pattern of CD25+FoxP3− effector T (Teff) cells (also known as Tr1 cells) and CD25+FoxP3+ Treg cells within the CD4+ T-cell population in the PB and PF samples from the control group and women with endometriosis (Fig. 6). In the PB, although there were no difference between Teff cells and Treg cells in the control group, the percentage of Teff cells was significantly higher than that of Treg cells (P = 0.01) in women with endometriosis (Fig. 6A). This difference between Teff cells and Treg cells was lost in the PF of the control group and women with endometriosis (Fig. 6B).
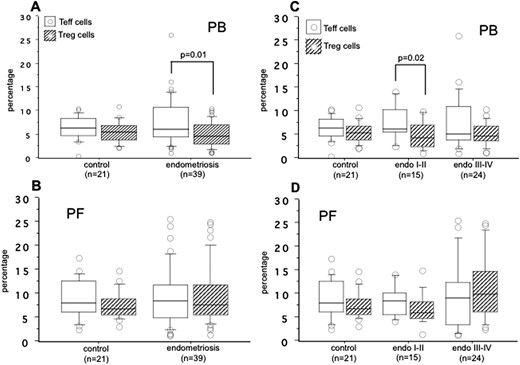
The percentages of CD25+FoxP3− Teff cells (white box) and CD25+FoxP3+ Treg cells (hatched box) within the CD4+ T-cell population in the (A) PB and (B) PF of control subjects and women with endometriosis and based on the revised ASRM (C) stage I-II and (D) stage III-IV endometriosis. The boxes represent the IQRs and horizontal lines in the boxes represent median values.
When we compared the results of Teff cells and Treg cells on the basis of the revised ASRM staging of endometriosis, we found a significant increase in the percentage of Teff cells relative to Treg cells (P = 0.02) in the PB of women with only stage I-II endometriosis (Fig. 6C). No significant difference between Teff cells and Treg cells was observed in the PF of the control group, women with stage I-II endometriosis, and women with stage III-IV endometriosis (Fig. 6D). The details of distribution in the percentages of Teff cells and Treg cells in the PB and PF of control subjects and of women with endometriosis are listed in Table 4.
Frequencies of Teff and Treg Cells in the PB and PF of Women With and Without Endometriosis
| CD4+CD25+FoxP3- | CD4+CD25+FoxP3+ | |||
|---|---|---|---|---|
| No. | Teff Cells (%) | Treg Cells (%) | Teff-to-Treg Ratio | |
| PB | ||||
| Control | 21 | 6.4 ± 2.5 | 5.5 ± 2.3 | 1.39 ± 0.86 |
| Endometriosis | 39 | 7.7 ± 5.0 | 5.1 ± 2.6a | 1.90 ± 1.49 |
| Revised ASRM stage I-II | 15 | 7.8 ± 3.7 | 4.8 ± 2.9b | 2.23 ± 1.91 |
| Revised ASRM stage III-IV | 24 | 7.7 ± 5.7 | 5.2 ± 2.5 | 1.69 ± 1.16 |
| PF | ||||
| Control | 21 | 9.1 ± 4.2 | 7.6 ± 2.8 | 1.30 ± 0.69 |
| Endometriosis | 39 | 9.3 ± 6.1 | 9.7 ± 6.1 | 1.35 ± 1.32 |
| Revised ASRM stage I-II | 15 | 8.5 ± 3.3 | 6.9 ± 3.3 | 1.50 ± 0.77 |
| Revised ASRM stage III-IV | 24 | 9.9 ± 7.3 | 11.4 ± 6.8 | 1.25 ± 1.62 |
Data given as mean ± SD.
P < 0.01, Teff cells vs Treg cells in women with endometriosis
P = 0.02 Teff cells vs Treg cells in women with revised ASRM stage I-II endometriosis.
Discussion
We demonstrated here the differential concentrations of CD25+FoxP3+ cells and IL-17A+Th17 cells within the CD4+ T-cell population in the PB and PF of control subjects, women with early endometriosis (stage I-II), and women with advanced (stage III-IV) endometriosis. We found that PF of control subjects and women with endometriosis harbors predominantly higher CD25+FoxP3+ cells than in PB and the percentages of CD25+FoxP3+ cells in PF were significantly higher in women with stage III-IV endometriosis than in stage I-II endometriosis or in control subjects. The differential pattern of PB and PF concentration of Treg cells in control subjects and women with endometriosis may reflect their active translocation from the PB to the peritoneal cavity. As a component of effector immune cells, PB and PF samples collected from these three group retained one-fifth to one-tenth of the concentration of IL-17A+ Th17 cells, compared with CD25+FoxP3+ cells. There was no difference in the distribution of IL-17A+ Th17 cells either in PB or in PF between control subjects and women with endometriosis or between early and advanced endometriosis.
Although we did not measure Treg and Th17 cells in the same biological samples, the persistently low levels of proinflammatory IL-17A+ Th17 cells in PB and PF across the phases of menstrual cycle may be due to the antagonistic effect of CD25+FoxP3+ cells on Th17 cells (19, 32) or plasticity properties of Th17 cells with a rapid shifting toward the Th1 lineage (33). This may additionally confirm a peculiar feature of human Th17 cells: They are very rare in inflammatory sites, compared with Th1 cells (34). These features suggest the Th17/Treg balance plays a major role in the development of human autoimmune and inflammatory diseases, including endometriosis. In this study, this balance was disturbed and may have promoted the initiation, maintenance, and progression of endometriosis.
There are diverse opinions regarding the interaction between Treg cells and effector immune cells. Recent reports have revealed that the suppressive activities of Treg cells on effector immune cells are related to both cell contact–dependent and cell contact–independent mechanisms of suppression (35, 36). We postulate that greater numbers of Treg cells in the PF of women with advanced endometriosis, as we observed in this study, may be responsible for the suppression of effector immune cells, resulting in the maintenance and progression of higher grades of endometriosis. This was consistent with the persistently lower prevalence of Th17 cells in the PF of both early and advanced endometriosis. We found a significantly lower distribution of Treg cells in the PF of women with stage I-II endometriosis and control subjects, compared with women with stage III-IV endometriosis. This might be due to the differential levels of regulated upon activation, normal T-cell expressed and secreted (RANTES) and monocyte chemotactic protein-1 (MCP-1) in the PF in these groups of women that act as potent chemoattractants for Treg cells (37, 38). Therefore, it is tempting to speculate that accumulation of Treg cells in the peritoneal cavity of women with advanced endometriosis is a secondary phenomenon related to their chemotaxis due to persistence of local inflammatory reaction. Our findings agree with those of Olkowska-Truchanowicz et al. (28), who studied Treg-cell profiles in the PB and PF of women with only advanced endometriosis.
To our knowledge, simultaneous analysis of Treg and Th17 cells in the PB and PF of women with early and advanced endometriosis has not been studied before. The prevalence of Treg cells in the eutopic and ectopic endometrial tissues has been studied (26, 39). More recently, we demonstrated that women with ovarian endometrioma and dermoid cyst harboring peritoneal lesions have more FOXP3+ Treg cells than do women without coexisting peritoneal lesions (40).
In this study, we did not find any difference in Treg cells in the PF between women with stage I-II endometriosis and control subjects. How should we explain the initial survival and attachment of endometrial cells in women with early endometriosis? This may be explained by one of the following two mechanisms (1): (1) Even PF levels of Treg cells in this group were significantly lower than in women with advanced endometriosis and the percentage of Th17 cells in PF was still lower by more than one-fifth that of Treg cells in women with early endometriosis; and (2) insufficient local induction and activity of Treg cells in women with early endometriosis may negatively switch the activity of other effector immune cells such as macrophages, neutrophils and natural killer cells. This can be further supported by the insignificant difference in prevalence between PF levels of CD25+FoxP3- Teff cells and CD25+FoxP3+ Treg cells in women with early endometriosis and women with advanced endometriosis (Fig. 6).
The higher percentages of CD25+FoxP3- Teff cells in the PB of women with stage I-II endometriosis may indicate that the function of effector immune cells may start in the systemic environment, but this effect is lost in the local environment. On the basis of these findings, we may speculate that an immune defect with less clearance capacity of Th17 cells or other immune cells in the pelvis during retrograde flow of menstruation may facilitate initial survival and implantation of endometrial cells with subsequent maintenance and progression to advanced endometriosis. Several published reports have already demonstrated that increased tissue inflammatory reaction and increased concentrations of PF cytokines are associated with the severity of endometriosis (41, 42). The current study further confirmed that changes in the concentration of peritoneal Treg cells depend on the progressive grading of the disease such as to stage III-IV endometriosis.
When we distributed CD25+FoxP3+ cells and IL-17A+ Th17 cells in the PB and PF on the basis of the phases of the menstrual cycle, we found a trend toward greater accumulation of Treg cells in the proliferative and menstrual phases than in the secretory phase. However, a prevalence difference between PB and PF indicated a significantly higher percentage of Treg cells in the PF in any phase of the menstrual cycle than in PB of women with endometriosis. There was no apparent difference in the distribution of Treg cells in the PB and Th17 cells in the PB/PF of women with and without endometriosis. These findings agree with the report of Prieto et al. (43), who demonstrated that patterns of FOXP3+ Treg cells in the endometria were independent of the phases of the menstrual cycle. However, a differential increased pattern of FOXP3+ Treg-cell accumulation in the endometria was observed during the proliferative phase (29) or during the secretory phase (26) of the menstrual cycle. The findings of the current study together with the results of Berbic et al. (26) may suggest that in women with more CD25+FoxP3+ Treg cells and fewer Th17 cells in the PF, the ability of the newly recruited effector immune cells to effectively recognize endometrial antigens may be reduced, thereby allowing their survival and consequent implantation in the pelvis.
These findings further indicated that Treg cells may be influenced by the hormonal changes in the course of the menstrual cycle. Mjösberg et al. (44), reported that function and frequency of Treg cells may be regulated by progesterone and 17β-estradiol. Therefore, it is possible that the differences in the frequency of Treg cells between women with endometriosis and control subjects reflect specific endometriosis-associated abrogation of local rather than systemic immune system activity. It is known that changes in hormonal levels in women with same pathology, but different age range, particularly in older age groups (>40 years), may influence T-cell activation and action (45, 46). We did not find any significant difference in the percentage of CD4+ T cells among the three groups in this study (data not shown). In fact, the primary focus of our study was the analysis of T cells based on staging of endometriosis and phases of menstrual cycle rather than determination of T-cell activation on the basis of patients’ age. In addition, the median ages of our three groups of patients was 30 years; thus, we could avoid the bias of age in our results.
We were curious to know the distribution of Treg and Th17 cells in different peritoneal lesions of women with stage I-II endometriosis in the pelvis. We could not collect peritoneal lesions from women with stage III-IV endometriosis, because it was difficult to recognize their color, due to coexistent adhesion. Although the number of dominant lesions in each group was small, there was a significant accumulation of Treg cells in the PF containing red lesions compared with black lesions. This can be explained by an increased tissue inflammatory reaction in the pelvis of women harboring active peritoneal lesions, and this inflammatory process may time-dependently decline with the progression of active red lesions to old black lesions. The percentage of Th17 cells in PF was remarkably higher in women with black lesions, compared with those with red and mixed lesions; however, their prevalence was still lower than that of Treg cells. Different macromolecules in the pelvis with variable inflammatory conditions may differentially trigger Treg and Th17 cells in women with different types of peritoneal lesions.
The balance of Th17/Treg cells—two cellular components of immune system—has been reported to be regulated by IL-6/IL-17 and TGF-β/IL-10 in the systemic or local pelvic environment (20, 32). The competition between the levels of IL-17 and TGF-β plays a key role in the priming of Th17 cells, one of the Teff cells or Treg cells in the pelvic environment. When TGF-β levels in sera or PF are higher than IL-17 levels, an increase in the number or activity of Treg cells induces strong suppression of Th17 cells, resulting in a state of immune-tolerance and in less clearance of attached cells to the peritoneum, with consequent survival of cells and development of lesions in the pelvis. With this concept in mind, we measured TGF-β and IL-17 levels in the PF of women with and without endometriosis.
PF levels of TGF-β and IL-17 were significantly higher in women with endometriosis than in control subjects. This pattern was also observed in women with early and advanced endometriosis. Interestingly, as a marker of effector immune cells, PF levels of IL-17 were significantly decreased compared with TGF-β in women with advanced endometriosis and modestly decreased in women with early-stage endometriosis. Menstrual phase–dependent increased concentrations of TGF-β and IL-17 were found in the PF of women with endometriosis, but this pattern was not observed in control subjects. There were significantly higher PF levels of TGF-β than IL-17 in women with stage III-IV endometriosis, and during the secretory phase, coincided with current findings of increased prevalence of Treg cells in women with advanced endometriosis. Increased amounts of TGF-β and IL-17 have been reported in the PF of women with endometriosis (22, 47). These results indicate that an altered cytokine environment in the pelvis and consequent abundant generation of Treg cells might be involved in the immune escape of destructive immune cells (Th1/Th17 cells), thereby resulting in the development of peritoneal lesions and consequent progression to advanced stage of the disease. As a type of effector immune cell, decreased natural killer cell activity within the peritoneal cavity of women with endometriosis has been attributed to increasing concentrations of TGF-β (48).
It is important to mention that in addition to active translocation to the peritoneal cavity, increased numbers of Treg cells may be a result of their local induction in response to some cytokines such as TGF-β and IL-10 (49, 50). The current study adds evidence that higher concentrations of TGF-β in the PF may activate and proliferate Treg cells in women with advanced endometriosis. An insufficient induction of Treg cells in response to TGF-β in PF may occur in women with early endometriosis. Tone et al. (51), demonstrated that TGF-β is necessary for the differentiation and maturation of Treg cells via the Smad3 pathway. In addition, even in lower concentrations in the pelvis, IL-17 may contribute to the pathogenesis and progression of endometriosis by triggering proliferation, proinflammatory cytokines, and angiogenic growth factors (8, 23). Although the origin and function of Treg cells in humans are still unclear, we can at least speculate that they may represent Treg cells in the course of their induction from naïve T cells (52).
We do not know whether increased PF levels of TGF-β and Treg cells precede or follow the development of endometriosis. A retrograde menstruation, endometrial cells in the pelvis, induction of variable degree of inflammation, and, most importantly, a competition between Treg cells and effector immune cells such as Th17 cells in the peritoneal environment may decide the occurrence, maintenance, and progression of endometriosis. Based on our current findings, differential PF concentrations of Treg cells and Th17 cells could promote an anti-inflammatory environment by suppressing a possible immune response against lesion establishment and permitting ectopic endometrial implantation and propagation. Involvement of subsequent angiogenesis and local estrogen production, in turn, facilitates the lesion growth and survival once endometrial cells are implanted.
The are some limitations in this study (1). We collected PB and PF samples from two separate populations of control subjects, women with early endometriosis, and women with advanced endometriosis for the analysis of Treg cells and Th17 cells. Additional investigation is needed to compare Treg cells and Th17 cells in the biological samples of the same patients. We do agree with the possibility that the T-cell pattern of change could be the same in the same patient (i.e., PB and PF from the same women) and/or in the same patient at different times. We also believe that it is very difficult to get IRB approval to collect many samples from the same patient or multiple samples from the same patient at different times (2). We did not investigate the association between Treg cells and prevalence of autoantibodies in women with endometriosis, as described previously (53). It is plausible that some endometriosis-associated autoimmune phenomena are related, at least partially, to an abrogated function of systemic or local CD4+CD25+FoxP3+ Treg cells. Additional study may precisely clarify this issue.
In conclusion, we demonstrated differential concentrations of Treg cells and Th17 cells in the PB and PF of women with early and advanced endometriosis. Advanced endometriosis may be associated with disturbed compartmentalization of CD25+FoxP3+ Treg cells within the CD4+ T-cell population, but this abrogated immune response was not observed in women with early endometriosis. A persistently lower concentration of CD4+Th-17A+ cells in the peritoneal environment compared with Treg cells may disturb the balance between proinflammatory and anti-inflammatory conditions in the pelvis and trigger initiation of early endometriosis with time-dependent transition to advanced endometriosis. Our findings reconfirmed the current speculation that endometriosis is related to Treg- and Th17-cell alteration causing survival and implantation of ectopic endometrial lesions in the early stage of endometriosis, with consequent progression toward the advanced stage of endometriosis. Manipulation of Treg cells to suppress and/or of Th17 cells to increase in the peritoneal environment may be the potential target in the treatment of endometriosis. Additional studies may address these issues.
Acknowledgments
We thank Kyoko Ishida, Nagasaki University Graduate School of Biomedical Sciences, for her excellent technical assistance. We thank all the doctors of Saiseikai Nagasaki Hospital and Kyoto Prefectural University of Medicine for their kind assistance in collecting biopsy samples and sample preparation for this study.
Financial Support: This work was supported by Grants-in-aid for Scientific Research (grant nos. 24592474 and 15K10675 to K.N.K.) from the Japan Society for the Promotion of Science (JSPS).
Disclosure Summary: The authors have nothing to disclose.
Abbreviations:
- ASRM
American Society of Reproductive Medicine
- FACS
fluorescence-activated cell sorting
- FoxP3
forkhead box protein P3
- IQR
interquartile range
- PB
peripheral blood
- PF
peritoneal fluid
- RT
room temperature
- Teff
T effector
- Th17
T-helper-17
- Treg
T regulatory
