


Abstract
Seaweed and macroalgae have been utilised for centuries in human and animal nutrition due to their rich composition and functional properties. As global demand for sustainable food sources grows, the seaweed industry requires effective quality control systems to ensure product safety and consistency. Vibrational spectroscopy, including near-infrared (NIR), mid-infrared (MIR), and Raman spectroscopy, offers powerful techniques for analysing the molecular composition of seaweed. These methods enable the identification and characterisation of key molecular structures, essential for ensuring the quality of seaweed-based products. The integration of machine learning (ML) and chemometric techniques enhances the analytical capabilities of vibrational spectroscopy, providing robust tools for data interpretation and decision-making in seaweed safety and sustainability. This review highlights recent advancements in the application of vibrational spectroscopy, ML, and sustainable practices within the seaweed industry, emphasising their role in improving product quality, traceability, safety, and resource efficiency. Furthermore, the ability of IR spectroscopy to predict seaweed chemical composition and biomass production under different abiotic conditions is discussed. Developing and implementing vibrational spectroscopy tools will enable agile methods that will support management and risk evaluation systems, providing with objective measurements to identify hazards during seaweed post-harvest and processing.
Introduction
The use of algae and seaweed as food ingredients has a long history, with records dating back to the fourth century in Japan and the sixth century in China (Mohamed et al., 2012; Lefranc-Millot, 2014; Rindi et al., 2020). In Europe, seaweed gained attention as early as 1750, when an English physician successfully treated goitre using kelp ash (Mohamed et al., 2012; Kılınç et al., 2013).
Global consumption of vegetable proteins has risen by 15% since the 1960s, driven by consumer demand for sustainable alternatives to meat and animal-derived proteins (Amlanı & Yetgin, 2022; Maehre et al., 2014; Zhang et al., 2022). This shift has increased access to bioavailable compounds from various plant sources, including seaweed as ingredient or food product (Amlanı & Yetgin, 2022; Holdt & Kraan, 2011). In recent years, the food industry has shown great interest in plant protein concentrates to meet the growing demand for protein ingredients as substitute of animal proteins, particularly in developing countries (Maehre et al., 2014; Pal et al., 2014; Zhang et al., 2022). Although plant-derived proteins typically have lower nutritional value compared to animal-based proteins, they are still widely used and included in flours, as protein concentrates, or isolates, with some concentrates containing up to 80% plant or seaweed protein (Amlanı & Yetgin, 2022; Lefranc-Millot, 2014).
Seaweeds have long been valued as ingredients in both human and animal nutrition due to their high mineral content and functional properties, with the protein profile of some macroalgae being comparable to that of eggs (Černá, 2011; Holdt and Kraan, 2011; Maehre et al., 2014; Pal et al., 2014; Zhang et al., 2022). Seaweeds, or macroalgae, are complex multicellular organisms that utilise photosynthesis but are distinct from terrestrial plants, thriving in saltwater and marine environments (Amlanı & Yetgin, 2022; Van der Spiegel et al., 2013). They are broadly classified into three groups based on their pigmentation such as red algae (Rhodophyta), brown algae (Heterokontophyta or Ochrophyta, class Phaeophyceae), and green algae (Chlorophyta) (Finkel et al., 2016; Rindi et al., 2020).
Over 250 species of seaweed are utilised globally, with approximately 150 species consumed directly by humans (Zhang et al., 2022). The most used seaweeds include Phaeophyceae, Rhodophyceae, and Chlorophyceae (Chapman, 2012; El-Gamal et al., 2015). These species exhibit a variety of shapes, sizes, colours, and chemical compositions and are adapted to thrive in diverse marine environments (Chapman, 2012; El-Gamal et al., 2015; Makkar et al., 2016).
Research in the biochemical, phytochemical characteristics and properties, as well as the nutritional value of seaweed has been widely evaluated and reported by different researchers in the field (Olsson et al., 2020; Peng et al., 2015). Proteins, minerals, vitamins, dietary fibre, and lipids as well as a wide range of secondary metabolites including monoterpenes, sesquiterpenes, diterpenes, meroterpenoids, and steroids have been found by several authors in different seaweed species (Peng et al., 2015; Salehi et al., 2019). These functional bioactive compounds and phytochemicals not only are considered as ingredients in food products for humans but also can provide with a wide range of bioactive compounds to be utilised by the pharmaceutical industry (Olsson et al., 2020; Peng et al., 2015).
The determination of the proximate composition (e.g., protein, fat, and fibre content), or concentration of bioactive compounds, in addition to the functional, nutritional, and health properties of seaweeds has been achieved by the utilisation of a wide range of analytical methods and techniques (Cozzolino, 2022; Pandiselvam et al., 2024). The current analytical advances in most of the instrumental methods and techniques available in the field of food analytics, including the utilisation of chromatography (e.g., gas chromatography [GC]), high-performance liquid chromatography (HPLC), mass spectrometry (MS), electrophoresis, and liquid chromatography (LC) are allowing to measure and target the different compounds present in seaweed (Cozzolino, 2022; Pandiselvam et al., 2024). These techniques provide with a range of analytical possibilities that allows to qualitatively or quantitatively identify the content of these compounds. However, the measurement of a single compound or metabolite in a food ingredient or product such as seaweed, provides limited information about other characteristics such as its authenticity, provenance or even safety of the seaweed. Therefore, fingerprint approaches are required to target authenticity, fraud, or provenance (Cozzolino, 2022; Pandiselvam et al., 2024). Overall, traditional analytical methods are recognised to be time-consuming, require sample pre-processing steps, and costly to be implemented and utilised in the field (e.g., seaweed farmers or producers), or by the seaweed industry (Cozzolino, 2022; Pandiselvam et al., 2024). On the other hand, developments in instrumentation and equipment based on the utilisation of vibrational spectroscopy such as near infrared (NIR) and mid infrared (MIR) spectroscopy, Raman spectroscopy (RS), and hyperspectral techniques have made possible the incorporation of these techniques by the food manufacturing industry (Pandiselvam et al., 2024).
Background in infrared and data analytics
Vibrational spectroscopy includes a range of techniques such as infrared (IR), including NIR and MIR, and RS (Bec et al., 2020, 2022). These techniques enable the measurement of molecular structures and the identification of specific molecular species in a sample (Bec et al., 2020, 2022). By capturing the vibrational states of molecules, they provide insight into the chemical, functional, and physical properties of samples (Bec et al., 2020, 2022). Recent advances in MIR instrumentation have allowed integration with Fourier Transform (FT), granted much improved optical throughput (e.g., enabling, by correspondence, faster scanning) making it possible to analyse molecules in various states (e.g., solutions, powders, or food products) (Karoui et al., 2010). The addition of attenuated total reflectance (ATR) modules to FT instruments has further improved their analytical capabilities. ATR allows for the efficient analysis of complex matrices, such as foods, with minimal or no sample preparation, and is applicable to a variety of food forms, including liquids, gels, solids, and powders (Karoui et al., 2010).
NIR spectroscopy is the most utilised technique in food analysis (Bec et al., 2020, 2022). It measures the absorption of energy by chemical bonds in functional groups such as C–H, O–H, N–H, and C=O, which relate to the chemical composition and structure of food products (Bec et al., 2020, 2022). NIR spectroscopy is highly versatile, allowing for the analysis of various sample types, including those with high moisture content, powders, whole fruits and grains, and even individual kernels (e.g., seeds, single grain) or plant parts. This technique can be applied at multiple production stages, from on-farm use during harvest to in-line applications during transport and storage, to distribution to the consumer (e.g., at the supermarket or retail) (Bec et al., 2020, 2022).
In addition to infrared techniques, RS has become valuable in food analysis. It detects molecular vibrations based on changes in the electrical polarizability of molecules (Jones et al., 2019; Thygesen et al., 2003). This makes RS particularly sensitive to bonds between identical or nearly identical atoms (e.g., C–C), while weaker polarizable bonds (e.g., O–H) are less active (Jones et al., 2019; Thygesen et al., 2003). The technique is well-suited to analysing functional groups with high polarizability, such as C=Cl, C=C, and C=N, compared to the stronger absorbance bands seen in infrared spectroscopy for groups like O–H and C=O (Jones et al., 2019; Thygesen et al., 2003). One major advantage of RS is its ability to analyse water-based foods, where water does not interfere with the spectrum as it does in infrared techniques (Jones et al., 2019; Thygesen et al., 2003). However, fluorescence from some chemical compounds present in the samples (e.g., phenolics) and other instrumental challenges may limit its wide application by the seaweed industry. Recent advancements in portable Raman instruments have reduced some of these issues, increasing its feasibility/viability as a complementary technique to NIR and MIR spectroscopy (Jones et al., 2019; Thygesen et al., 2003).
Both NIR and MIR spectroscopy provide point-based spectral information, meaning no spatial data can be captured during analysis (Amodio et al., 2020; Manley, 2014; Sendin et al., 2018). However, recent advances in hyperspectral imaging now allow for the simultaneous collection of spatial and molecular information from a sample. Hyperspectral imaging combines the key features of point-based spectral analysis with spatial data, creating a system that can be used for both food quality assessment and safety inspection (Amodio et al., 2020; Manley, 2014; Sendin et al., 2018). This technique can operate across multiple wavelengths regions, including the visible (VIS—400–750 nm) and NIR (750–2,500 nm) ranges, or in combination with other techniques such as RS (Amodio et al., 2020; Manley, 2014; Sendin et al., 2018). Despite its promise as a novel platform technology in food safety and quality, there are several barriers to its widespread adoption, including the high cost of the current commercial systems, the limited number of suppliers, and the time required for image acquisition and interpretation (Amodio et al., 2020; Manley, 2014; Sendin et al., 2018). Additionally, the sample preparation and data analysis processes are time-consuming, which poses a further obstacle for industry use or adoption. However, advancements in electronic components, camera technologies, hardware, and more efficient algorithms are expected to reduce acquisition and processing times, making hyperspectral imaging more practical for addressing food safety and quality concerns (Amodio et al., 2020; Manley, 2014; Sendin et al., 2018).
The Terahertz (THz) region lies between the IR and microwave regions of the electromagnetic spectrum (Afsah-Hejri et al., 2019). Although the use of THz spectroscopy in food analysis is still in its early stages, it offers a unique ability to characterise far-IR vibrational modes in food samples. THz spectroscopy is especially useful for measuring water content in various food matrices due to its sensitivity to hydrogen bond vibrations (Afsah-Hejri et al., 2019). However, this sensitivity to water also presents a limitation, as the technique struggles to analyse other compounds in foods with high moisture content (Afsah-Hejri et al., 2019).
Vibrational spectroscopy and the need for machine learning tools
The successful application of vibrational spectroscopy in food safety and quality control relies heavily on data analytics, particularly from those from the field of chemometrics and machine learning (ML) (Agelet and Hurburgh, 2010; Bureau et al., 2019; Saeys et al., 2019). For example, ML techniques can be used to classify or identify the authenticity of a given food or sample by analysing the information embedded in the spectra (e.g., wavelengths, frequencies). In this way, seaweed samples can be classified or identified using categories corresponding to the authentic sample or by creating regression models based on continuous data (Agelet and Hurburgh, 2010; Bureau et al., 2019; Saeys et al., 2019). Once a model is developed or trained, these models can be utilised to predict clusters, patterns, or the concentration of a component from the new data. The accuracy of these models depends on the quality of the input variables utilised, such as wavelength range, the signal-to-noise ratio, or the sample presentation method used during the analysis (Agelet and Hurburgh, 2010; Bureau et al., 2019; Saeys et al., 2019).
In qualitative data analysis, two main approaches can be used and defined as targeted or untargeted analysis (Allwood et al., 2021; López et al., 2014; Schrimpe-Rutledge et al., 2016). Targeted analysis focuses on detecting specific characteristics, properties, or known ingredients or even adulterants within a sample. In contrast, untargeted analysis examines and interprets signals generated by different instrumental techniques without prior knowledge of the specific target such as chemical compounds or metabolites (Allwood et al., 2021; López et al., 2014; Schrimpe-Rutledge et al., 2016). Both targeted and untargeted approaches are used in qualitative analysis of foods, depending on the objective of the study (Allwood et al., 2021; López et al., 2014; Schrimpe-Rutledge et al., 2016).
Various algorithms are available for different types of analysis (qualitative or quantitative analysis), many of which have been successfully applied and reported in the literature (Szymańska et al., 2015). Common examples include discriminant analysis (DA), principal component analysis (PCA), partial least squares (PLSs) regression, support vector machines (SVM) for classification and regression, artificial neural networks (ANNs), K-nearest neighbours (KNNs), and convolutional neural networks (Szymańska et al., 2015). In quantitative analysis, PLS regression has been the most used algorithm. More recently, other algorithms have been also explored including the utilisation of SVM and ANN (Agelet and Hurburgh, 2010; Bureau et al., 2019; Saeys et al., 2019). On the other hand, DA and hierarchical cluster analysis (HCA) techniques have been extensively used in qualitative analysis.
Recent advancements in food analytics, specifically in the field of food fingerprinting using instrumental methods, have introduced the use of data fusion methods, which have shown promising results by integrating data from multiple platforms or instruments (Beć et al., 2021; Borras et al., 2015). While data fusion may appear straightforward, it presents significant challenges in the field of data analytics, particularly in food-related chemometrics applications (Beć et al., 2021; Borras et al., 2015).
In addition to the algorithm selected, sampling strategy and issues associated with sampling such as number and selection of the samples are important to define the appropriate data set used to develop the calibration model. Another important issue is the validation method to be used during the development of the calibration model and during the test of the resulting model that will be implemented. Both sampling and validation method are issues that have not been considered extensively during the application of vibrational spectroscopy methods to analyse the chemical composition of seaweed (Agelet and Hurburgh, 2010; Bureau et al., 2019; Saeys et al., 2019).
Applications of vibrational spectroscopy in seaweed analysis
Proximate composition
NIR spectroscopy has been successfully used to predict the proximate composition, including protein and fat content, in Sargassum fusiforme (Huang et al., 2024). Calibration models between the NIR spectra and reference data (proximate analysis) were developed using PLS regression. The study also evaluated various wavelength selection algorithms, such as competitive adaptive reweighted sampling (CARS), genetic algorithms (GAs), backward interval, and synergy interval (Huang et al., 2024). The best results obtained in this study were achieved with CARS-PLS, yielding a root mean square error of prediction (RMSEP) value of 0.1075% for crude protein (CP), 0.1807% for fat, and 0.3315% for ash, with corresponding R2 values of 0.9936, 0.7706, and 0.9937, respectively (Huang et al., 2024).
Niemi et al. (2023) compared the Lowry and the bicinchoninic acid (BCA) protein assays with protein determination by nitrogen ratios using FT mid-infrared spectroscopy. Diffuse reflectance infrared Fourier transform spectroscopy (DRIFTS) was utilised to collect the IR spectra from each of the samples. Linear regression was used to analyse either peak height or area under the curve for Amide II groups associated with proteins. Calibration models between the spectra and reference data were developed using PLS regression.
Cao et al. (2022) assessed the use of NIR spectroscopy to predict the quality grading of Sargassum fusiforme harvested at different time points during harvesting. These authors applied several ML techniques, including SVM, KNN, back propagation neural networks, and PLS discriminant analysis (PLS-DA). Wavelength selection tools such as SI, GA, and CARS were also explored during calibration development. The best models for discriminating harvest times were achieved using SVM, with 100% accuracy in classification. The combination of CARS and PLS regression were used to predict the concentration of polyphenols and yielded the best results, with an RMSEP of 3.23 g/kg and coefficient of determination (R2) of 0.99 (Cao et al., 2022). In a separate study, VIS–NIR spectroscopy was used to predict CP concentration in Gracilaria sp. (Shalev et al., 2022). In this study, ANN models provided accurate results (R2 = 0.95; RMSEP = 0.84) and were externally validated delivering strong validation statistics (R2 = 0.99; RMSEP = 0.45) (Shalev et al., 2022).
NIR spectroscopy has been shown good ability to predict dry matter (DM), mineral fractions, nitrogen, and carbon content in both wet, untreated, and dried green algae of the genus Ulva (Palou et al., 2023). In this study, PLS calibration models (n = 80) were developed to predict DM, carbon (n = 40), nitrogen (n = 40), and mineral fractions on both a wet and dry weight basis (Palou et al., 2023). The PLS models for wet samples demonstrated good accuracy (R2 > 0.9) for predicting nitrogen and carbon. However, the prediction of DM and mineral fractions showed moderate accuracy, with R2 values ranging from 0.506 to 0.693 (Palou et al., 2023). The authors concluded that these models could be effectively used to predict carbon and nitrogen directly from wet, untreated samples (Palou et al., 2023).
In a comparative study, both NIR and MIR spectroscopy were evaluated to measure the chemical and nutritional value as well as the in vitro DM rumen digestibility of brown seaweeds (Campbell et al., 2022). PLS calibration statistics indicated strong predictive performance for the prediction of CP (R2P = 0.99; RMSEP = 0.51; RER = 26.9; RPD = 6.9) and total polyphenolic content (R2P = 0.94; RMSEP = 0.20; RER = 10; RPD = 3.2) using NIR spectroscopy (Campbell et al., 2022). MIR spectroscopy provided accurate predictions for CP (R2P = 0.96; RMSEP = 1.12; RER = 11.64; RPD = 3.14) but was less effective for predicting other chemical compositional parameters (Campbell et al., 2022). Models for ash, neutral, and acid detergent fibre, lignin and in vitro DM rumen digestibility showed limited applicability for quantitative measurements (R2P < 0.85; RPD < 2) (Campbell et al., 2022).
Hyperspectral imaging in the shortwave NIR range (750–1,100 nm), combined with ANN, was utilised to predict CP, lipids, and fibre content in edible macro- and microalgae species from different regions. The resulting R2 values were 0.9952 for the prediction of CP, R2 of 0.9767 for the prediction of lipids, and R2 of 0.9828 for the prediction of fibre content, demonstrating high predictive accuracy of the HIS method (Amoriello et al., 2024).
NIR spectroscopy was evaluated as a quality control method for Sargassum fusiforme and utilised to predict the antioxidant capacity as well as to classify samples from different growth stages (Yang et al., 2024). The study utilised PLS-DA and particle swarm optimization-SVM for classification. Antioxidant properties, measured as 2,2′-azinobis-3-ethylbenzothiazoline-6-sulfonic acid, 2,2-diphenyl-1-picrylhydrazyl (DPPH) scavenging capacity, and ferric-reducing antioxidant power, were used as reference methods during calibration (Yang et al., 2024). Spectral data were pre-processed using multiplicative scatter correction and standard normal variate. Calibration statistics included R2 and RMSEP values of 0.9778 and 0.4018% for the prediction of 2,2′-azinobis-3-ethylbenzothiazoline-6-sulfonic acid, 0.9414 and 2.0795% for the prediction of DPPH, and 0.9763 and 2.4386 μmol/L for the prediction of ferric-reducing antioxidant power (Yang et al., 2024). This study provides a customer-oriented approach to seaweed quality grading based on IR spectroscopy, offering a valuable tool for standardisation in the seaweed market (Yang et al., 2024). Ferro and collaborators (2019) reported the use of ATR and FT-MIR to predict protein and lipids, while Feng and collaborators (2013) used FT-MIR to evaluate the lipids profile in seaweed samples.
Polysaccharides
The most abundant polysaccharide in brown seaweed is alginate, which is composed of mannuronic (M) and guluronic acid (G) (Niemi et al., 2024). The ratio of M to G determines the physicochemical properties of alginate (Niemi et al., 2024). The utilisation of MIR spectroscopy combined with DRIFTS was evaluated for predicting alginate content, as measured by gas chromatography–mass spectrometry (GC–MS) or by the anthrone method used to determine crystalline cellulose, in North Atlantic brown seaweeds (Niemi et al., 2024). The MIR DRIFT calibration models provided adequate predictions for alginate (RE = 0.12, R2 = 0.82), while the utilisation of MIR-ATR spectroscopy accurately predicted the M-to-G ratio (RE = 0.14, R2 = 0.86). However, DRIFTS, ATR, and NIR spectroscopy were unable to predict crystalline cellulose (Niemi et al., 2024).
Zhao and collaborators (2021) reported the use of both ATR-MIR and RS to develop calibration models for some important polysaccharides using reference data obtained using HPLC as well as two other methods namely fucoidan estimation based on fucose content and a cationic dye method for sulphated polysaccharide estimation to determine the purity of extracted fucoidan in brown seaweeds (Zhao et al., 2021). The PLS cross-validation models achieved an R2CV of 0.998 and a root mean square error of cross-validation (RMSECV) of 1.7% (Zhao et al., 2021). The PLS models were further validated using four commercial fucoidan products analysed using HPLC as reference method (Zhao et al., 2021).
Similarly, polysaccharides from several dry seaweed species, including Kappaphycus alvarezii, Calliblepharis jubata, Chondrus crispus (Gigartinales, Rhodophyta), Gelidium corneum, Pterocladiella capillacea (Gelidiales, Rhodophyta), Laurencia obtusa (Ceramiales, Rhodophyta), Himanthalia elongata, Undaria pinnatifida, Saccorhiza polyschides, Sargassum vulgare, and Padina pavonica (Phaeophyceae, Ochrophyta), were measured using FTMIR-ATR and FT-RS (Pereira et al., 2013).
Sanjeewa and collaborators (2017) utilised FTMIR spectroscopy to characterise polysaccharides from various Sri Lankan marine algae species. A combination of hot water extraction and ethanol precipitation was utilised to obtain the polysaccharide extracts which were analysed for DPPH, alkyl, and hydroxyl radical scavenging activities using electron spin resonance spectrometry. The polysaccharide extracts intracellular reactive oxygen scavenging activity and was also assessed in Chang liver cell lines (Sanjeewa et al., 2017).
Vandanjon et al. (2023) also used ATR-FTMIR spectroscopy to predict polysaccharides, including carrageenans, fucoidans, and alginates, concentrations in Eucheuma denticulatum, Solieria chordalis (red algae), and Sargassum muticum (brown algae). These authors compared these predicted results with those obtained using purified extracts and commercial solutions of fucoidans, alginates, and carrageenans. Moreover, PCA identified different classes of polysaccharides based on seasonal variations indicating that FTMIR could be used to identify the structure of algal polysaccharides, with bioactivity depending on the harvest period (Vandanjon et al., 2023). The authors also stated that IR spectroscopy could identify iota-carrageenan in S. chordalis and E. denticulatum. This was particularly useful as the FTMIR spectra was able to measure carrageenan precursors during the algae growing phase, helping in the targeting and quality control during the extraction processes of these polysaccharides (Vandanjon et al., 2023).
Nepper-Davidsen et al. (2024) reported that the combination of PLS regression with both NIR and MIR spectroscopy was useful for predicting glucose, alginate, phlorotannins, and carbon content in seaweed samples. Additionally, the authors highlighted that PLS-DA successfully discriminated the origin of the seaweed samples according to region. The authors concluded that NIR and MIR spectroscopy are valuable tools for biomass grading of raw seaweed samples and establishing provenance (Nepper-Davidsen et al., 2024).
Traceability, geographical origin, and growing conditions
Determining the origin of seaweeds is crucial for quality assurance as well as to implement robust traceability systems (Hay et al., 2010; Yang et al., 2022). NIR spectroscopy was evaluated for its ability to identify Sargassum fusiforme based on the geographical origin, cultivar, and production method. The study employed a particle swarm optimization-SVM model to identify the origin of the samples. A correct classification rate of over 90% was achieved for the determination of the geographical origin of the samples, while a 100% classification rate was reported for the identification of the production method, validated with an independent set of samples (Yang et al., 2022).
Samples of the green seaweed species Ulva laetevirens (Chlorophyta), cultivated under various nutritional regimes (e.g., nitrogen and phosphorus repletion, nitrogen depletion, phosphorus depletion, and light limitation), were analysed by Derksen et al. (2023) using ATR-MIR spectroscopy. Statistical analysis of the MIR spectra revealed that the seaweed samples clustered according to their nutritional regimes during incubation. The authors concluded that MIR spectroscopy could effectively identify the abiotic factors influencing seaweed cultivation. The authors also determined that PLS calibration models provided a rapid analytical tool to monitor biomass, such as carbohydrate and nitrogen content (Derksen et al., 2023).
Gumansalangi et al. (2023) utilised various unsupervised techniques such as PCA and HCA, along with nonparametric supervised methods like SVM and random forests (RFs), to analyse the VIS–NIR spectral data from macroalgae collected from three regional zones in Indonesia (Western, Central, Eastern). The authors reported that PCA and HCA effectively classified the seaweed samples by species based on their VIS–NIR spectra. SVM models correctly classified 82% of the samples according to their regional zones, while the RF model achieved correct classification rates of 100%, 80%, and 82% for the training, test, and fivefold cross-validation sets, respectively (Gumansalangi et al., 2023).
Geographical discrimination of wakame seaweeds using vibrational spectroscopy was explored by different authors, Chen and collaborators (2023), through its combination with different classification methods and regression trees. Random Forests (RFs) were also evaluated for classifying seaweed samples based on their spectral properties (Chen et al., 2023). Furthermore, Chen et al. (2023) assessed the chemical composition of seaweed, which varies with the harvest period, using FTMIR for quantitative analysis of nutritional components, quality grading, and determining the harvest period of Porphyra haitanensis. Discriminant models were developed using KNN, PLS-DA, and adaptive boosting algorithms. The authors reported that the adaptive boosting algorithm produced the most comprehensive results, with forecast accuracy of 96.7%, macro precision of 0.971, macro recall of 0.965, and RMSE of 0.183 (Chen et al., 2023).
Vibrational spectroscopy and the sustainability of the seaweed industry
The integration of vibrational spectroscopy and ML tools in the seaweed industry offers significant sustainability benefits. As seaweed continues to gain attention as an eco-friendly food source, these technologies can support the sustainable growth of the industry by improving production efficiency, reducing waste, and ensuring the traceability of seaweed products. Seaweed farming itself presents environmental advantages, including minimal freshwater use, the absence of chemical fertilisers, and its ability to sequester carbon dioxide (Holdt & Kraan, 2011; Zhang et al., 2022).
These techniques, particularly NIR and MIR spectroscopy, enable real-time, non-destructive analysis of seaweed chemical composition and nutritional value. This allows for efficient monitoring of seaweed at various stages of production, including cultivation, harvest, and processing (Beć et al., 2022; Huang et al., 2024). For example, these methods and techniques can rapidly assess the nutrient profile of seaweed, allowing producers to optimise harvest timing and cultivation conditions. Such real-time analysis reduces the need for chemical testing, minimises waste, and improves overall resource efficiency during seaweed production (Amoriello et al., 2024).
The different ML algorithms further enhance sustainability by enabling predictive models that guide optimal harvesting and resource management decisions (Cao et al., 2022). These models can forecast the ideal harvest time based on growth conditions and seaweed composition, reducing the likelihood of harvesting at suboptimal times and thus limiting resource use and waste.
Algorithms, including SVM, PLS, and ANN, have been successfully applied to predict seaweed composition and optimise resource use. For example, ANN models have been shown to predict protein content in Gracilaria sp. with high accuracy, supporting decisions for harvesting based on protein concentration (Shalev et al., 2022). Such models allow for real-time adjustments during cultivation, reducing input waste and maximising yield. Additionally, the integration of ML algorithms in hyperspectral imaging systems enables simultaneous collection of spatial and spectral data, offering new avenues for monitoring seaweed quality and freshness throughout the supply chain (Amodio et al., 2020).
Traceability is crucial for ensuring the sustainability of seaweed products. Vibrational spectroscopy, combined with ML techniques, offers a robust method for verifying the geographical origin and species of seaweed, that is also time and cost-effective, ensuring that products are sourced and processed sustainably (Yang et al., 2022). By improving traceability, these technologies reduce the risk of food fraud and help maintain the integrity of sustainably sourced seaweed. Additionally, NIR and MIR spectroscopy can monitor the freshness and composition of seaweed throughout transport and storage, reducing food loss by ensuring that only high-quality products reach consumers (Nepper-Davidsen et al., 2024). The ability to predict shelf life and identify spoilage early on aligns with global efforts to reduce food waste, contributing to more sustainable food supply chains. The seaweed industry also has potential to contribute to a circular economy, where waste is minimised, and by-products are repurposed. Vibrational spectroscopy enables the precise identification of bioactive compounds within seaweed biomass, allowing manufacturers to extract valuable ingredients for use in other industries, such as pharmaceuticals, cosmetics, and biofuels (Pereira et al., 2013). This ensures that the entire seaweed biomass is utilised efficiently, reducing waste and improving the sustainability of seaweed-based production. For example, alginate extracted from brown seaweeds has been repurposed for wound dressings and controlled drug delivery systems due to its biocompatibility and gel-forming properties (Niemi et al., 2024). Additionally, fucoidan, a sulphated polysaccharide found in Sargassum species, has been used in anti-inflammatory and anti-cancer therapies, showcasing the potential of seaweed by-products in pharmaceuticals (Zhao et al., 2021). Further, in the bioenergy sector, seaweed waste has been converted into bioethanol and biogas, providing a renewable energy source while reducing overall waste from the production process (Fernando et al., 2017). These examples highlight how seaweed-based by-products can be fully utilised, promoting a circular economy and reducing environmental impact. Seaweed farming offers direct environmental benefits by absorbing significant amounts of carbon dioxide from the atmosphere. When combined with vibrational spectroscopy and ML tools, seaweed producers can optimise growth conditions, enhancing the carbon sequestration potential of their crops (Maehre et al., 2014). Furthermore, well-managed seaweed farms contribute to marine ecosystem health by creating habitats for marine species and enhancing biodiversity in coastal areas.
Limitations and challenges of these techniques
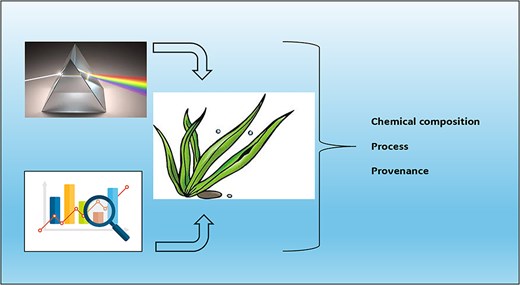
Predicting the proximate composition and nutritional value (e.g., CP, DM, or polysaccharides) remains one of the primary applications of IR spectroscopy methods (see Figure 1). Recently, IR spectroscopy has shown promise as a tool for aiding decisions on optimal harvesting times, monitoring biomass and cultivation conditions, where ensuring traceability, such as identifying species and geographic origin are the most reported applications. IR techniques like NIR, MIR, and hyperspectral imaging have demonstrated their ability to rapidly capture molecular snapshots of seaweed samples. Unlike traditional chemical and biochemical analyses, these techniques do not require destructive sampling or complex and laborious sample preparation.
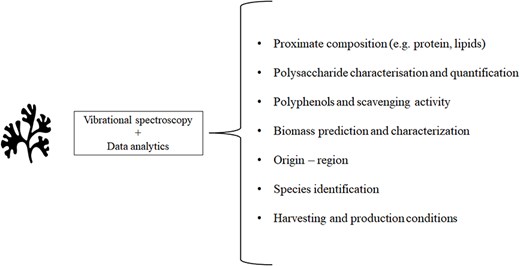
Summary of the applications of vibrational spectroscopy and data analytics in the seaweed industry.
The ability of IR spectroscopy to predict seaweed composition offers the seaweed industry a valuable tool for pre- and post-harvest processing. With multiple studies demonstrating that these techniques have the potential to measure seaweed chemical composition, biomass and the impact of different abiotic conditions. Developing and implementing vibrational spectroscopy tools will enable agile methods to support risk evaluation systems and provide objective measurements for identifying hazards during seaweed processing.
The adoption of these technologies presents several barriers, particularly for small- and medium-sized producers. The high initial cost of some of the advanced spectroscopy equipment or instruments, such as FTMIR or hyperspectral imaging systems, in addition to the need for specialised technical expertise often limit their widespread implementation (Amodio et al., 2020; Manley, 2014). Additionally, data processing and interpretation require sophisticated chemometric and ML algorithms and techniques, which may pose challenges for producers without access to such expertise (Szymańska et al., 2015). Overcoming these barriers will be crucial for enabling the full integration of sustainable practices across the seaweed industry. As advancements in portable, lower-cost spectrometers and user-friendly ML interfaces continue, it is expected that these technologies will become more accessible to a broader range of stakeholders.
However, the adoption of IR spectroscopy in the seaweed industry is still in its early stages. Despite its advantages, IR spectroscopy is sometimes viewed as a “black box” or merely a statistical tool. This perception arises from several factors, including insufficient training in these techniques, a preference for traditional methods over newer technologies (e.g., for proximate composition), and a lack of understanding of the background in spectroscopy and chemometrics fundamentals. As these techniques become integrated with data analytics, they will play a vital role in ensuring the sustainability and safety of seaweed production for consumers and for a wide range of stakeholders.
Author contributions
Aoife Power (Writing—review & editing), James Chapman (Writing—review & editing), Louwrens Hoffman (Writing—review & editing), and Daniel Cozzolino (Conceptualization, Writing—original draft, Writing—review & editing, Project administration, Supervision).
Funding
None declared.
Conflicts of interest
The authors declare that there is no conflict of interest.
Data availability
Data sharing not applicable to this article as no datasets were generated or analysed during this study.
