


Abstract
The consumption of meat analogues is steadily increasing due to factors such as concerns about protein intake, meat availability, health, and environmental issues. Mushrooms provide a potential solution for substituting or replacing animal protein due to their high nutritional value and unique sensory properties. This review examines the differences in physical characteristics, organoleptic qualities, amino acid profiles, and dietary fibre content of meat analogues derived from various mushroom species. The review employed a textual narrative synthesis approach and adhered to the Preferred Reporting Items for Systematic Reviews and Meta-Analyses (PRISMA) guidelines. A comprehensive analysis of 38 relevant publications reveals that the incorporation of mushrooms can influence the colour and texture of meat analogues. Additionally, the review highlights the impact of mushroom addition or substitution on the amino acid and dietary fibre content of meat analogues. It underscores the potential of mushrooms to create meat analogues with enhanced nutritional profiles, benefiting consumers, particularly those facing nutritional challenges like stunting. This article emphasises the importance of considering the specific mushroom species and processing techniques to optimise the quality of meat analogues.
Introduction
Food is a fundamental human need that must always be available in sufficient quantities, as well as being safe, nutritious, and diverse while also aligning with cultural and religious beliefs. However, the growing global population, particularly in developing nations like Indonesia, has created challenges in providing adequate food for all. According to data from Indonesia’s Central Statistics Agency (Badan Pusat Statistik/BPS), the country’s population reached 278.69 million by mid-2023, an increase of 1.05% compared to mid-2022 (BPS, 2023). If this growth rate continues, Indonesia’s population is projected to reach 343.81 million within the next 20 years, which will exacerbate challenges in food availability, particularly in sources of protein. Additionally, meat consumption in Indonesia tends to increase each year. Projections by Tenrisanna and Kasim (2020) using the Double Exponential Smoothing method estimate that by 2027, Indonesian meat production and consumption will reach 4,449,286 tons and 5,061,993 tons, respectively, indicating that meat consumption will exceed domestic production by that time.
A lack of adequate protein sources can lead to health issues such as muscular dystrophy, stunted growth, and a weakened immune system (Hashempour-Baltork et al., 2020). One solution to address this protein deficiency is through the increased production of meat alternatives, such as meat analogues, which can help ensure sufficient meat availability.
Meat analogues are products designed to closely resemble the aesthetic qualities such as texture, taste, and appearance and/or chemical properties of specific types of meat and can be shaped into sheets, disks, patties, strips, and other forms (Joshi & Kumar, 2015). The popularity of meat analogues continues to grow, driven by factors such as the demand for food security, adequate protein intake, and considerations of health and environmental impact. According to Table 1, the production of meat analogues has a lower environmental impact, with a carbon footprint of 1.62–1.8 kg CO2 per kg and land and energy use of 3.3–3.6 m2/kg and 16.4–19.9 MJ/kg, respectively (Smetana et al., 2021).
Comparison of carbon footprint, water, land, and energy use in meat and mushroom-based meat analogue production.
| Type of meat | Carbon footprint (kg CO2 eq./kg) | Water use (m3/kg) | Land use (m2/kg) | Energy use (MJ/kg) | References |
|---|---|---|---|---|---|
| Chicken | 5.2–5.82 | 3.91 | 3.85–3.89 | 51.64–63.4 | Smetana et al. (2015) and Kumar et al. (2017) |
| Beef | 27.3 | 15.5 | 42.9 | 59.2 | Smetana et al. (2015) and de Vries et al. (2015) |
| Meat analogue (Mushroom) | 1.62–1.8 | NA | 3.3–3.6 | 16.4–19.9 | Smetana et al. (2021) |
An alternative raw material for producing meat analogues is edible mushrooms. However, mushrooms have not yet been widely used as a primary ingredient in meat analogue production. Data from Mintel (2020) showed that the primary sources of plant-based protein used in meat analogue formulations are soy protein (63.3% of total products; including 20.3% isolate, 33.4% concentrate, and 9.6% textured), followed by wheat (46.8% of total products; including 14.7% wheat protein and 32.1% gluten), legumes (40.2% of total products; including 12.2% isolate and 28.4% concentrate), rice protein (7.2%), and other vegetable proteins (4.7%).
Table 2 presents the chemical composition of various mushroom varieties, which is crucial for understanding their potential as meat analogues. Mushrooms are known for their unique nutritional profiles, providing a good source of protein, dietary fibre, and phenolic compounds with strong antioxidant potential (Banerjee et al., 2020). Mushroom protein contains eight essential amino acids required by humans, most of which are close to the ideal pattern, which is a complete ratio of essential amino acids. Ideal amino acid profiles can be found in various mushroom species, including Agaricus bisporus, Flammulina velutipes, Tricholoma matsutake, and Pleurotus eryngii (Wang & Zhao, 2023).
Summary of important nutrients of selected wild edible mushrooms (per 100 g).
| Species | Location | Protein | Carbohydrate | Fat | Vit B1 | Vit B2 | Vit B3 | Fe | Zn | Ca | Na | P | Mg | References |
|---|---|---|---|---|---|---|---|---|---|---|---|---|---|---|
| g | g | g | mg | mg | mg | mg | mg | mg | mg | mg | mg | |||
| Cultivated | ||||||||||||||
| A. bisporus | Czechia | 2.9 | 3.1 | 0.3 | 0.1 | 0.4 | 1.3 | 8 | 8 | 123 | 13 | Institute of Agricultural Economics and Information (2020) | ||
| B. edulis | Spain | 6.6 | 59.1 | 1.6 | – | – | – | – | – | – | – | – | – | Mena García et al. (2021) |
| C. cibarius | Czechia | 2.1 | 1.9 | 5.5 | – | – | – | – | – | – | 2 | – | – | Institute of Agricultural Economics and Information (2020) |
| Wild mushrooms | ||||||||||||||
| Agaricus arvensis | Europe | 2.7 | – | – | – | – | – | – | – | – | – | – | – | Procházka et al. (2023) |
| Portugal | 2.9 | 1.9 | 0.1 | – | – | – | – | – | – | – | – | – | Barros et al. (2007) | |
| A. bisporus | Poland | – | – | – | – | – | – | – | 0.6 | – | – | – | – | Mirończuk-Chodakowska et al. (2019) |
| B. edulis | Europe | 5.6 | – | – | – | – | – | – | – | – | – | – | – | Procházka et al. (2023) |
| Poland | – | – | – | – | – | – | – | – | 20.0 | 523.0 | 243.0 | 77.0 | Malinowski et al. (2021) | |
| Poland | – | – | – | – | – | – | – | 1.7 | – | – | – | – | Mirończuk-Chodakowska et al. (2019) | |
| Poland | 2.3 | 7.4 | – | 0.9 | 2.6 | 22.9 | – | – | – | – | – | – | Jaworska et al. (2015) | |
| Cortinarius caperatus | Poland | – | – | – | – | – | – | – | 9.0 | – | – | – | – | Mirończuk-Chodakowska et al. (2019) |
| Imleria badia | Poland | – | – | – | – | – | – | – | – | 6.0 | 475.0 | 262.0 | 359.0 | Malinowski et al. (2021) |
| Poland | – | – | – | – | – | – | – | 1.4 | – | – | – | – | Mirończuk-Chodakowska et al. (2019) | |
| Lactarius deliciosus | Greece | – | – | – | – | – | – | 3.0 | 8.1 | – | – | – | – | Aloupi et al. (2012) |
| Poland | – | – | – | – | – | – | – | 12.9 | – | – | – | – | Mirończuk-Chodakowska et al. (2019) | |
| Portugal | 3.0 | 6.3 | 0.2 | – | – | – | – | – | – | – | – | – | Barros et al. (2007) | |
| Leccinum scabrum | Poland | – | – | – | – | – | – | – | – | 8.0 | 406.0 | 279.0 | 62.0 | Malinowski et al. (2021) |
| Poland | – | – | – | – | – | – | – | 0.9 | – | – | – | – | Mirończuk-Chodakowska et al. (2019) | |
| Leucopaxillus giganteus | Portugal | 3.4 | 3.1 | 0.4 | – | – | – | – | – | – | – | – | – | Barros et al. (2007) |
| Morchella esculenta | Bulgaria | 11.3 | 78.3 | – | – | – | – | – | – | – | – | – | – | Papazav et al. (2020) |
| Portugal | 11.5 | 74.6 | – | – | – | – | – | – | – | – | – | – | Heleno et al. (2013) | |
| Serbia | 11.5 | 78.4 | – | – | – | – | – | – | – | – | – | – | Heleno et al. (2013) | |
| Sarcodon imbricatus | Portugal | 2.4 | 3.4 | 0.9 | – | – | – | – | – | – | – | – | – | Barros et al. (2007) |
| Tricholoma portentosum | Poland | – | – | – | – | – | – | – | 1.1 | – | – | – | – | Mirończuk-Chodakowska et al. (2019) |
| Portugal | 2.1 | 3.6 | 0.4 | – | – | – | – | – | – | – | – | – | Barros et al. (2007) |
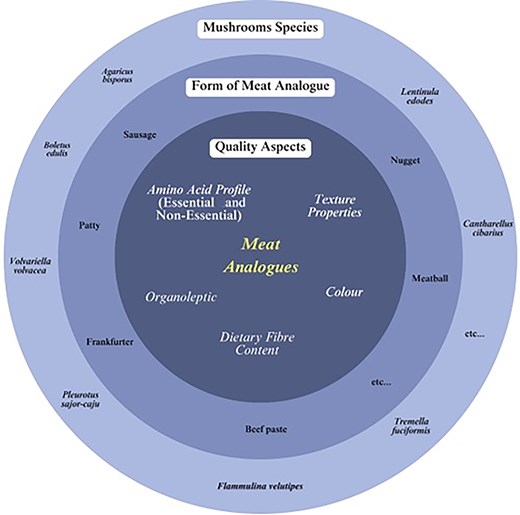
The development of mushroom-based meat analogues should consider not only their nutritional value, such as amino acid and dietary fibre content but also their physical and sensory (organoleptic) qualities. Consumers choose meat analogues not only to meet nutritional needs but also to enjoy the taste and texture. This literature review examines the physical characteristics, sensory properties, amino acid profiles, and dietary fibre content of meat analogues derived from various mushroom species. The aim of this review was to provide insights and guidance for optimising the quality of mushroom-based meat analogues. Accordingly, it also covered the nutritional aspects, specifically the essential and non-essential amino acid profiles, along with the dietary fibre content of these products.
Research design
The systematic literature review method was employed in this research. This method is a way of conducting a study or review that includes the identification, evaluation, and synthesis of research or ideas produced by researchers (Okoli & Schabram, 2012). Descriptive analysis in the form of textual narrative synthesis (TNS) was used. TNS is a descriptive analysis method that categorises studies into more homogeneous subgroups. The TNS method was conducted using the PRISMA (Preferred Reporting Items for Systematic Reviews and Meta-Analyses) guidelines. This outlines the procedure for study selection and rejection (Figure 1). A flowchart of the systematic review search process based on PRISMA guidelines is shown in Figure 1. The sorting of the literature began with a literature search using keywords through Google Scholar, Scopus, and PubMed. Literature searches on these sites used relevant keywords so that literature with appropriate topics could be found.
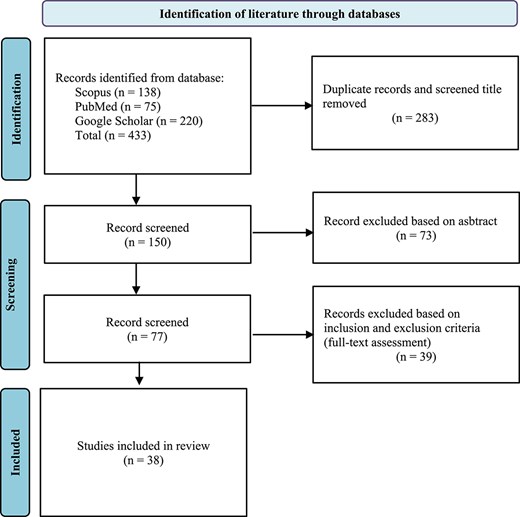
Flowchart of the systematic review search process based on PRISMA guidelines.
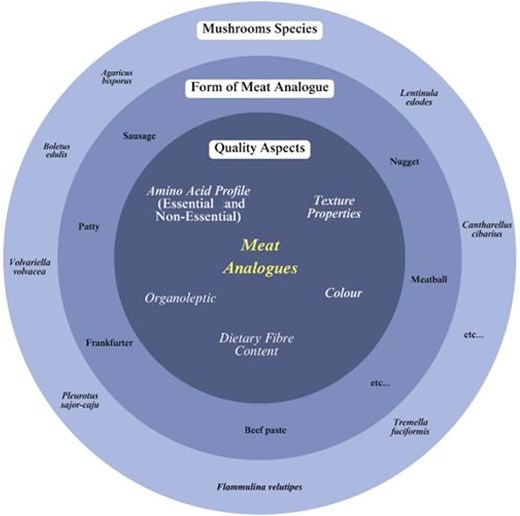
Overall framework for the influence of mushroom addition and/or substitution on physicochemical properties and sensorial quality of meat analogue products.
A literature search was done in the Scopus database, continuing with the PubMed database to collect other papers that were not published in Scopus. Additional relevant databases from other source such as Web of Sciences (WoS) were also used to ensure a more comprehensive retrieval of all related articles. The following keywords were used: “meat analogue mushrooms,” OR “application mushroom on meat analogue,” OR “mushroom meat analogue,” OR “quality of mushroom meat analogue,” OR “acceptance of mushroom meat analogue” as well using the combination of mushroom meat analogue with the name of products like sausage, burger, frankfurter, and patty.
The articles were then selected based on the following criteria: (1) the relevancy of the paper’s content to answer the research objectives; thus, whether the literature describe the process of making mushroom meat analogue, the nutritional and physical characteristic as well the sensory properties of mushroom meat analogue. It would be more interesting if the article also featured amino acid profiles and dietary fibre. (2) The studies recruited using one or more species of mushroom in the production of mushroom meat analogue, (3) papers written in English, (4) papers published within 1994–2023. The following are the data analysis and interpretations from the sorted literature:
Comparing the physical attributes of meat substitutes made from various mushroom species, including hardness, elasticity, compactness, chewiness, and hunter colour L*a*b.
Comparing the organoleptic properties of meat substitutes derived from various mushroom species.
Comparing the essential and non-essential amino acid profiles of meat substitutes derived from various mushroom species.
Comparison of the dietary fibre content of meat substitutes derived from various mushroom species.
The sorted literature was used for data analysis and interpretation, specifically by comparing data from one literature with that of other related or supporting literature. While verified data will be expanded upon and assembled into a descriptive review, unconfirmed data will be rearranged or contrasted with other data to ascertain its applicability to the subject under discussion.
Searching the literature using certain keywords resulted in 433 literatures that will then be sorted. Of the 433 literatures, 220 literatures were obtained from Google Scholar, 138 literatures were obtained from Scopus, and 75 literatures were obtained from PubMed. From 433 literatures, 283 literatures were excluded based on the title and duplication, leaving 150 literatures. Furthermore, 150 literatures were filtered based on their abstracts, and 73 literatures were excluded so that 77 literatures remained. Then, the 77 literatures will be filtered based on the inclusion and exclusion criteria so that 38 literatures remain. Thus, 38 literatures were selected for further analysis after a thorough literature assessment will be included in the discussion of literature review. Details of these 38 literatures are shown in Appendix A.
Results and discussion
Mushroom species commonly used as raw material for the production of meat analogue belong to the Basidiomycota and Ascomycota phyla (Cheung, 2009). These phyla contain a wide variety of families and species. They are a suitable choice due to their nutritional content and their glutamate, nucleotides, and umami compounds could create desirable sensory effects that appeal to consumers (Sun et al., 2020). Furthermore, the similarity in texture and colour between mushrooms and some meat products makes mushrooms a strong potential raw material for meat analogues (Giacalone et al., 2022). Meat analogues are generally produced in the form of processed meat products, such as burgers, nuggets, chicken cutlets or steaks, and emulsified products, such as Frankfurter and Mortadella-type sausages (Kyriakopoulou et al., 2019).
The impact of mushroom addition and/or substitution on colour parameters and textural properties of meat analogues
Meat analogues need to be evaluated for its physical characteristics, especially colour for its highly noticeable physical attribute by comparing the colour of meat analogues to that of conventional meat (Bohrer, 2019). The colour of the meat analogues will affect the meat quality and consumer’s motivation to purchase meat analogues. The colour parameters of such as lightness (L*), red/green value (a*), and blue/yellow value (b*) are shown in Table 3.
Several studies examined the effects of different mushroom species on the colour characteristics of meat analogues as shown in Table 3. Patinho et al. (2019) found that adding A. bisporus to beef burgers (15%–30%) resulted in decreased lightness (L*) and increased a* and b* values. Similar findings were reported by multiple authors regarding the incorporation of A. bisporus into meat analogues, which consistently showed reduced lightness levels. Other mushrooms, like Boletus edulis and Cantharellus cibarius, also led to decreased lightness and increased a* and b* values in beef frankfurter.
Wang et al. (2019) noted that 1% F. velutipes reduced lightness in chicken sausage while increasing a* and b* values. A study on pork sausage substitution with Lentinula edodes showed decreased lightness with increasing substitution levels, although a* and b* values remained stable. Conversely, substituting pork patty with Tremella fuciformis resulted in increased lightness and b* values.
Overall, these studies indicated that the addition of mushrooms can change the colour characteristics of meat analogues, primarily affecting lightness (L*). Factors influencing these changes include the original colour of the mushroom, polyphenol oxidase (PPO) content, Maillard reactions, and dietary fibre content. While most studies showed decreased lightness, it was noteworthy that the addition of T. fuciformis, resulted in increased lightness, highlighting the complexity of mushroom impacts on meat analogue colour.
Polyphenol oxidase is an enzyme that browns meals by catalysing the oxidation of phenolic substances, which can result in the creation of brown pigments. PPO in meat analogues, particularly plant-based ones, can alter the product’s brightness by creating discolouration after storage or cooking, making it look darker. The amount of browning is determined by the PPO activity in the plant components (such as soy, pea, or lentil proteins) utilised to manufacture the meat analogue (Abdullah et al., 2022). High PPO activity in the raw material (such as certain legumes or fruits) might cause greater browning, reducing the lightness of the meat counterpart (Zawawi et al., 2022). Conversely, if PPO activity is reduced (e.g., by blanching or using PPO inhibitors), the product may remain lighter in colour (Sui et al., 2023).
The Maillard reaction is a non-enzymatic browning process in which reducing sugars react with amino acids or proteins. This reaction is critical for the formation of flavour, aroma, and colour in many processed foods, including meat substitutes (Kathuria et al., 2023; Li & Li, 2020). When meat analogues are cooked, particularly at high temperatures (such as grilling or frying), Maillard reactions can cause the production of dark pigments, diminishing the product’s lightness (Silva Barbosa Correia et al., 2024; Sun et al., 2022). A high concentration of reducing sugars or amino acids in the formulation (e.g., from the protein source or additional carbohydrates) may result in higher Maillard reactions, darkening the meat equivalent. The Maillard reaction contributes to a more “meaty” appearance and flavour; however, excessive browning might be undesirable in terms of lightness and overall appearance (Zhang et al., 2024).
Effect of mushroom addition and/or substitution on colour parameters of meat analogues.
| Species | Amount (%) | Meat product | L* | a* | b* | References |
|---|---|---|---|---|---|---|
| A. bisporus | 0 | Beef burger | 50.2 ± 3.28 | 13.7 ± 1.92 | 12.6 ± 1.90 | Patinho et al. (2019) |
| 15 | Beef burger | 48.9 ± 3.33 | 15.1 ± 1.80 | 14.3 ± 1.26 | ||
| 30 | Beef burger | 49.8 ± 3.95 | 15.7 ± 1.91 | 13.0 ± 1.56 | ||
| 0 | Sucuk beef sausage | 33.60 ± 7.53 | 14.16 ± 2.91 | 16.48 ± 6.11 | Gençcelep (2012) | |
| 1 | Sucuk beef sausage | 30.15 ± 6.17 | 10.93 ± 2.75 | 11.05 ± 5.33 | ||
| 2 | Sucuk beef sausage | 30.08 ± 6.57 | 10.14 ± 3.25 | 10.45 ± 6.72 | ||
| 0 | Beef patty | 44.21 ± 1.58 | 15.31 ± 1.12 | 14.86 ± 0.73 | Cerón-Guevara et al. (2020a) | |
| 2.5 | Beef patty | 41.91 ± 2.44 | 13.21 ± 0.72 | 15.55 ± 1.49 | ||
| 5.0 | Beef patty | 40.12 ± 1.90 | 13.57 ± 1.11 | 17.20 ± 1.42 | ||
| 0 | Beef emulsion | 84.19 ± 0.99 | −0.34 ± 0.03 | 17.19 ± 0.64 | Kurt and Gençcelep (2018) | |
| 1 | Beef emulsion | 77.39 ± 1.12 | −0.04 ± 0.03 | 18.88 ± 0.69 | ||
| 2 | Beef emulsion | 75.51 ± 1.01 | 0.18 ± 0.04 | 16.51 ± 0.89 | ||
| 3 | Beef emulsion | 70.82 ± 1.03 | 0.70 ± 0.09 | 16.08 ± 0.18 | ||
| 0 | Ground beef | 38.6 ± 0.56 | 5.60 ± 0.22 | 14.4 ± 0.80 | Wong et al. (2017) | |
| 25 | Ground beef | 38.5 ± 0.22 | 4.49 ± 0.16 | 15.0 ± 0.32 | ||
| 50 | Ground beef | 37.5 ± 0.40 | 4.60 ± 0.40 | 14.8 ± 0.87 | ||
| 75 | Ground beef | 35.6 ± 0.34 | 4.90 ± 0.34 | 14.7 ± 0.34 | ||
| 100 | Ground beef | 31.0 ± 0.36 | 5.33 ± 0.36 | 12.7 ± 0.36 | ||
| 5 | Beef paste | 35.09 ± 0.5 | 3.83 ± 0.06 | 16.19 ± 0.58 | Qing et al. (2021) | |
| 20 | Chicken nugget | 71.75 | 0.6 | 13.57 | Akesowan and Jariyawaranugoon (2021) | |
| B. edulis | 0 | Beef frankfurter | 75.28 ± 1.88 | 7.48 ± 0.86 | 4.17 ± 0.73 | Novakovic et al. (2020) |
| 0.75 | Beef frankfurter | 69.23 ± 2.09 | 8.89 ± 0.89 | 8.48 ± 0.89 | ||
| 1.5 | Beef frankfurter | 64.52 ± 2.3 | 9.05 ± 0.71 | 10.59 ± 0.84 | ||
| C. cibarius | 0 | Beef frankfurter | 75.63 ± 1.88 | 7.45 ± 0.82 | 4.14 ± 0.71 | Novakovic et al. (2019) |
| 0.75 | Beef frankfurter | 75.03 ± 1.71 | 7.49 ± 0.92 | 6.42 ± 0.93 | ||
| 1.5 | Beef frankfurter | 72.11 ± 2.08 | 8.9 ± 0.91 | 8.27 ± 1.01 | ||
| F. velutipes | 0 | Pork sausage | 46.62 ± 0.30 | 11.10 ± 0.18 | 15.21 ± 0.14 | Wang et al. (2019) |
| 2.5 | Pork sausage | 44.37 ± 0.24 | 11.09 ± 0.65 | 16.82 ± 0.26 | ||
| 5.0 | Pork sausage | 43.66 ± 0.74 | 10.40 ± 0.60 | 17.93 ± 0.99 | ||
| 0 | Pork sausage | 67.46 | 8.03 | 11.41 | Choe et al. (2018) | |
| 1 | Pork sausage | 69.07 | 7.96 | 11.5 | ||
| 2 | Pork sausage | 69.21 | 7.79 | 11.83 | ||
| 0 | Goat sausage | 47.42 ± 0.22 | 7.62 ± 0.20 | 13.24 ± 0.32 | Banerjee et al. (2020) | |
| 4 | Goat sausage | 49.42 ± 0.24 | 7.22 ± 0.16 | 13.18 ± 0.22 | ||
| 6 | Goat sausage | 52.02 ± 0.20 | 6.32 ± 0.14 | 13.20 ± 0.24 | ||
| 0 | Chicken sausage | 84.4 | 1.64 | 11.34 | Jo et al. (2018) | |
| 1 | Chicken sausage | 83.52 | 1.85 | 11.67 | ||
| Hypsizygus marmoreus | 5 | Beef paste | 45.71 ± 0.45 | 5.55 ± 0.38 | 15.69 ± 0.19 | Qing et al. (2021) |
| L. edodes | 0 | Pork sausage | 45.49 ± 0.09 | 18.59 ± 0.19 | 18.63 ± 0.24 | Wang et al. (2019) |
| 25 | Pork sausage | 44.86 ± 0.24 | 18.30 ± 0.07 | 18.24 ± 0.19 | ||
| 50 | Pork sausage | 43.43 ± 0.33 | 18.41 ± 0.24 | 18.76 ± 0.26 | ||
| 75 | Pork sausage | 42.52 ± 0.38 | 18.68 ± 0.03 | 18.32 ± 0.38 | ||
| 100 | Mushroom sausage | 41.49 ± 0.33 | 18.36 ± 0.19 | 18.42 ± 0.30 | ||
| 0 | Beef burger | 60.22 ± 2.35 | 11.56 ± 0.51 | 14.75 ± 0.67 | Mattar et al. (2018) | |
| 5 | Beef burger | 62.31 ± 0.17 | 10.77 ± 0.66 | 15.78 ± 0.78 | ||
| 20 | Beef burger | 59.27 ± 0.99 | 10.90 ± 0.68 | 15.34 ± 0.72 | ||
| 0 | Pork frankfurter | 74.63 | 2.77 | 10.33 | Pil-Nam et al. (2015) | |
| 0.4 | Pork frankfurter | 72.98 | 2.77 | 10.16 | ||
| 1.2 | Pork frankfurter | 70.29 | 2.54 | 11.39 | ||
| 0 | Chicken nugget | 63.89 ± 0.29 | 1.62 ± 0.05 | – | Akesowan (2016) | |
| 1.84 | Chicken nugget | 65.45 ± 0.57 | 1.85 ± 0.09 | – | Mattar et al. (2018) | |
| P. eryngii | 0 | Pork sausage | 55.64 ± 1.82 | 17.68 ± 1.75 | 12.05 ± 0.35 | Wang et al. (2019) |
| 25 | Pork sausage | 55.14 ± 1.69 | 18.76 ± 0.36 | 13.18 ± 0.62 | ||
| 20 | Extruded analogue meat | 44.13 ± 0.80 | 9.95 ± 0.19 | 20.96 ± 0.34 | Mandliya et al. (2022) | |
| 40 | Extruded analogue meat | 36.95 ± 1.08 | 9.86 ± 0.22 | 15.99 ± 1.06 | ||
| P. ostreatus | 2.5 | Beef patty | 46.88 ± 2.38 | 16.44 ± 0.58 | 20.06 ± 1.15 | Cerón-Guevara et al. (2020a) |
| 5.0 | Beef patty | 41.50 ± 2.80 | 14.81 ± 0.62 | 19.65 ± 1.63 | ||
| 5 | Beef paste | 40.09 ± 0.38 | 6.68 ± 0.36 | 16.62 ± 0.19 | Qing et al. (2021) | |
| P. sajor-caju | 0 | Chicken nugget | 54.72 | 10.23 | 29.2 | Husain and Huda-Faujan (2020) |
| 60 | Chicken nugget | 59.33 | 9.59 | 29.53 | ||
| 50 | Chicken nugget | 57.24 | 9.51 | 30.02 | ||
| 0 | Chicken patty | 57.86 + 0.84 | 3.46 + 0.26 | 21.03 + 0.29 | Rosli et al. (2011) | |
| 25 | Chicken patty | 51.02+ 1.94 | 3.61 + 0.29 | 18.77 + 0.47 | ||
| 50 | Chicken patty | 52.65+ 1.16 | 3.24 + 0.41 | 18.12 + 0.84 | ||
| P. sapidus | 0 | Chicken sausage | 72.35 ± 0.01 | 11.56 ± 0.01 | 12.52 ± 0.01 | Stephan et al. (2018) |
| 100 | Mushroom sausage | 66.23 ± 0.01 | 13.09 ± 0.01 | 20.52 ± 0.01 | ||
| Volvariella volvacea | 0 | Beef paste | 43.89 ± 0.74 | 5.92 ± 0.16 | 15.06 ± 0.46 | Qing et al. (2021) |
| 5 | Beef paste | 38.80 ± 0.68 | 4.62 ± 0.22 | 16.81 ± 0.07 | ||
| 0 | Pork sausage | 55.1 ± 0.87 | 10.27 ± 0.16 | 14.16 ± 0.58 | Wang et al. (2018) | |
| 2 | Pork sausage | 48.4 ± 0.24 | 6.69 ± 0.14 | 14.85 ± 0.17 | ||
| 4 | Pork sausage | 47. 6 ± 0.32 | 5.83 ± 0.07 | 16.67 ± 0.03 | ||
| Tremella uciformis | 0 | Pork patty | 61.73 ± 2.9 | 4.36 ± 0.04 | 14.20 ± 0.01 | Cha et al. (2014) |
| 10 | Pork patty | 64.31 ± 4.49 | 3.75 ± 0.14 | 14.39 ± 0.16 | ||
| 20 | Pork patty | 65.65 ± 0.08 | 3.94 ± 0.09 | 14.51 ± 0.1 | ||
| 30 | Pork patty | 67.23 ± 0.15 | 3.26 ± 0.04 | 14.60 ± 0.21 |
Note. L* value denotes lightness while a* and b* are coordinates of chromaticity.
a* value indicates red-green component of a colour, where a* (positive) and a* (negative) indicate red and green values, respectively.
b* value is represented on the axis as b* (positive) and b* (negative) values the yellow and blue, respectively.
Dietary fibre, particularly from plant-based sources, can affect the texture and appearance of meat substitutes. Fibre absorbs water, altering the product’s moisture content and structure. The fibre’s interaction with the proteins and carbs in the meat analogue formulation may also influence how the product performs when cooked (Dinalia et al., 2024). A high amount of fibre can impact the lightness in two main ways. First, fibres could reflect light in various ways, leading to either a lighter or denser look. Second, dietary fibres may attach to certain pigments or engage with enzymes such as PPO, potentially minimising browning. However, elevated fibre content might not directly stop Maillard reactions, so the effect on lightness will be influenced by the source of the fibre and the overall makeup of the meat substitute (da Silva et al., 2024).
PPO can promote browning through enzymatic oxidation, which results in a darker look. Maillard reactions can introduce non-enzymatic browning, further darkening the product when subject to heat. Dietary fibre may lessen the severity of browning by either affecting PPO activity or changing the texture and cooking process, although it may not directly block Maillard reactions. It’s crucial to manage the activity of PPO (for instance, by choosing ingredients with low PPO levels or using inhibitors), limit excessive Maillard reactions (by controlling heat and duration during cooking), and fine-tune the fibre content to achieve the right texture without causing excessive browning. Modifying these elements can aid in creating a meat substitute with an attractive lightness and appealing visual traits.
The texture properties of meat analogues assessed using a texture profile analyser (TPA), which include attributes like hardness, springiness, cohesiveness, gumminess, and chewiness, significantly affect consumer perception. As shown in Table 4, addition of certain species of mushrooms such as A. bisporus and F. velutipes resulted in decreased texture parameters in meat products. For example, Patinho et al. (2019) found that incorporating A. bisporus into beef burgers reduced hardness and chewiness. Similarly, multiple studies, including those by Cerón-Guevara et al. (2020a) and Banerjee et al. (2020), noted decreased texture values in sausage products with mushroom additions. Conversely, some mushrooms like B. edulis and C. cibarius could enhance texture properties, increasing hardness and chewiness when added to products. For example, Novakovic et al. (2020) highlighted that the addition of B. edulis led to improved hardness and cohesiveness in beef frankfurter.
Effect of mushroom addition and/or substitution on textural properties of meat analogues.
| Species | Amount (%) | Meat product | Hardness (N) | Springiness (mm) | Cohesiveness (mm/mm) | Gumminess (N) | Chewiness (N.mm) | References |
|---|---|---|---|---|---|---|---|---|
| A. bisporus | 0 | Beef burger | 13,126 ± 559 g | 0.841 ± 0.019 | 0.466 ± 0.050 | – | 5,106 ± 577 g.mm | Patinho et al. (2019) |
| 15 | Beef burger | 6,207 ± 439 g | 0.881 ± 0.007 | 0.701 ± 0.009 | – | 3,836 ± 308 g.mm | ||
| 30 | Beef burger | 2,628 ± 270 g | 0.816 ± 0.032 | 0.575 ± 0.035 | – | 1,242 ± 218 g.mm | ||
| 0 | Beef patty | 53.62 ± 6.76 | 0.78 ± 0.01 | 0.58 ± 0.02 | 31.06 ± 3.92 | 24.08 ± 3.13 | Cerón-Guevara et al. (2020b) | |
| 2.5 | Beef patty | 40.83 ± 6.51 | 0.70 ± 0.05 | 0.54 ± 0.02 | 22.33 ± 4.25 | 15.81 ± 36.23 | ||
| 5.0 | Beef patty | 51.14 ± 3.98 | 0.68 ± 0.05 | 0.49 ± 0.03 | 25.19 ± 2.84 | 17.14 ± 2.79 | ||
| 0 | Beef patty | 29.31 | 6.75 | 0.35 | 10.27 | 69.96 | Kim et al. (2011) | |
| 27 | Beef patty | 17.73 | 2.26 | 0.06 | 0.98 | 2.22 | ||
| 0 | Beef emulsion | 56.86 ± 2.34 g | 0.89 ± 0.01 | 0.76 ± 0.04 | 42.61 ± 0.15 g | 37.92 ± 0.46 g.mm | Kurt and Gençcelep (2018) | |
| 1 | Beef emulsion | 60.15 ± 2.60 g | 0.92 ± 0.00 | 0.82 ± 0.00 | 49.63 ± 2.57 g | 45.65 ± 2.36 g.mm | ||
| 2 | Beef emulsion | 72.70 ± 5.23 g | 0.93 ± 0.00 | 0.84 ± 0.00 | 61.45 ± 4.93 g | 57.47 ± 5.04 g.mm | ||
| 3 | Beef emulsion | 54.71 ± 2.84 g | 0.89 ± 0.00 | 0.77 ± 0.02 | 42.42 ± 3.35 g | 37.75 ± 2.99 g.mm | ||
| 0 | Beef frankfurter | 20.56 ± 1.01 | 0.78 ± 0.03 | 0.38 ± 0.01 | 7.73 ± 0.32 | 6.01 ± 0.46 | Cerón-Guevara et al. (2020a) | |
| 2.5 | Beef frankfurter | 15.33 ± 2.63 | 0.70 ± 0.04 | 0.34 ± 0.01 | 5.24 ± 1.27 | 3.67 ± 0.98 | ||
| 5.0 | Beef frankfurter | 12.07 ± 1.25 | 0.66 ± 0.02 | 0.34 ± 0.01 | 4.10 ± 0.53 | 2.70 ± 0.34 | ||
| 5.0 | Beef paste | 10002.93 ± 193.2 g | 0.94 ± 0.03 | 0.90 ± 0.02 | 8934.32 ± 220.47 g | 8570.11 ± 181.63 g.mm | Qing et al. (2021) | |
| B. edulis | 0 | Beef frankfurter | 2.00 ± 0.15 | 0.95 ± 0.02 | 0.82 ± 0.02 | 1.65 ± 0.10 | 1.56 ± 0.11 | Novakovic et al. (2020) |
| 0.75 | Beef frankfurter | 2.08 ± 0.11 | 0.95 ± 0.02 | 0.85 ± 0.02 | 1.76 ± 0.10 | 1.66 ± 0.08 | ||
| 1.5 | Beef frankfurter | 2.11 ± 0.12 | 0.95 ± 0.02 | 0.85 ± 0.01 | 1.80 ± 0.10 | 1.70 ± 0.11 | ||
| C. cibarius | 0 | Beef frankfurter | 1.98 ± 0.32 | 0.96 ± 0.02 | 0.83 ± 0.02 | – | 1.62 ± 0.25 | Novakovic et al. (2019) |
| 0.75 | Beef frankfurter | 1.99 ± 0.28 | 0.96 ± 0.03 | 0.84 ± 0.02 | – | 1.63 ± 0.20 | ||
| 1.5 | Beef frankfurter | 2.00 ± 0.21 | 0.95 ± 0.03 | 0.83 ± 0.02 | – | 1.68 ± 0.24 | ||
| F. velutipes | 0 | Pork sausage | 8,813 ± 109 | 0.934 ± 0.017 cm | 0.710 ± 0.023 cm/cm | – | 6,080 ± 99 N.cm | Wang et al. (2019) |
| 2.5 | Pork sausage | 7,569 ± 161 | 0.875 ± 0.009 cm | 0.614 ± 0.052 cm/cm | – | 4,774 ± 88 N.cm | ||
| 5.0 | Pork sausage | 5,945 ± 72 | 0.826 ± 0.021 cm | 0.520 ± 0.012 cm/cm | – | 3,361 ± 64 N.cm | ||
| 0 | Pork sausage | 48.90 | 0.53 cm | 0.23 cm/cm | 11.17 | 5.96 N.cm | Choe et al. (2018) | |
| 1 | Pork sausage | 37.1 | 0.48 cm | 0.21 cm/cm | 7.88 | 3.76 N.cm | ||
| 2 | Pork sausage | 35.51 | 0.42 cm | 0.2 cm/cm | 7.22 | 3.01 N.cm | ||
| 0 | Goat sausage | 42.42 ± 1.86 | 0.86 ± 0.01 cm | 0.48 ± 0.02 cm/cm | 14.79 ± 1.04 | 14.05 ± 0.82 N.cm | Banerjee et al. (2020) | |
| 4 | Goat sausage | 36.33 ± 2.08 | 0.83 ± 0.02 cm | 0.45 ± 0.01 cm/cm | 12.83 ± 1.34 | 11.75 ± 0.91 N.cm | ||
| 6 | Goat sausage | 34.33 ± 2.12 | 0.83 ± 0.02 cm | 0.44 ± 0.01 cm/cm | 12.08 ± 1.57 | 9.46 ± 0.84 N.cm | ||
| 0 | Chicken sausage | 75.98 | 0.74 cm | 0.3 cm/cm | 22.38 | 16.64 N.cm | Jo et al. (2018) | |
| 1 | Chicken sausage | 68.48 | 0.67 cm | 0.28 cm/cm | 19.34 | 13.04 N.cm | ||
| A. bisporus and P. ostreatus | 2.5/2.5 | Beef frankfurter | 11.50 ± 0.95 | 0.59 ± 0.03 | 0.31 ± 0.03 | 3.66 ± 0.71 | 2.17 ± 0.51 | Cerón-Guevara et al. (2020a) |
| P. ostreatus | 2.5 | Beef patty | 46.77 ± 1.13 | 0.64 ± 0.04 | 0.51 ± 0.03 | 23.96 ± 1.49 | 15.49 ± 1.80 | Cerón-Guevara et al. (2020b) |
| 5.0 | Beef patty | 44.48 ± 8.30 | 0.59 ± 0.10 | 0.47 ± 0.05 | 21.08 ± 6.08 | 12.84 ± 5.65 | ||
| 2.5 | Beef frankfurter | 13.53 ± 2.26 | 0.59 ± 0.04 | 0.29 ± 0.03 | 3.99 ± 1.03 | 2.37 ± 0.75 | Cerón-Guevara et al. (2020a) | |
| 5.0 | Beef frankfurter | 10.84 ± 0.44 | 0.55 ± 0.02 | 0.31 ± 0.02 | 3.39 ± 0.26 | 1.87 ± 0.20 | ||
| 5.0 | Beef paste | 6516.58 ± 535.75 g | 0.83 ± 0.04 | 0.79 ± 0.03 | 5188.21 ± 437.75 g | 4508.99 ± 449.27 g.mm | Qing et al. (2021) | |
| P. sajor-caju | 0 | Commercial chicken nugget | 6.14 | 0.76 cm | 0.45 cm/cm | – | 2.05 N.cm | Husain and Huda-Faujan (2020) |
| 60 | Chicken nugget | 6.12 | 0.94 cm | 0.53 cm/cm | – | 3.06 N.cm | ||
| 50 | Chicken nugget | 5.81 | 0.9 cm | 0.46 cm/cm | – | 2.38 N.cm | ||
| 0 | Chicken frankfurter | 0.13 ± 0.01 kg | 1.39 ± 0.01 | 0.68 ± 0.04 | – | – | Rosli et al. (2015) | |
| 2 | Chicken frankfurter | 0.06 ± 0.01 kg | 1.41 ± 0.00 | 0.74 ± 0.48 | – | – | ||
| 4 | Chicken frankfurter | 0.08 ± 0.01 kg | 1.43 ± 0.01 | 0.74 ± 0.03 | – | – | ||
| 6 | Chicken frankfurter | 0.06 ± 0.00 kg | 1.42 ± 0.01 | 0.77 ± 0.01 | – | – | ||
| 0 | Beef patty | 22.96 + 1.82 kg | 0.35 + 0.06 | 0.46 + 0.02 | 8.06 + 0.90 kg | 2.87 + 0.79 kg.mm | Rosli et al., (2011) | |
| 25 | Beef patty | 13.20+ 1.07 kg | 0.36 + 0.04 | 0.37 + 0.04 | 4.75 + 0.61 kg | 1.72 + 0.41 kg.mm | ||
| 50 | Beef patty | 11.20+ 1.69 kg | 0.40 + 0.03 | 0.32 + 0.03 | 4.46 + 0.63 kg | 1.78 + 0.29 kg.mm | ||
| P. sapidus | 0 | Chicken sausage | 796 ± 133 | 1.05 ± 0.10 | 0.041 ± 0.010 | 310 ± 49 | 326 ± 64 | Stephan et al., (2018) |
| 100 | Mushroom sausage | 1,360 ± 116 | 0.98 ± 0.09 | 0.019 ± 0.008 | 392 ± 52 | 387 ± 72 | ||
| P. eryngii | 0 | Pork sausage | 116.17 ± 4.21 | 4.05 ± 0.53 | 0.58 ± 0.02 | 67.70 ± 1.28 | 281.20 ± 4.85 | Wang et al. (2019) |
| 25 | Pork sausage | 99.37 ± 1.95 | 3.82 ± 0.14 | 0.52 ± 0.08 | 54.10 ± 4.52 | 217.60 ± 7.96 | ||
| L. edodes | 0 | Pork frankfurter | 0.49 kg | 15.84 | 0.64 | 0.36 kg | 6.18 kg.mm | Pil-Nam et al. (2015) |
| 0.4 | Pork frankfurter | 0.49 kg | 15.86 | 0.8 | 0.58 kg | 9.47 kg.mm | ||
| 1.2 | Pork frankfurter | 0.42 kg | 18.5 | 1.67 | 0.73 kg | 10.51 kg.mm | ||
| 0 | Chicken nugget | 45.74 ± 1.49 | 5.27 ± 0.34 | 0.45 ± 0.08 | – | 97.63 ± 2.63 | Akesowan (2016) | |
| 1.84 | Chicken nugget | 38.65 ± 1.36 | 5.07 ± 0.15 | 0.41 ± 0.06 | – | 84.62 ± 2.84 | ||
| 0 | Pork sausage | 286.63 ± 13.19 | 4.34 ± 0.04 | 0.73 ± 0.03 | 195.60 ± 3.76 | 822.03 ± 33.43 | Wang et al. (2019) | |
| 25 | Pork sausage | 257.93 ± 11.55 | 4.08 ± 0.14 | 0.71 ± 0.06 | 184.70 ± 4.33 | 712.78 ± 32.10 | ||
| 50 | Pork sausage | 191.60 ± 12.04 | 3.84 ± 0.04 | 0.67 ± 0.03 | 164.60 ± 9.27 | 557.38 ± 45.56 | ||
| 75 | Pork sausage | 150.27 ± 19.75 | 3.47 ± 0.22 | 0.52 ± 0.05 | 144.33 ± 6.38 | 390.09 ± 14.36 | ||
| 100 | Mushroom sausage | 98.77 ± 10.55 | 2.80 ± 0.15 | 0.34 ± 0.04 | 100.83 ± 10.83 | 206.92 ± 20.20 | ||
| V. volvacea | 0 | Beef paste | 7549.01 ± 447.45 g | 0.94 ± 0.03 | 0.91 ± 0.01 | 6767.03 ± 581.61 g | 6520.57 ± 546 g.mm | Qing et al. (2021) |
| 5 | Beef paste | 6787.32 ± 157.88 g | 0.89 ± 0.02 | 0.83 ± 0.01 | 5596.72 ± 348.48 g | 5100.18 ± 351.28 g.mm | ||
| 0 | Pork sausage | 9948.0 ± 98.8 | 0.86 ± 0.02 cm | 0.78 ± 0.02 | – | 6920.4 ± 453.7 N.cm | Wang et al. (2018) | |
| 2 | Pork sausage | 8978.0 ± 121.9 | 0.79 ± 0.02 cm | 0.64 ± 0.01 | – | 5604.7 ± 283.7 N.cm | ||
| 4 | Pork sausage | 6108.3 ± 87.9 | 0.70 ± 0.08 cm | 0.49 ± 0.01 | – | 4937.4 ± 597.5 N.cm | ||
| H. marmoreus | 5 | Beef paste | 8940.93 ± 426.39 g | 0.91 ± 0.03 | 0.85 ± 0.02 | 7678.91 ± 437.56 g | 7184.82 ± 479.65 g.mm | Qing et al. (2021) |
Overall, while most studies indicated that mushroom addition reduces hardness and chewiness due to factors such as protease activity, water retention, and dietary fibre content, other research suggests that certain substitutions may result in a firmer texture due to changes in fat and protein levels. But there are also some cases where mushroom addition increases its physical characteristics.
The texture of meat analogues (plant-based or cultivated meat products made to imitate the texture of animal meat) is shaped by several factors, such as protease activity, water retention, and dietary fibre content (Dinalia et al., 2024). Proteases are enzymes that break down proteins into smaller peptides and amino acids. For meat analogues, protease activity can be utilised to change protein structure and enhance the textural qualities of the product. Proteases can assist in breaking down the protein matrix in plant-based meat analogues, resulting in a more fibrous and tender texture, which is preferred to imitate the muscle fibres found in animal meat. It improve the tenderization since the enzymatic breakdown of proteins can result in enhanced tenderness, which is particularly significant for products like plant-based steaks or chicken analogues that seek to copy the texture of actual meat (Mohd Azmi et al., 2023). Protease also improved mouthfeel with the mechanism of breakdown of larger protein molecules into smaller peptides can produce a smoother, more enjoyable mouthfeel that mimics the feel of real meat fibres.
Water retention is an important factor for getting the right texture and feel in meat alternatives. Water serves as a connector and adds to the product’s juiciness, which is a major feature of meat. Water retention affects the tenderness of the meat alternative. If the product can keep more water, it will look juicier and more like real meat. In many plant-based meats, like those made from soy or pea proteins, water retention is essential for creating a gel-like form. This gel resembles the connective tissues and muscle fibres found in animal meat. Good water retention helps limit moisture loss when cooking, which is vital for preserving texture. Meat alternatives that lose too much water during cooking can become dry and hard.
Dietary fibre in meat substitutes made from plants usually comes from sources like soy, peas, wheat, and various legumes or plant materials. Fibre is important in shaping how these products feel and taste. Dietary fibre can imitate the muscle fibres found in real meat. When mixed with proteins, it can create a structure that gives meat alternatives a chewiness or texture similar to that of animal meat (Dinalia et al., 2024). A high fibre level can also help create a more defined texture in the finished product, providing a sturdier consistency that stays intact during cooking. This is particularly vital for items like sausages or burger patties. Dietary fibre can attract water and help keep moisture, which impacts the juiciness and overall feel of the product.
The connection between these elements can greatly influence the final feel of meat substitutes.
Protease activity can break down proteins to create a softer texture, but too much might harm the product’s structure, resulting in a mushy feel. Water retention boosts juiciness and improves mouthfeel but requires balance to prevent too much moisture loss during cooking. Dietary fibre offers structural support and adds chewiness while also aiding in moisture retention and binding. Achieving the preferred texture in meat substitutes needs a careful balance of these elements. Protease activity can soften and improve protein structures, while water retention makes sure the final product stays juicy and tasty. Dietary fibre supports both the structural strength and the fibrous, chewy texture that closely mimics animal meat. The best mix of these parts relies on the specific type of meat substitute being created and the desired final features. In summary, it should be noted that high concentrations of mushrooms in meat analogues can significantly affect the texture. Excessive mushroom content may lead to a softer texture, which might not be desirable for all types of meat analogues.
To optimise consumer acceptance, meat analogues must mimic the colour and texture of conventional meat. This often requires the use of food additives, such as colour agents like lycopene and leghemoglobin, and binding agents such as wheat gluten to ensure structural stability and minimise cooking losses. Polysaccharides from native starches and flours also enhance texture and consistency, promoting a stable product structure. Food additive are widely used in the food business to make products more appealing to customers by improving their sensory features (like taste, texture, colour, and smell) and lengthening their shelf life as well in meat analogue (Dinalia et al., 2024). Some additives also aid in enhancing the nutritional quality of the products (Benković et al., 2023). Monosodium glutamate and yeast extract are usually used as flavour enhancer. For a sweetener, sugar and syrup as well the artificial sweetener are usually used. For the texturisers and stabilisers, several food additives were used based on the purposes. As an emulsifier: Lecithin, mono- and diglycerides, and polysorbates help mix ingredients such as oil and water, enhancing texture and uniformity in items like salad dressings, sauces, and ice cream. As a gelling agent, agar, pectin, and gelatine are used to make products like jams, jellies, gummies, and marshmallows thicker or gel-like. For the thickeners, starches (like corn starch) and gums (such as guar gum, xanthan gum) improve the texture of soups, sauces, and other liquid foods.
The impact of mushroom addition and/or substitution on organoleptic characteristics of meat analogues
This review collected data on the organoleptic characteristics of meat analogues from various studies employing hedonic tests in the assessment of taste, aroma, texture, colour, and overall acceptability. The score for each sensory attribute was scaled 5, 7, or 9 points, with higher scores indicating greater favourability. Results from the sensory evaluations are summarised in Table 5.
Effect of mushroom addition on organoleptic characteristic of meat analogues.
| Species | Amount (%) | Meat product | Taste | Aroma | Texture | Colour/appearance | Overall acceptance | References |
|---|---|---|---|---|---|---|---|---|
| A. bisporus | 0 | Sucuk beef sausageD | 6.81 ± 1.7 | 6.74 ± 2.1 | – | 8.18 ± 1.2 | 7.36 ± 1.0 | Gençcelep (2012) |
| 1 | Sucuk beef sausageD | 6.72 ± 1.9 | 6.45 ± 1.9 | – | 7.90 ± 1.0 | 6.45 ± 1.9 | ||
| 2 | Sucuk beef sausageD | 6.45 ± 1.6 | 6.54 ± 2.3 | – | 7.54 ± 1.0 | 6.45 ± 1.2 | ||
| 0 | Beef meatballa | 3.476 ± 1.364 | – | 3.952 ± 0.921 | 3.952 ± 1.071 | 3.476 ± 1.364 | Süfer et al. (2016) | |
| 5 | Beef meatballsA | 2.381 ± 1.203 | – | 3.095 ± 0.889 | 3.238 ± 0.944 | 2.714 ± 0.956 | ||
| 10 | Beef meatballsA | 2.762 ± 1.300 | – | 2.619 ± 1.071 | 1.666 ± 0.730 | 2.428 ± 0.870 | ||
| 0 | Beef pattyE | – | – | – | – | 10 | Kim et al. (2011) | |
| 27 | Beef pattyE | – | – | – | – | 5 | ||
| 0 | Beef sausagee | 4.70 | – | 4.85 | 5.50 | 4.75 | Al-Dalain (2018) | |
| 15 | Beef sausagee | 6.30 | – | 6.30 | 6.45 | 6.30 | ||
| 30 | Beef sausageE | 9.55 | – | 9.60 | 9.70 | 9.50 | ||
| 45 | Beef sausageE | 7.40 | – | 7.55 | 7.75 | 7.40 | ||
| 0 | Ground beefD | 6.15 ± 1.73 | 5.72 ± 1.63 | 4.98 ± 2.03 | 5.41 ± 1.91 | 5.70 ± 1.72 | Wong et al. (2019) | |
| 10 | Ground BeefD | 6.27 ± 1.76 | 6.08 ± 1.85 | 5.58 ± 2.21 | 6.27 ± 1.91 | 6.19 ± 1.74 | ||
| 20 | Ground beefD | 5.68 ± 1.79 | 5.04 ± 2.20 | 5.89 ± 2.02 | 4.43 ± 2.12 | 5.61 ± 1.81 | ||
| 30 | Ground beefD | 5.62 ± 2.38 | 5.54 ± 2.00 | 5.81 ± 2.02 | 4.27 ± 2.07 | 5.08 ± 2.43 | ||
| 20 | Chicken nuggetD | 6.75 | – | 7.05 | 7.35 | 6.95 | Akesowan and Jariyawaranugoon (2021) | |
| B. edulis | 0 | Beef frankfurterD | 6.40 ± 2.20 | 5.60 ± 2.40 | – | – | 6.20 ± 2.10 | Novakovic et al. (2020) |
| 0.75 | Beef frankfurterD | 6.50 ± 2.10 | 5.50 ± 2.30 | – | – | 6.30 ± 2.10 | ||
| 1.5 | Beef frankfurterD | 5.80 ± 2.70 | 5.00 ± 2.60 | – | – | 5.60 ± 2.50 | ||
| C. cibarius | 0 | Beef frankfurterD | 6.4 ± 2.2 | 5.6 ± 2.4 | – | – | 6.2 ± 2.1 | Novakovic et al. (2019) |
| 0.75 | Beef frankfurterD | 6.5 ± 2.1 | 6.1 ± 2.1 | – | – | 6.5 ± 2.1 | ||
| 1.5 | Beef frankfurterD | 7.1 ± 2.1 | 6.3 ± 2.2 | – | – | 6.9 ± 2.1 | ||
| F. velutipes | 0 | Pork sausageD | 4.64 | 4.27 | 4.36 | 6.45 | 4.55 | Choe et al. (2018) |
| 1 | Pork sausageD | 5.55 | 5.64 | 4.64 | 6.18 | 5.46 | ||
| 2 | Pork sausageD | 3.55 | 3.55 | 2.82 | 5.64 | 3.36 | ||
| 0 | Goat sausageC | 6.84 ± 0.10 | – | 6.88 ± 0.13 | 7.03 ± 0.12 | 6.87 ± 0.14 | Banerjee et al. (2020) | |
| 4 | Goat sausageC | 6.86 ± 0.16 | – | 7.01 ± 0.10 | 7.00 ± 0.14 | 6.98 ± 0.18 | ||
| 6 | Goat sausageC | 6.80 ± 0.14 | – | 6.96 ± 0.14 | 6.94 ± 0.12 | 6.84 ± 0.20 | ||
| 0 | Chicken sausageD | 6.04 | 6 | 6 | 5.26 | 5.96 | Jo et al. (2018) | |
| 1 | Chicken sausageD | 5.41 | 5.48 | 6.15 | 5.22 | 5.59 | ||
| P. ostreatus | 5 | Beef meatballA | 2.905 ± 0.889 | – | 3.476 ± 0.872 | 4.142 ± 0.853 | 3.381 ± 1.071 | Süfer et al. (2016) |
| 10 | Beef meatballA | 2.857 ± 1.108 | – | 3.190 ± 1.123 | 2.238 ± 0.995 | 2.809 ± 0.981 | ||
| 20 | Tempeh sausageF | 63 | 80 | 70 | 77 | 93 | Ambari et al. (2014) | |
| 30 | Tempeh sausageF | 53 | 77 | 53 | 70 | 77 | ||
| 40 | Tempeh sausageF | 67 | 73 | 53 | 73 | 83 | ||
| 50 | Tempeh sausagF | 57 | 73 | 63 | 73 | 83 | ||
| 0 | Beef pattyE | 8.6 ± 0.48 | 8.7 ± 0.68 | 8.23 ± 0.7 | 8.53 ± 0.49 | 8.1 ± 0.58 | El-Refai et al. (2014) | |
| 4 | Beef pattyE | 8.75 ± 0.5 | 8.95 ± 0.76 | 8.7 ± 0.79 | 8.93 ± 0.77 | 8.63 ± 0.56 | ||
| 8 | Beef pattyE | 8.8 ± 0.616 | 8.9 ± 0.384 | 8.3 ± 0.834 | 8.8 ± 0.616 | 8.5 ± 0.607 | ||
| 12 | Beef pattyE | 8.7 ± 0.62 | 8.8 ± 0.62 | 8.1 ± 0.7 | 8.6 ± 0.67 | 8.4 ± 0.88 | ||
| P. eryngii | 0 | Chicken burgerE | 8.5 | – | 7.5 | – | 8 | Dosh et al. (2016) |
| 10 | Chicken burgerE | 9 | – | 8.5 | – | 9 | ||
| 15 | Chicken burgeE | 8.25 | – | 9.5 | 9.5 | |||
| P. sajor-caju | 0 | Beef pattyB | 4.31 ± 1.07 | – | – | 3.92 ± 0.94 | 4.80 ± 1.07 | Rosli et al. (2012) |
| 25 | Beef pattyB | 4.15 ± 1.16 | – | – | 3.97 ± 1.03 | 4.93 ± 1.00 | ||
| 50 | Beef patty B | 3.85 ± 1.04 | – | – | 3.92 ± 1.16 | 4.08 ± 1.10 | ||
| 0 | Chicken pattyB | 4.50 ±0.53 | 4.38 ±0.52 | – | 4.63 ±0.52 | 4.63 ±0.52 | Rosli et al. (2011) | |
| 25 | Chicken pattyB | 4.63 ±0.74 | 4.30 ±0.87 | – | 4.56 ±0.64 | 4.48 ±0.85 | ||
| 50 | Chicken pattyB | 4.67 ±0.69 | 4.52 ±0.68 | – | 4.40 ±0.77 | 4.63 ±0.67 | ||
| L. edodes | 0 | Beef burgerD | 7.82 ±1.25 | 7.33 ±1.20 | 7.14 ±1.65 | 7.40 ±1.31 | 7.61 ±1.18 | Mattar et al. (2018) |
| 5 | Beef burgerD | 7.24 ±1.46 | 7.01 ±1.33 | 6.96 ±1.44 | 7.21 ±1.29 | 7.11 ±1.42 | ||
| 20 | Beef burgerD | 7.62 ±1.24 | 7.23 ±1.23 | 6.94 ±1.69 | 7.21 ±1.37 | 7.46 ±1.16 | ||
| 0 | Pork frankfurterB | 3.72 | 3.61 | 4.56 | – | 3.78 | Pil-Nam et al. (2015) | |
| 0.4 | Pork frankfurterB | 4.33 | 4.39 | 4.66 | – | 4.39 | ||
| 1.2 | Pork frankfurterB | 5.17 | 5.22 | 4.67 | – | 5.11 | ||
| Tremella fuciformis | 0 | Pork pattyB | 3.54 ± 1.95 | – | 4.45 ± 2.00 | 3.46 ± 1.75 | 3.68 ± 1.94 | Cha et al. (2014) |
| 10 | Pork pattyB | 5.02 ± 1.53 | – | 5.09 ± 2.10 | 4.81 ± 1.70 | 5.73 ± 0.94 | ||
| 20 | Pork pattyB | 3.61 ± 2.04 | – | 4.31 ± 1.88 | 4.24 ± 2.07 | 4.88 ± 1.94 | ||
| 30 | Pork pattyB | 4.45 ± 1.16 | – | 4.74 ± 1.68 | 4.81 ± 1.87 | 4.03 ± 1.59 |
Note. Scale A(1–5), B(1–7), C(1–8), D(1–9), E(1–10), and F(1–100). 1 indicates the least favourable and the highest value is the most favourable.
Gençcelep (2012) evaluated beef sausage with 1% A. bisporus, reporting lower ratings for taste, aroma, colour, and overall acceptability compared to the control sample. In contrast, Al-Dalain (2018) found that beef sausage with 15% A. bisporus received higher scores for these parameters, indicating that greater substitution levels improved sensory ratings. Novakovic et al. (2020) noted that adding 0.75% B. edulis improved taste, colour, and overall acceptability, while 1.5% decreased these parameters.
The addition of 1.5% C. cibarius to frankfurter beef sausage led to improved taste, aroma, and overall acceptability (Novakovic et al., 2019). Choe et al. (2018) found that 6% F. velutipes reduced sensory scores, while 4% improved taste, texture, and overall acceptance, though colour ratings decreased. El-Refai et al. (2014) observed increased sensory scores for beef patties with 4%, 8%, and 12% Pleurotus ostreatus. Dosh et al. (2016) noted that 15% P. eryngii improved flavour parameters, while 10% decreased them.
Rosli et al. (2011) found that substituting chicken patties with 25% Pleurotus sajor-caju improved taste but decreased aroma, colour, and overall acceptance. At 50% substitution, taste and aroma scores increased, while colour and overall acceptance were similar to control values. Mattar et al. (2018) reported that adding 5% and 20% L. edodes decreased sensory scores compared to controls. Cha et al. (2014) found that substituting pork patties with 10%, 20%, and 30% T. fuciformis improved taste, colour, and overall acceptability.
Overall, these studies indicated that mushroom addition or substitution can either enhance or diminish the organoleptic characteristics of meat analogues. Improvements in flavour may be attributed to the high levels of free amino acids in mushrooms, which contribute to umami, sweet, and bitter flavours (Das et al., 2021). Certain amino acids in mushrooms mimic the taste of monosodium glutamate, enhancing the flavour profile (Cheung, 2009). The original colour of mushrooms also influences the colour of meat analogues, making them more appealing to consumers.
Mushrooms, which have higher water content, can affect texture, leading to a softer consistency (Kotwaliwale et al., 2007; Rosli et al., 2011). The dietary fibre in mushrooms can weaken protein–protein gel bonds, reducing the gel strength of meat analogues (Wang et al., 2019). These characteristics contribute to the consumer preference for meat analogues over conventional meat. Additionally, the aroma of meat analogues is linked to amino acid content, which influences the formation of volatile compounds through the Maillard reaction (Pérez-Palacios et al., 2015). The protease activity in mushrooms degrades meat proteins, increasing free amino acids (Kang et al., 2012; Wang et al., 2019). Thus, mushrooms significantly impact the organoleptic properties of meat analogues in terms of colour, taste, aroma, texture, and overall acceptability. However, if the concentration is too high, it may overpower other flavours and result in a product that tastes predominantly like mushrooms. Balancing the mushroom content with other flavourings and seasonings is essential to achieve a well-rounded flavour profile.
The impact of mushroom addition and/or substitution on amino acid profile of meat analogues
Amino acids significantly influence the physical, chemical, and sensory qualities of meat (Choe et al., 2018; Jo et al., 2018; Wang et al., 2019). The flavour of conventional meat primarily arises from compounds like free amino acids, free fatty acids, nucleotides, and reducing sugars, with additional contributions from myoglobin and vitamin B1 (Mottram, 1998). Amino acids also offer health benefits. For example, lysine supports the central nervous system and immunity (Chau et al., 1989; Wu et al., 2022) and cysteine aids in tissue repair (Pintado et al., 2018; Wang et al., 2019).
The essential and non-essential amino acid from meat products incorporated with different species of mushroom was profiled and presented in Tables 6 and 7, respectively. Cerón-Guevara et al. (2020b) tested beef sausage with 2.5% and 5.0% A. bisporus, finding that both concentrations increased all essential amino acid levels. However, the 2.5% addition decreased non-essential amino acids like serine, proline, cysteine, and histidine, while the 5.0% addition increased all non-essential amino acids. Conversely, Al-Dalain (2018) reported that a 30% substitution of A. bisporus in beef sausage decreased levels of some essential amino acids, including lysine, as well as several non-essential amino acids.
Effect of mushroom addition on the essential amino acid profile of meat analogues (g/100 g).
| Species | Amount (%) | Meat product | Threonine | Lysine | Valine | Leucine | Phenylalanine | Methionine | Isoleucine | References |
|---|---|---|---|---|---|---|---|---|---|---|
| A. bisporus | 0 | Beef frankfurter | 0.73 ± 0.08 | 1.45 ± 0.20 | 0.91 ± 0.14 | 1.35 ± 0.24 | 0.69 ± 0.10 | 0.40 ± 0.05 | 0.81 ± 0.15 | Cerón-Guevara et al. (2020b) |
| 2.5 | Beef frankfurter | 0.73 ± 0.03 | 1.50 ± 0.04 | 0.89 ± 0.04 | 1.33 ± 0.09 | 0.67 ± 0.06 | 0.40 ± 0.01 | 0.80 ± 0.05 | ||
| 5.0 | Beef frankfurter | 0.78 ± 0.04 | 1.54 ± 0.12 | 0.96 ± 0.12 | 1.41 ± 0.19 | 0.73 ± 0.08 | 0.41 ± 0.10 | 0.85 ± 0.12 | ||
| 0 | Beef Sausage | 2 | 9.89 | 3.7 | 5.5 | 3.2 | 0.49 | 2.2 | Al-Dalain (2018) | |
| 30 | Beef Sausage | 2.45 | 9.8 | 4.35 | 5.72 | 3.41 | 1.11 | 3.01 | ||
| P. ostreatus | 2.5 | Beef frankfurter | 0.71 ± 0.02 | 1.46 ± 0.01 | 0.90 ± 0.06 | 1.31 ± 0.08 | 0.67 ± 0.04 | 0.38 ± 0.01 | 0.79 ± 0.04 | Cerón-Guevara et al. (2020a) |
| 5.0 | Beef frankfurter | 0.72 ± 0.12 | 1.38 ± 0.28 | 0.92 ± 0.24 | 1.31 ± 0.32 | 0.69 ± 0.13 | 0.42 ± 0.09 | 0.79 ± 0.19 | ||
| A. bisporus and P. ostreatus | 2.5/2.5 | Beef frankfurter | 0.80 ± 0.07 | 1.53 ± 0.22 | 0.98 ± 0.04 | 1.43 ± 0.06 | 0.73 ± 0.01 | 0.48 ± 0.06 | 0.87 ± 0.04 | |
| F. velutipes | 0 | Pork sausage | – | 0.042 ± 0.023 | 0.025 ± 0.01 | 0.033 ± 0.02 | 0.020 ± 0.01 | 0.012 ± 0.018 | 0.020 ± 0.063 | Wang et al. (2019) |
| 2.5 | Pork sausage | – | 0.15 ± 0.006 | 0.081 ± 0.03 | 0.12 ± 0.03 | 0.082 ± 0.03 | 0.04 ± 0.01 | 0.060 ± 0.02 | ||
| 5.0 | Pork sausage | – | 0.22 ± 0.01 | 0.12 ± 0.06 | 0.18 ± 0.09 | 0.12 ± 0.05 | 0.06 ± 0.03 | 0.09 ± 0.03 | ||
| L. edodes | 0 | Pork sausage | 1.63 ± 0.03 | 0.96 ± 0.03 | 2.04 ± 0.04 | 7.30 ± 0.09 | 3.79 ± 0.09 | 0.60 ± 0.02 | 4.31 ± 0.02 | Wang et al. (2019) |
| 25 | Pork sausage | 1.32 ± 0.10 | 0.84 ± 0.04 | 1.85 ± 0.05 | 6.86 ± 0.10 | 3.76 ± 0.06 | 1.26 ± 0.06 | 4.52 ± 0.04 | ||
| 50 | Pork sausage | 1.15 ± 0.08 | 0.75 ± 0.03 | 1.65 ± 0.04 | 6.68 ± 0.09 | 4.17 ± 0.03 | 1.91 ± 0.08 | 4.65 ± 0.10 | ||
| 75 | Pork sausage | 0.54 ± 0.10 | 0.81 ± 0.03 | 1.55 ± 0.02 | 6.58 ± 0.08 | 4.15 ± 0.05 | 3.07 ± 0.07 | 4.57 ± 0.07 | ||
| 100 | Mushroom sausage | 0.52 ± 0.05 | 0.54 ± 0.01 | 1.23 ± 0.06 | 6.43 ± 0.10 | 3.00 ± 0.04 | 7.31 ± 0.08 | 4.18 ± 0.12 | ||
| 0 | Chicken nugget | 1.23 ± 0.02 | 2.07 ± 0.04 | 1.114 ± 0.033 | 2.17 ± 0.03 | 1.07 ± 0.07 | 0.07 ± 0.02 | 1.71 ± 0.029 | Akesowan (2016) | |
| 1.84 | Chicken nugget | 1.31 ± 0.02 | 2.09 ± 0.03 | 1.36 ± 0.05 | 3.06 ± 0.056 | 1.30 ± 0.045 | 0.82 ± 0.031 | 1.32 ± 0.04 | ||
| P. eryngii | 0 | Pork sausage | 1.76 ± 0.10 | 1.04 ± 0.09 | 2.19 ± 0.08 | 7.85 ± 0.09 | 3.24 ± 0.13 | 2.07 ± 0.09 | 4.63 ± 0.17 | Wang et al. (2019) |
| 25 | Pork sausage | 0.45 ± 0.03 | 0.95 ± 0.05 | 0.57 ± 0.05 | 7.35 ± 0.12 | 3.04 ± 0.11 | 5.10 ± 0.15 | 4.23 ± 0.03 |
Comparison of beef and several mushrooms’ species in amino acid profile (g/100 g).
| Amino acid profile | Beef | L. edodes | P. ostreatus | F. velutipes | A. bisporus |
|---|---|---|---|---|---|
| Threonine* | 0.829 | 0.4 | 0.38 | 0.88 | 0.36 |
| Lysine* | 1.78 | 0.56 | 1.18 | 1.75 | 1.09 |
| Valin* | 1.05 | 0.80 | 0.42 | 0.81 | 0.68 |
| Leucine* | 1.67 | 0.72 | 1.23 | 1.29 | 1.20 |
| Phenylalanine* | 0.836 | 0.18 | 0.25 | 0.82 | 0.19 |
| Methionine* | 0.551 | 0.29 | 0.26 | 0.58 | 0.22 |
| Isoleucine* | 0.947 | 0.48 | 1.02 | 1.35 | 1.37 |
| Arginine | 1.4 | 0.27 | 0.23 | 1.45 | 0.74 |
| Aspartic acid | 1.93 | 1.56 | 0.87 | 1.91 | 1.92 |
| Serin | 0.858 | 0.35 | 0.26 | 0.79 | 0.62 |
| Glutamic acid | 3.21 | 1.29 | 0.98 | 3.15 | 1.06 |
| Proline | 1.09 | 0.47 | 0.54 | 1.38 | 0.69 |
| Glycine | 1.45 | 0.60 | 0.47 | 0.91 | 0.56 |
| Alanin | 1.34 | 0.84 | 0.62 | 1.19 | 0.77 |
| Tyrosine | 0.659 | 0.31 | 0.65 | 0.73 | 0.28 |
| Cysteine | 0.221 | 0.21 | 0.18 | 0.23 | 0.14 |
| Histidine | 0.696 | 0.26 | 0.27 | 0.62 | 0.17 |
*Essential amino acids.
Source: USDA (2018) and Wang and Zhao (2023).
In another study by Cerón-Guevara et al. (2020a), a 5.0% addition of P. ostreatus to beef frankfurter led to decreased levels of essential amino acids such as threonine, lysine, leucine, and isoleucine, while valine and phenylalanine increased. There was also an increase in several non-essential amino acids compared to the control. Additionally, the combination of 2.5% P. ostreatus and 2.5% A. bisporus resulted in increased levels of all essential amino acids and most non-essential amino acids, except proline.
Wang et al. (2019) investigated F. velutipes in pork sausage, finding that 2.5% and 5.0% additions increased all amino acid levels. A study by Wang et al. (2019) showed that substituting pork sausage with L. edodes at varying percentages generally reduced essential amino acids like threonine and lysine, although methionine levels increased with higher substitution. L. edodes substitution also stabilised levels of certain essential and non-essential amino acids. Wang et al. (2019) found that adding 25% P. eryngii to pork sausage decreased almost all essential and non-essential amino acid levels, except for methionine and cysteine.
The data in Tables 6 and 7 illustrated that mushroom addition or substitution can lead to change in amino acid profile in meat analogues. The variation in amino acid levels was influenced by the production methods used. It was observed that substitution often results in decreased amino acids, while addition tends to increase them. This is due to differences in amino acid profiles between meat and various mushroom species, with beef typically containing higher levels of essential and non-essential amino acids than mushrooms like L. edodes and P. ostreatus.
Beyond production methods, the proteolytic enzymes present in mushrooms also alter amino acid content by breaking down meat proteins (Wang et al. (2019)). For example, edible Pleurotus citrinopileatus mushrooms contain alkaline protease, which enhances protein conversion to amino acids (Cui et al., 2007). Likewise, Wang et al. (2019) found that adding P. eryngii significantly increased free amino acid content in sausage. The addition of mushrooms markedly impacts the free amino acid profiles of meat analogues, primarily due to the abundance of proteolytic enzymes that hydrolyse meat proteins, releasing free amino acids (Sun et al., 2020; Wang et al., 2018). Thus, the endogenous enzymes in mushrooms may significantly contribute to the increased levels of free amino acids in meat analogues.
The impact of mushroom addition and/or substitution on dietary fibre of meat analogues
The data on dietary fibre of meat analogues from various studies were presented in Table 8. Generally, the total dietary fibre content in meat analogues increased with higher levels of mushroom addition or substitution. For example, substituting chicken meat with 2%, 4%, and 6% P. sajor-caju powder raised the dietary fibre content to 6.20%, compared to just 0.08% in control chicken frankfurter (Rosli et al., 2015).
Effect of mushroom addition and/or substitution on dietary fibre content of meat analogues.
| Species | Amount (%) | Meat product | Dietary fibre (%) | References |
|---|---|---|---|---|
| A. bisporus | 0 | Beef frankfurter | 0.05 ± 0.09 | Cerón-Guevara et al. (2020a) |
| 2.5 | Beef frankfurter | 0.57 ± 0.06 | ||
| 5.0 | Beef frankfurter | 1.14 ± 0.09 | ||
| F. velutipes | 0 | Goat sausage | 0.82 ± 0.06 | Banerjee et al., (2020) |
| 4 | Goat sausage | 1.42 ± 0.06 | ||
| 6 | Goat sausage | 1.72 ± 0.04 | ||
| P. ostreatus | 2.5 | Beef frankfurter | 1.09 ± 0.11 | Cerón-Guevara et al. (2020b) |
| 5.0 | Beef frankfurter | 2.18 ± 0.25 | ||
| 0 | Tempeh sausage | 7.35 | Ambari et al. (2014) | |
| 20 | Tempeh sausage | 7.64 | ||
| P. sajor-caju | 20 | Fish sausage | 1.58 | Yuliantini and Kamsiah (2019) |
| 0 | Beef patty | 3.90 ± 0.08 | Rosli et al. (2012) | |
| 25 | Beef patty | 7.00 ± 0.05 | ||
| 50 | Beef patty | 9.95 ± 0.04 | ||
| 0 | Chicken frankfurter | 0.08 ± 0.01 | Rosli et al. (2015) | |
| 2 | Chicken frankfurter | 0.80 ± 0.13 | ||
| 4 | Chicken frankfurter | 3.03 ± 0.15 | ||
| 6 | Chicken frankfurter | 6.20 ± 0.30 | ||
| 0 | Beef patty | 1.90 ± 0.08 | Rosli et al. (2011) | |
| 25 | Beef patty | 3.40 ± 0.05 | ||
| 50 | Beef patty | 4.90 ± 0.04 | ||
| P. eryngii | 0 | Pork sausage | 0 | Wang et al. (2019) |
| 25 | Pork sausage | 0.40 ± 0.03 | ||
| L. edodes | 0 | Pork sausage | 0 | Wang et al. (2019) |
| 25 | Pork sausage | 0.04 | ||
| 50 | Pork sausage | 0.08 | ||
| 75 | Pork sausage | 1.32 | ||
| 100 | Mushroom sausage | 1.76 | ||
| 0 | Chicken nugget | 0.37 ± 0.05 | Akesowan (2016) | |
| 1.84 | Chicken nugget | 1.80 ± 0.10 | ||
| A. bisporus and P. ostreatus | 2.5:2.5 | Beef frankfurter | 1.58 ± 0.17 | Cerón-Guevara et al. (2020a) |
Similar results were observed with other mushroom species, such as A. bisporus, F. velutipes, P. ostreatus, P. eryngii, and L. edodes, indicating that mushroom incorporation generally enhances the level of dietary fibre in meat analogues. The increase in dietary fibre could be attributed to the polysaccharides, oligosaccharides, lignin, and other components found in mushrooms, primarily consisting of insoluble dietary fibre like chitin and β-glucan, while soluble dietary fibre typically makes up less than 10% (dry basis) (Zhao et al., 2022).
The dietary fibre is concentrated in the mushroom stem and cap, with stems generally containing higher fibre levels. For instance, L. edodes has a β-glucan content of 25.31 g/100 g in the stem compared to 19.78 g/100 g in the cap (Zhao et al., 2022). Fibre was also found in the mycelium and sclerotium, with sclerotium exhibiting higher non-digestible carbohydrate levels. Sclerotium, a hardened mass of mushroom mycelium, serves as a food reserve (Dai et al., 2021).
In contrast, sausage products without mushrooms, such as beef frankfurters, contain only 0.05% dietary fibre, as beef itself has no dietary fibre (USDA, 2018). The minimal dietary fibre in beef frankfurter likely arises from other ingredients, such as potato starch (Cerón-Guevara et al., 2020b). Thus, all meat analogues that include mushrooms show enhanced dietary fibre content.
Mushrooms’ high nutritional value makes them suitable for producing therapeutic foods aimed at improving the nutritional status of undernourished children suffering from stunting (Fetriyuna et al., 2021). Additionally, combining mushrooms with other local food sources and underutilised commodities could diversify food products.
The impact of mushroom addition and/or substitution on oil, water holding capacity, cooking loss, and storage stability of meat analogues
Incorporating mushrooms into meat analogues can significantly influence their oil and water holding capacities, as well as cooking loss. Mushrooms are rich in dietary fibres and bioactive compounds, which enhance the functional properties of meat substitutes.
The addition of mushrooms has been shown to improve the fat retention in meat products. For instance, incorporating white jelly mushroom (T. fuciformis) into pork patties significantly increased their oil retention. Mushrooms enhance the WHC of meat analogues due to their high fibre content, which binds water effectively. Studies have demonstrated that adding mushroom powder to meat products increases their WHC, leading to improved juiciness and texture. For example, the inclusion of enoki mushroom (F. velutipes) stem wastes into goat meat nuggets resulted in higher WHC (Das et al., 2021).
Reducing cooking loss is crucial for maintaining the quality and yield of meat analogues. Mushroom incorporation has been found to decrease cooking loss in various meat products. In one study, replacing animal fat with A. bisporus in beef burgers led to reduced cooking loss and diameter reduction, resulting in juicier and more tender products. In summary, the addition of mushrooms to meat analogues can enhance oil and water holding capacities while reducing cooking loss, thereby improving the overall quality and sensory attributes of the final product (Patinho et al., 2021).
Effect of mushroom addition and/or substitution on dietary fibre content of meat analogues.
| Ingredients | Function | Examples |
|---|---|---|
| Protein sources | Provide structure and nutritional content | Mushroom, Soy protein, pea protein, wheat gluten |
| Binders | Improve texture and binding | Methylcellulose, carrageenan, agar |
| Fats | Enhance mouthfeel and flavour | Coconut oil, canola oil, sunflower oil |
| Fibres | Improve texture and water holding capacity | Inulin, oat fibre, bamboo fibre |
| Flavourings | Enhance taste and aroma | Yeast extract, soy sauce, spices |
| Colourings | Provide meat-like appearance | Beet juice, caramel colour, paprika |
| Moisture retainers | Maintain juiciness | Glycerin, propylene glycol |
| Antioxidants | Improve shelf life and stability | Ascorbic acid, tocopherols |
| Preservatives | Extend shelf life | Sodium nitrite, potassium sorbate |
Incorporating mushrooms into meat analogues can enhance their storage stability by leveraging the natural antioxidant and antimicrobial properties of mushrooms. Mushrooms are rich in phenolic compounds and other antioxidants that can inhibit lipid oxidation in meat products. For instance, a study on chevon (goat meat) nuggets found that adding mushroom extract significantly increased total phenolic content and DPPH radical scavenging activity, leading to lower peroxide and thiobarbituric acid reactive substances (TBARS) values during refrigerated storage. This suggests that mushroom extracts can effectively retard oxidative deterioration in meat products.
The same study observed that mushroom extract incorporation did not significantly affect the pH, water activity, or sensory characteristics of the nuggets. However, microbial proliferation was significantly restricted during storage in the treated samples, indicating that mushroom extracts can enhance microbial stability without compromising product quality (Verma et al., 2023).
Ingredients used in plant-based meat analogues
Plant-based meat analogues are designed to mimic the taste, texture, and appearance of conventional meat using vegetarian or vegan ingredients. These products are becoming increasingly popular as consumers seek more sustainable and healthy protein sources. The nutritional profile of meat analogues is largely determined by the protein sources used (Benković et al., 2023). These proteins not only provide the necessary nutrients but also contribute to the overall protein content of the product, ensuring it meets dietary requirements.
The texture of meat analogues is a critical factor in consumer acceptance. Binders like methylcellulose and carrageenan contribute to achieve a fibrous meat-like texture. These ingredients help in forming a cohesive structure that holds together during cooking and consumption. Fats, for instance, coconut oil and canola oil are added to improve mouthfeel, providing a juicy and tender texture similar to that of conventional meat. The use of fibres also contributes to the texture by enhancing water holding capacity, which helps in maintaining moisture and juiciness (Benković et al., 2023).
Flavourings and colourings play a crucial role in creating sensory experience that closely resembles meat. Yeast extract, soy sauce, and various spices are used to develop a savoury, umami flavour profile that is appealing to consumers (Vila-Clarà et al., 2024). But, in this case, mushroom could also play that role due to its unique sensory properties.
Colourings like beet juice and caramel colour are added to help create a more authentic and appetising look, therefore give the product a meat-like appearance, which is important for visual appeal. Moisture retainers such as glycerin help in maintaining juiciness, ensuring that the product does not become dry during cooking (Benković et al., 2023). Antioxidants and preservatives are included to enhance shelf life and stability, ensuring that the product remains fresh and safe for consumption over time (Kyriakopoulou et al., 2021).
The maximum concentration of mushroom addition in meat analogues can vary depending on the specific formulation and desired properties of the final product. However, excessive mushroom content may lead to an undesirable characteristic. The balance between mushroom content and other binding agents is crucial to maintain the desired texture. In summary, while mushrooms can greatly enhance the texture, chewiness, flavour, and taste of meat analogues, it is crucial to find the optimal concentration that balances these attributes without overpowering the product.
Conclusion
This systematic review highlights the potential of mushrooms as an effective ingredient in plant-based meat analogues, providing both nutritional and sensory benefits. The studies reviewed indicate that the inclusion or substitution of mushrooms, such as A. bisporus, P. ostreatus, L. edodes, and others, generally enhances the nutritional profile of meat analogues, particularly by increasing dietary fibre and essential amino acid content. These mushrooms contribute valuable dietary fibre and unique amino acids, offering health benefits beyond conventional meat. Additionally, mushrooms enhance umami flavour and contribute to desired textural properties, though variations in texture such as hardness and chewiness depend on the mushroom type and concentration used. Moreover, other ingredients that used in meat analogues could also impact its final characteristics.
The sensory evaluation of mushroom-based meat analogues shows mixed results: while some formulations improve taste and texture, others require optimization to match consumer expectations of conventional meat. Factors like colour and texture can vary depending on mushroom species, preparation, and the presence of binding agents, indicating a need for balanced formulations that enhance resemblance to traditional meat. Innovations in processing, such as the use of binding agents like wheat gluten and additives like lycopene, further improve the organoleptic qualities, making mushroom-based analogues a more attractive option for consumers.
Incorporating mushrooms into meat analogues significantly influences their oil content, water-holding capacity, cooking loss, and storage stability. Mushrooms improve fat retention and enhance water-holding capacity due to their high fibre content, leading to juicier and more palatable products. They also reduce cooking loss, maintaining the quality and yield of meat analogues. Furthermore, the natural antioxidant and antimicrobial properties of mushrooms enhance the storage stability of meat analogues, inhibiting lipid oxidation and microbial growth, thereby extending shelf life.
In conclusion, mushrooms provide a sustainable and nutritionally rich alternative for meat analogues, though further research on optimal processing techniques and combinations with other plant ingredients could enhance their acceptance in the market. Their contribution to dietary fibre, amino acids, and unique sensory properties underscores their value in developing healthier, more sustainable meat substitutes. Progress in the market for meat alternatives derived from mushrooms is being hampered by a lack of standardised processes and inadequate regulatory frameworks. To enhance nutrition, flavour, and texture, more research is required. There are still issues with texture, flavour, scalability, and nutrition for wider acceptance and commercial success, despite their promise in sustainability, umami flavour, and health benefits. Further research and experimentation may be necessary to determine the ideal mushroom concentration for specific formulations and consumer preferences.
Data availability
Data are available within the article or its supplementary materials.
Author contributions
Fetriyuna Fetriyuna (Conceptualization, Data curation, Methodology, Supervision, Validation, Writing—original draft, Writing—review & editing), Afif Ziyadi Rafi (Conceptualization, Data curation, Formal analysis, Investigation, Methodology, Validation, Visualisation, Writing—original draft, Writing—review & editing), Zaida Zaida (Methodology, Supervision, Validation, Writing—review & editing), Ratna Chrismiari Purwestri (Validation, Writing—review & editing), and Adi Md Sikin (Validation, Writing—review & editing). All authors have read and agreed to the published version of the manuscript.
Funding
This research received no external funding and the Article Processing Charge (APC) was funded by Universitas Padjadjaran, Indonesia.
Conflicts of interest
The authors declare no conflict of interest.
Acknowledgements
The authors thank Dr. Putri Widyanti Harlina for valuable advice on systematic review and analysis.
