


Abstract
The food security of many sub-Saharan African countries is deteriorating, with the challenges of today further exacerbating this development. Against this backdrop, new and unconventional foods need to be identified that are characterized by their properties as potential solutions. One such interesting option is the baobab tree, whose components (such as the fruit, leaves, and seeds) are already used in many different forms. This review aims to shed light on the characteristics of the baobab tree and the possible applications and composition of its components. The seeds of the baobab tree have been of particular interest, as well as the oil they contain.
Introduction
Current status of food insecurity in Africa
Food insecurity is high in many sub-Saharan African countries and is worsening in the face of global crises, such as climate change, the COVID-19 pandemic, and the Ukraine war (Saeed et al., 2023). Extreme climate fluctuations will have a strong negative impact on harvests in Africa, with harvests forecasted to fall 50% by 2030 and 90% by 2100 (Pickson & Boateng, 2022). Simultaneously, a connection between the increase in civil wars in Africa and climate change has been observed, which means that these could occur more frequently as climate change progresses (Burke et al., 2009; Pickson & Boateng, 2022). In addition, consequences of climate change such as droughts and desertification and the conflicts also contribute to urbanization, which reduces people’s self-sufficiency, and makes them more dependent on buying food (Saeed et al., 2023).
A total of 282 million people in Africa are undernourished, which represents 20% of the population (African Union et al., 2023). In particular, 38 African countries are affected by food insecurity, with the most threatened countries, such as the Democratic Republic of Congo, Nigeria, Ethiopia, Sudan, and South Sudan being characterized by domestic conflicts (see Figure 1). Civil wars such as the one in Sudan lead to a high number of refugees and worsening food crises, so that 39% of the Sudanese population is affected by food insecurity, e.g., while in South Sudan, it is already 60% of the population (Laurent et al., 2024; Saeed et al., 2023).
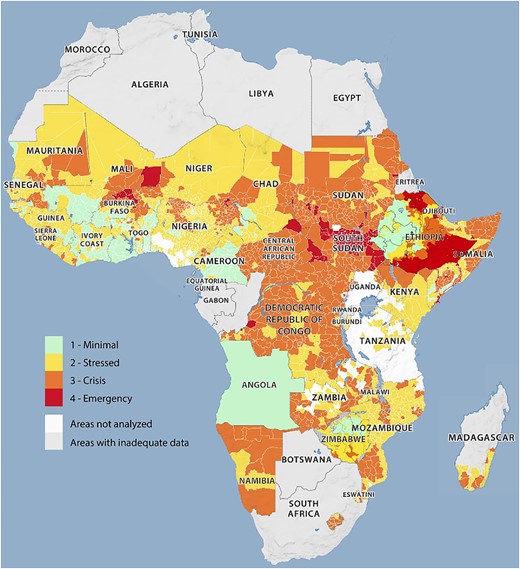
Acute food insecurity in Africa (Africa Center for Strategic Studies, 2023).
These correlations lead to the conclusion that further progression of climate change will also increase the frequency of civil wars, which in turn will have a negative impact on food security. This is further exacerbated by the fact that harvests in Africa will fall sharply due to climate change. In order to achieve the first and second goals of the Sustainable Development Goals “No Poverty” and “No Hunger” despite these developments and to ensure food security, new and unconventional food sources are therefore being researched (Osman, 2004). One such source is non-forest plant species, which are more resistant to climatic fluctuations and can thus stabilize food systems and the livelihoods of many people (Saeed et al., 2023). In this context, the baobab tree is an interesting source of food due to its versatility and nutritious composition. For many inhabitants, it represents both an important source of income and an important source of energy and nutrients, such as vitamins, minerals and proteins, and could help to increase food security and promote rural development (Ofori & Addo, 2023).
Characteristics of the baobab tree
The baobab tree (Adansonia digitata L., Malvaceae), also known by other names, such as “chemist tree,” “arbre a palabre,” “dead-rat tree,” or “monkey bread of Africa,” is a tree found mainly in sub-Saharan Africa (Asogwa et al., 2021; Kamatou et al., 2011; Monteiro et al., 2022). Due to its height of up to 25 m and its diameter of up to 12 m, it is considered the largest succulent plant in the world and is therefore easily recognizable by its massive trunk (see Figure 2) (Cissé et al., 2018; Kamatou et al., 2011). In addition, the mature baobab tree produces 160–250 fruits per year, which probably gave it its name after the Arabic word buhibab (meaning fruit with many seeds) (Kamatou et al., 2011). Culturally, the baobab tree is often seen as a symbol of wisdom, strength, and longevity (Lisao et al., 2017).
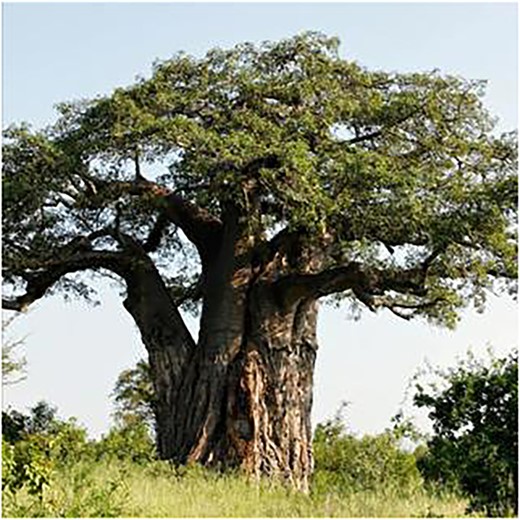
A South African baobab tree (Asogwa et al., 2021).
The tree is characterized by its high tolerance to high temperatures and long dry periods, as well as its high yield and versatile use (Dhlakama et al., 2022; Saeed et al., 2023; Soliman et al., 2016). These properties have led to it being traditionally used by the local people of Africa in the form of food, cosmetics, or medicine and represents an important source of income for the local population (Cissé et al., 2018; Monteiro et al., 2022; Saeed et al., 2023).
Use of the various components of the baobab tree
All parts of the tree are used, so that it is used in over 300 different variations, e.g., as a material supplier for clothing or hunting equipment (De Caluwé et al., 2010; Kamatou et al., 2011). The pulp, seeds, leaves, roots, flowers, and bark of the tree are also edible (Figure 3) (Rahul et al., 2015). Currently, due to its unique properties, the fruit is no longer only used by the local population, but is also grown and sold commercially, thus securing the income of thousands of people in South Africa. In the northern regions of South Africa, e.g., commercial use of the fruit began in 2005, making the tree one of the most widely used indigenous trees for seed oil production (Komane et al., 2017; Venter & Witkowski, 2011). In addition, the baobab fruit was authorized as a novel food ingredient in Europe in 2008 and a year later was granted GRAS status (“Generally Recognized As Safe”), which led to an increase in exports to other continents, such as Europe and North America (Ismail et al., 2019; Venter & Witkowski, 2011).
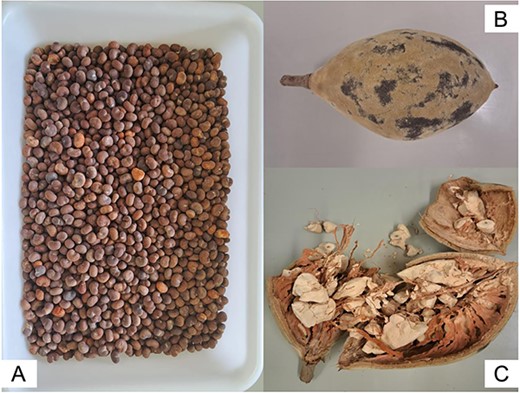
Baobab seeds (A), baobab fruit (B), and baobab pulp (C) (own images).
The fruits of the tree are characterized by a hard skin (45% of the total mass) with velvety, pale yellow–brown hairs, in which there are large, dark brown to blackish seeds (40%–60% of the total mass) and the whitish flesh (15% of the total mass) (De Caluwé et al., 2010; Dhlakama et al., 2022; Komane et al., 2017; Osman, 2004). The rich composition of its components (fruits, seeds, and leaves) has led to it being used for a wide variety of applications. As a medical plant, the various components of the tree are used to treat diseases, such as diarrhoea, dysentery, malaria, fever, tuberculosis, or toothache (Kamatou et al., 2011; Monteiro et al., 2022; Soliman et al., 2016). In other uses, they are used as food in various processed forms. The pulp can be eaten raw as a snack, beverage or in porridge, or in cooked form as an addition to salads. The dried and ground pulp is dissolved in water or milk and used as a juice or sauce, as a fermenting agent or as a substitute for cream of tartar in baking (De Caluwé et al., 2010; Monteiro et al., 2022; Saeed et al., 2023).
Baobab seeds can be consumed raw, roasted, fermented, cooked, or ground to thicken soups and stews (De Caluwé et al., 2010; Parkouda et al., 2015). Due to its high palmitic, linoleic, and oleic acid content, baobab seed oil is also used in the cosmetics industry, where it is used internationally (Komane et al., 2017). The leaves of the tree in turn serve as an important food for many locals, who either cook the leaves in the form of spinach or sun-dry them into powder (De Caluwé et al., 2010).
Bioactive compounds
The baobab fruit is often referred to as a “superfood” due to its rich nutrient profile (Msalilwa et al., 2020). The flesh is rich in vitamins, minerals, and antioxidants, very low in fat, and contains all eight essential amino acids (Asogwa et al., 2021; De Caluwé et al., 2010; Donkor et al., 2014). The sweet taste of the fruit is derived from its fructose, sucrose, and glucose content. At 150–499 mg/100 g, the vitamin C content is the highest found in a fruit and, depending on the source, 7–10 times higher than that of an orange (De Caluwé et al., 2010; Donkor et al., 2014; Kamatou et al., 2011). The high content of vitamin C as well as polyphenols and flavonoids gives the baobab fruit very good antioxidant, anti-inflammatory, and antimicrobial properties, which is why it is used in the treatment of diseases, such as cancer caused by oxidative stress (Ismail et al., 2019; Tembo et al., 2017).
The leaves are rich in minerals, vitamin A, and high-quality proteins and contain most of the essential amino acids. The seeds are also rich in fat, protein, carbohydrates, fibre, and most minerals, such as sodium, potassium, calcium, magnesium, phosphorus, iron, copper, zinc, and manganese (Asogwa et al., 2021; De Caluwé et al., 2010; Osman, 2004). The exact composition of the seeds varies slightly depending on the country of origin and can be seen in Table 1.
Composition (%) of baobab seed according to various studies.
| Country | Moisture | Fat (dw) | Protein (dw) | Ash (dw) | Fibre (dw) | Carbohydrates (dw) | Source |
|---|---|---|---|---|---|---|---|
| Zimbabwe | 5.88 ± 0.20 | 12.2 ± 0.6 | 14.45 ± 0.63 | 3.48 ± 0.26 | 22.18 ± 0.71 | 64.01 ± 1.10 | Muthai et al. (2017) |
| Tanzania | 6.65 ± 0.13 | 12.6 ± 0.7 | 14.92 ± 0.72 | 4.08 ± 0.15 | 23.83 ± 0.58 | 61.75 ± 0.91 | |
| Malawi | 5.90 ± 0.11 | 12.7 ± 0.5 | 15.18 ± 0.39 | 4.18 ± 0.10 | 23.56 ± 0.13 | 62.08 ± 0.81 | |
| Zambia | 6.34 ± 0.13 | 11.4 ± 1.0 | 13.77 ± 0.89 | 4.03 ± 0.09 | 22.93 ± 0.31 | 64.50 ± 1.41 | |
| Kenya | 7.01 ± 0.06 | 12.4 ± 0.5 | 14.43 ± 0.46 | 3.92 ± 0.19 | 23.31 ± 2.83 | 61.94 ± 0.70 | |
| Mali | 5.67 ± 0.09 | 11.8 ± 0.8 | 12.69 ± 0.79 | 4.17 ± 0.16 | 23.74 ± 0.27 | 65.69 ± 0.97 | |
| Saudi-Arabia | 4.3 ± 0.1 | 12.2 ± 0.1 | 18.4 ± 0.5 | 3.8 ± 0.1 | 16.2 ± 0.9 | 45.1 ± 1.7 | Osman (2004) |
| Nigeria | 3.35 ± 0.45 | 11.80 ± 0.1 | 17.85 ± 0.15 | 3.15 ± 0.05 | 16.46 ± 0.15 | 47.64 ± 0.04 | Mamman et al. (2021) |
| Nigeria | 3.8 ± 0.2 | 13.4 ± 0.5 | 19.5 ± 0.5 | 3.1 ± 0.1 | 15.6 ± 0.5 | 44.6 ± 0.2 | Oyeleke (2012) |
Note. dw = dry weight.
The low moisture content recorded in the various studies shows that the seeds have a long shelf life and can be stored over a long period of time (Mamman et al., 2021). The regional differences in moisture content could be due to the respective average temperatures in the countries of origin, which could lead to the seeds drying out (Muthai et al., 2017). In addition to the origin of the samples, the other differences could also be due to various factors, such as soil structure and chemical composition, genetics or the different treatment and storage of the samples, although all studies were generally able to present a very good nutrient profile (Ofori & Addo, 2023).
The mineral content of the baobab seeds
The mineral content of the seeds varies according to the study country, as does the composition of the seeds, and can be seen in Table 2. Potassium was the macroelement with the highest concentration in each of the studies analyzed, while high levels of magnesium, calcium, and phosphorus were also identified. Regarding the microelements, there were greater differences depending on the study, with iron usually accounting for the largest proportion (Mamman et al., 2021; Muthai et al., 2017; Osman, 2004).
Mineral composition of baobab seed according to various studies.
| Country | Macroelements (mg/100 g) | Microelements (mg/100 g) | Source | |||||||
|---|---|---|---|---|---|---|---|---|---|---|
| Na | K | Mg | Ca | P | Fe | Mn | Zn | Cu | ||
| Zimbabwe | 20 ± 2 | 880 ± 22 | 310 ± 10 | 230 ± 16 | 550 ± 30 | 5.83 ± 0.49 | 1.99 ± 0.09 | 1.89 ± 0.38 | 3.25 ± 0.32 | Muthai et al. (2017) |
| Tanzania | 40 ± 4 | 1,200 ± 35 | 400 ± 12 | 290 ± 9 | 630 ± 40 | 4.42 ± 0.31 | 1.05 ± 0.06 | 2.69 ± 0.22 | 2.88 ± 0.2 | |
| Malawi | 60 ± 2 | 1,060 ± 28 | 420 ± 12 | 320 ± 9 | 590 ± 20 | 4.65 ± 0.38 | 0.89 ± 0.08 | 3.33 ± 0.26 | 3.0 ± 0.31 | |
| Zambia | 20 ± 6 | 1,040 ± 36 | 360 ± 22 | 240 ± 9 | 770 ± 30 | 5.1 ± 0.18 | 2.24 ± 0.04 | 3.19 ± 0.11 | 4.63 ± 0.08 | |
| Kenya | 19 ± 6 | 910 ± 31 | 330 ± 12 | 200 ± 7 | 600 ± 20 | 6.3 ± 0.23 | 2 ± 0.06 | 2.18 ± 0.08 | 2.75 ± 0.06 | |
| Mali | 30 ± 1 | 900 ± 24 | 380 ± 19 | 260 ± 8 | 610 ± 20 | 2.58 ± 0.14 | 2.38 ± 0.13 | 3.13 ± 0.15 | 4.1 ± 0.21 | |
| Saudi-Arabia | 28.3 ± 2.2 | 910 ± 20 | 270 ± 30 | 410 ± 10 | NA | 6.4 ± 0.2 | NA | 5.2 ± 0.0 | 2.6 ± 0.2 | Osman (2004) |
| Nigeria | 28.3 ± 0.41 | 793.3 ± 0.45 | 291.8 ± 9.35 | 405 ± 14.92 | NA | NA | NA | 5.15 ± 0.05 | 1.95 ± 0.05 | Mamman et al. (2021) |
| Nigeria | 40.72 ± 0.20 | 875.15 ± 0.05 | 315.17 ± 0.05 | 521.10 ± 0.25 | 125.50 ± 0.50 | 10.12 ± 0.10 | NA | NA | NA | Oyeleke (2012) |
The consumption of baobab seeds can help to meet part of the daily human requirement of various macro- and microminerals, including the requirements of the minerals sodium, potassium, magnesium, calcium, phosphorus, iron, manganese, zinc, and copper (human requirement: 1,500; 4,700; 420; 1,200; 700; 18; 2,3; 11; and 0.9 mg/100 g, respectively) listed in Table 2 (Asogwa et al., 2021).
Baobab fruit seed oil characterization
Baobab seed oil is characterized by a wide range of essential fatty acids (FA), such as linoleic and oleic acid, a high proportion of antioxidants and vitamins, such as D, E, and K (Msalilwa et al., 2020; Ofori & Addo, 2023). However, due to the high content of carcinogenic cyclopropenoid fatty acids (CFA) (10%–12.8%), which significantly exceeds the recommended value of 0.4% for human consumption, the oil is not recommended by the FDA or the WHO as an edible oil (Msalilwa et al., 2020).
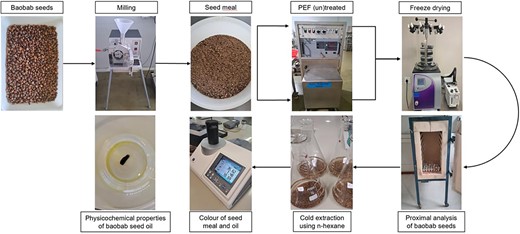
Physicochemical properties of the baobab seed oil
Fat characterization can be carried out by measuring various physicochemical properties, as can be seen in the two tables below. Some of the parameters differ greatly depending on the study, only the refractive index is almost identical in the studies considered. The study by Msalilwa et al. (2020) showed a lower refractive index of 1.04–1.07, whereby the oil was extracted by cold pressing. On the one hand, the differences can be attributed to the different study countries, whereby the results of Cissé et al. (2018) clearly show that the solvent used during extraction has a much greater influence on the characteristics. Table 3 shows the physical properties of the oil.
Physical properties of baobab seed oil extracted using the Soxhlet method.
| Parameter | n-Hexane | NA | Acetone | Chloroform | |||
|---|---|---|---|---|---|---|---|
| HE | CE | CE | HE | NA | HE | HE | |
| Country | Senegal | Sudan | Nigeria | Nigeria | Nigeria | Senegal | Senegal |
| Oilyield (%) | 30.29 ± 0.52 | 33.83 | 20.45 ± 0.05 | NA | 13.4 ± 0.5 | 23.05 ± 0.61 | 40.12 ± 0.61 |
| pH | NA | NA | NA | NA | 6.12 ± 0.50 | NA | NA |
| Specific gravity | NA | 0.87 | NA | NA | 0.92 ± 0.00 | NA | NA |
| Density at 25 °C (g/cm3) | NA | 0.87 | NA | 0.88 | NA | NA | NA |
| Refractive index | 1.46 ± 3.10 | 1.43 | NA | NA | 1.49 ± 0.00 | 1.45 ± 3.10 | 1.45 ± 3.10 |
| Melting point (°C) | NA | 8 | NA | NA | NA | NA | NA |
| Colour | Reddish yellow | Light yellow | Yellow | NA | NA | NA | |
| L* | 96.16 ± 0.01 | NA | NA | NA | NA | 85.15 ± 0.13 | 89.30 ± 0.02 |
| a* | −12.22 ± 0.01 | NA | NA | NA | NA | −4.27 ± 0.10 | −6.96 ± 0.05 |
| b* | 87.08 ± 0.02 | NA | NA | NA | NA | 95.68 ± 0.04 | 92.78 ± 0.07 |
| Reference | Cissé et al. (2018) | Abeer et al. (2020) | Abubakar et al. (2015) | Dass et al. (2013) | Oyeleke (2012) | Cissé et al. (2018) | |
Note. CE = cold extraction; HE = hot extraction; NA = not available.
The literature research also showed that the characteristics vary greatly depending on the extraction technique and possible pre-treatment technique of the seeds. For example, extraction using pressure resulted in higher values in terms of the iodine value (99.11 gI2/100 g), saponification value (233.58 mgKOH/g), acid value (18.82 mgKOH/g), and free FA (9.46%), but also in a lower oil yield (6.28 ± 0.43%) (Cissé et al., 2018). The chemical properties are shown in Table 4.
Chemical properties of baobab seed oil extracted using the Soxhlet method.
| Parameter | n-Hexane | Cyclohexene | Acetone | Chloroform | |||
|---|---|---|---|---|---|---|---|
| HE | CE | CE | NA | NA | HE | HE | |
| Country | Senegal | Sudan | Nigeria | Sudan | NA | Senegal | |
| Free fatty acid (%) | 6.25 ± 0.04 | 0.34 | NA | NA | 0.24 | 6.91 ± 0.09 | 2.80 ± 0.05 |
| Acid value (mgKOH/g) | 12.44 ± 0.08 | 6.8 | 2.75 ± 0.14 | NA | 3.14 | 13.70 ± 0.23 | 5.56 ± 0.10 |
| Saponification value (mgKOH/g) | 209.19 ± 0.79 | 180.7 | 158.62 ± 0.07 | 188 ± 13 | 186 | 205.37 ± 0.80 | 205.49 ± 0.80 |
| Iodine value (gI2/100 g) | [90.77 ± 0.84] | 98.3 | NA | 86 ± 9 | 82.58 | [83.29 ± 0.55] | [56.26 ± 1.09] |
| Peroxide value (mEq/kg) | 3.17 ± 0.24 | 4.3 | 6.02 ± 0.48 | 4.08 ± 0.7 | 10.15 | 0.49 ± 0.01 | 2.36 ± 0.07 |
| Reference | Cissé et al. (2018) | Abeer et al. (2020) | Abubakar et al. (2015) | Babiker et al. (2017) | Birnin-Yauri & Garba (2011) | Cissé et al. (2018) | |
Note. CE = cold extraction; HE = hot extraction.
The literature research showed that most of the studies focused on selected parameters. Due to the comparable magnitudes of the data from the various studies, a rough characterization of the oil can nevertheless be carried out on the basis of the literature. The values given by Cissé et al. (2018) regarding the iodine value must also be viewed critically, as these were originally given in the unit mgI2/100 g. Due to the similar order of magnitude as the other study values, which were given in the unit gI2/100 g, the unit of the iodine value of the study by Cissé et al. (2018) was adjusted in Table 4.
FA profile of the baobab seed oil
As can be seen from Table 5, the FA profile of the baobab seed oil is very similar depending on the reference and is distributed among selected saturated, monounsaturated, and polyunsaturated FA as follows.
Fatty acid profile of the baobab seed oil.
| Country | Major fatty acids (% ± SD) | Minor fatty acids (% ± SD) | Reference | |||
|---|---|---|---|---|---|---|
| Palmitic | Oleic | Linoleic | Stearic | Linolenic | ||
| C16:0 | C18:1(n-9) | C18:2(n-6) | C18:0 | C18:3 | ||
| Saudi-Arabia | 24.2 | 35.8 | 30.7 | 4.6 | 1.0 | Osman (2004) |
| Sudan | 22.87 | 23.34 | 30.63 | 5.89 | NA | Abeer et al. (2020) |
| South Africa | 28.5 ± 0.42 | 25.66 ± 0.95 | 35.75 ± 0.35 | 5.85 ± 2.05 | 0.5 ± 0.0 | Komane et al. (2017) |
| Senegal, Cameroon, Tanzania, Madagascar | 24.30 ± 1.15 | 35.89 ± 2.09 | 24.78 ± 1.46 | 4.19 ± 0.75 | NA | Razafimamonjison et al. (2017) |
| Western Africa | 23.8 ± 0.19 | 34.9 ± 0.23 | 26.9 ± 0.2 | 4.62 ± 0.05 | 0.23 ± 0.01 | Parkouda et al. (2015) |
| Zambia | 21.09 ± 0.71 | 35.83 ± 1.15 | 27.12 ± 3.30 | 1.19 ± 0.08 | 0.85 ± 0.10 | Muthai et al. (2019) |
| Zimbabwe | 20.87 ± 0.94 | 33.29 ± 1.49 | 25.06 ± 0.98 | 1.50 ± 0.08 | 0.86 ± 0.05 | |
| Malawi | 20.58 ± 0.50 | 33.80 ± 2.20 | 25.35 ± 2.10 | 1.47 ± 0.13 | 0.79 ± 0.22 | |
The general profile is characterized by approximately two thirds unsaturated and one third saturated FA. Important saturated FA are palmitic acid, while the largest proportions of unsaturated FA are oleic acid (monounsaturated) and linoleic acid (polyunsaturated). This means that baobab oil can serve as a good source of monounsaturated and polyunsaturated FA, which are particularly important for the human nutrition and metabolism (De Caluwé et al., 2010).
Msalilwa et al. (2020) investigated the reduction of CFA in baobab oil from Tanzania, finding sterculic acid levels between 0.97% and 1.45% and dehydrosterculic acid levels between 0.80% and 1.29%. The study showed that heating the oil at 150, 200, and 250 °C for 5–20 min reduced sterculic and dehydrosterculic acids to 2%–8% and 5%–15% of their original concentrations, respectively. Moreover, heating at 250 °C for 20 min reduced CFA levels to below the FDA’s recommended limit of 0.4%.
Antioxidant activity of the baobab seed oil
Various plant secondary metabolites are used in traditional medicine to prevent oxidative stress caused by free radicals. This stress is based on the reactivity of radicals, which is caused by the property of having one or more unpaired electrons. The over-production of these reactive substances leads to the oxidation of lipids and proteins, among other things, and thus to cell damage and certain diseases (Ndiaye et al., 2021). At the same time, the oxidation of lipids is a relevant reaction during food storage, as this reduces both the nutritional value and the shelf-life of the food (Vhangani & Van Wyk, 2016). Secondary metabolites, such as phenols, flavonoids, and tannins, serve as radical scavengers and can thus neutralize the reactive oxygen species (ROS) (Cissé et al., 2018).
The antioxidant content and antioxidant activity of baobab oil can be seen in Table 6. The study by Abubakar et al. (2015) found a generally very low antioxidant activity of baobab oil.
Total polyphenol content TPC (gallic acid equivalent per milligram of extract), flavonoid TFC (μg quercetin equivalent per milligram of extract), and tannin TTC (μg equivalent of catechin per milligram of extract) content and antioxidant activity (via DPPH or FRAP assay) of baobab seed and oil using different extraction methods.
| Parameter | n-Hexane | Acetone | Chloroform | ||||
|---|---|---|---|---|---|---|---|
| Part of baobab fruit | Oil | Seed | Oil | Oil | Oil | Oil | |
| Extraction technique | Hot extraction | NA | NA | Hot extraction | Hot extraction | Hot extraction | |
| Country | Senegal | Senegal | Sudan | Ghana | Senegal | Senegal | |
| TPC (μg EAG/mg) | 28 ± 4 | 18.26 ± 0.07 | NA | 4.1 ± 3.3 | 26 ± 3 | 25 ± 2 | |
| TFC (μg EQ/mg) | NA | 12.82 ± 0.04 | NA | 16.5 ± 3.5 | NA | NA | |
| TTC (μg EC/mg) | NA | 1.09 ± 0.04 | NA | 15.6 ± 4.0 | NA | NA | |
| DPPH | (%) | 15.27 ± 0.15 | NA | 19.00 ± 0.02 | NA | 26.38 ± 0.60 | 9.23 ± 0.67 |
| (IC50μg/ml) | NA | 20.19 ± 0.48 | NA | 1617.8 ± 7.6 | NA | NA | |
| FRAP (EC50g/ml) | NA | >100 | NA | NA | NA | NA | |
| Reference | Cissé et al. (2018) | Ndiaye et al. (2021) | Hussein & Mohammed Hamad (2020) | Thompson et al. (2024) | Cissé et al. (2018) | ||
Note. TPC = total polyphenol content; TFC = total flavonoid content; TTC = total tannin content; DPPH = 2,2-diphenyl-1-picrylhydrazyl; FRAP = ferric reducing antioxidant power.
The antioxidant activity of a sample can be measured using two methods, namely the DPPH test (2,2-diphenyl-1-picrylhydrazyl) for the reduction of free radicals and the FRAP test for measuring ferric reducing antioxidant power. The DPPH value can be expressed both as a percentage or in IC50 (μg/ml), which indicates the concentration of the substrate in μg/ml that causes the loss of 50% of DPPH activity. Meanwhile, the ferric reducing antioxidant power is expressed in IC50 (μg/ml). The EC50 concentration corresponds to the effective concentration at which the absorbance of the reaction medium is equal to 0.5 (Ndiaye et al., 2021).
The classification of the antioxidant properties of baobab seeds is also of interest in view of their high iron content. Iron is significantly involved in many processes and reactions that favour oxidative stress. This property is based on the fact that iron is an important producer of H2O2 and OH− and thus ROS, as various reactions, such as the Fenton-type reaction or the oxidation of iron–sulphur clusters, take place. Various polyphenol compounds can in turn bind the iron due to their mode of action as metal chelators and thus inhibit the production of ROS (Thompson et al., 2024). The iron content of the seeds and the antioxidant content could be related to each other and balance each other's prooxidant and antioxidant properties. The relationship between these components must be investigated in further studies for the baobab seeds and oil.
The differences with regard to the various contents are mainly due to the different extraction techniques and the different study countries, whereby factors, such as climate and location, are significant (Thompson et al., 2024). In their study, Cissé et al. (2018) investigated the influence of the extraction method on the physicochemical properties and antioxidant activity of baobab oil. They found a very high content of phenolic compounds (47 ± 2.4 μg EAG/mg) and a high DPPH (31.71 ± 0.610%) in the oil extracted by pressing. In contrast, extraction using chloroform ensured the highest yield, and extraction using n-hexane had the least negative impact on the physicochemical properties. The use of acetone to extract the oil resulted in the highest DPPH among the organic solvents (26.38 ± 0.600%). Based on these results, they recommended the mixed use of acetone and n-hexane to extract the oil.
Extraction techniques
Extraction is a separation process in which one or more components are separated from solutions using a specific extraction agent or solvent. Extraction can therefore be used, e.g., to remove bioactive components from plant cells (Selvamuthukumaran & Shi, 2017).
There are various ways of harnessing the valuable constituents of biological cells for human use, with extraction being one method of specifically extracting and isolating these constituents while excluding unwanted components of the cell. Therefore, the ingredients must be able to cross the cell barriers of the cell to be released. For this purpose, the cells can be biologically, chemically, or physically pre-treated, which leads to a destruction of the cell structures and thus facilitates the subsequent extraction (Martínez et al., 2020).
Chemical pre-treatments are characterized by an efficient and easily scalable application as well as high chemical costs and the need for downstream product purification due to contamination of the cell suspension. Enzymatic treatment is equally cost-intensive and is also characterized by long incubation times and difficult enzyme recovery (Martínez et al., 2020). Physical methods are therefore often used to avoid the disadvantages of biological-chemical methods. Due to their simple application and low selectivity, physical methods are also well suited to exerting targeted stress on the cells and thus releasing the desired ingredients while ensuring a high level of purity (Martínez et al., 2020).
Conclusion
The products of the baobab tree represent an exciting opportunity to ensure food security in the face of the challenges of today and tomorrow. New technologies in particular can help to improve yields and product quality and thus optimize the processing procedure. Various studies have investigated the influence of thermal versus alternative non-thermal physical processes on the bioactive substances of baobab fruit, generally showing a significant reduction in antioxidant activity as a result of thermal treatment (Ismail et al., 2021; Tembo et al., 2017). Both the total phenolic content (+22%) and the total flavonoid content (+11%) differed significantly when treated with high-intensity ultrasound compared to thermal treatment, with the lowest values observed when treated at 70 °C for 5 min. The same correlation was also observed for the antioxidant capacity (DPPH) and ferric reducing antioxidant power (FRAP), which was reduced by up to 33% (DPPH) and 41% (FRAP) by thermal treatment compared to ultrasound treatment (Ismail et al., 2021). These findings are also reflected in Tembo et al. (2017), where a 31% decrease in total polyphenol content was observed in pasteurized baobab juice, while DPPH and FRAP also decreased (−3.2% and −2.4%, respectively).
Even though the antioxidant properties in the explanations given so far have mainly been used by consuming the fruit flesh in whole or processed form, these properties can also be harnessed by extracting the bioactive substances. Extraction makes it possible to utilize all other components of the fruit in addition to the pulp (Ismail et al., 2019; Ndiaye et al., 2021). However, since the bioactive ingredients of the baobab fruit are heat-sensitive, as the studies listed above show, non-thermal extraction methods are being investigated (Selvamuthukumaran & Shi, 2017).
The seeds of the baobab tree in particular may be of interest for future studies. Further studies should be carried out on non-thermal processes and their application for extracting the oil from baobab seeds in order to increase the oil yield. At the same time, it must be ensured that the product quality of the oil is not impaired.
Conclusion
With its unique characteristics and wide range of uses, the baobab tree represents an exciting opportunity to address food insecurity in the context of today's challenges. The individual components of the tree have long been used in various forms by the local population, and their commercial utilization has continued to increase in recent years. In addition to the baobab fruit, which is also known as a “superfood,” the seeds are a particularly interesting component of the tree. These seeds are rich in protein, fibre, carbohydrates, fat, and most minerals. The oil of the seeds is of particular interest, as it is characterized by a high content of essential FA as well as a high content of antioxidants. Against this background, further studies should be carried out into how the extraction of the oil from the seeds can be optimized without restricting the quality and antioxidant properties of the oil. As already described in the previous section, non-thermal techniques in particular can be used here.
Data availability
Data from this project/study are stored in the Cape Peninsula University of Technology institutional repository and will be available on request.
Author contributions
Henning Schulte (Formal analysis [equal], Investigation [equal], Writing—original draft [equal]), Lusani Norah Vhangani (Data curation [equal], Formal analysis [equal], Funding acquisition [equal], Writing—original draft [equal]), and Stefan Toepfl (Supervision [equal], Writing—review & editing [equal]). All authors have read and agreed to the published version of the manuscript.
Funding
This work was funded by the National Research Foundation (NRF) Black Academics Advancement Programme (BAAP) Post PhD Track, Grant/Award Number: NFSG23032487218.
Conflicts of interest
The authors declare that they have no known competing financial interests or personal relationships that could have appeared to influence the work reported in this paper.
Acknowledgements
The authors want to thank the Department of Food Science and Technology at the Cape Peninsula University of Technology. The authors would also like to thank the Faculty of Agricultural Sciences and Landscape Architecture (AuL) at Osnabrück University of Applied Sciences and Lea Klöppel from the International Faculty Office at Osnabrück University of Applied Sciences for their great help.
