


Abstract
After completion of puberty a subset of men experience functional hypogonadotropic hypogonadism (FHH) secondary to excessive exercise or weight loss. This phenomenon is akin to hypothalamic amenorrhea (HA) in women, yet little is known about FHH in men.
To investigate the neuroendocrine mechanisms, genetics, and natural history underlying FHH.
Retrospective study in an academic medical center.
Healthy postpubertal men presenting with symptoms of hypogonadism in the setting of excessive exercise (>10 hours/week) or weight loss (>10% of body weight). Healthy age-matched men served as controls.
Clinical assessment, biochemical and neuroendocrine profiling, body composition, semen analysis, and genetic evaluation of genes known to cause isolated GnRH deficiency.
Reproductive hormone levels, endogenous GnRH-induced LH pulse patterns, and rare genetic variants.
Ten men with FHH were compared with 18 age-matched controls. Patients had significantly lower body mass index, testosterone, LH, and mean LH pulse amplitudes yet normal LH pulse frequency, serum FSH, and sperm counts. Some patients exhibited nocturnal, sleep-entrained LH pulses characteristic of early puberty, and one FHH subject showed a completely apulsatile LH secretion. After decreased exercise and weight gain, five men with men had normalized serum testosterone levels, and symptoms resolved. Rare missense variants in NSMF (n = 1) and CHD7 (n = 1) were identified in two men with FHH.
FHH is a rare, reversible form of male GnRH deficiency. LH pulse patterns in male FHH are similar to those observed in women with HA. This study expands the spectrum of GnRH deficiency disorders in men.
In humans, GnRH plays a critical role in initiating puberty and sustaining normal reproductive capacity in adulthood (1). In women, factors such as stress, weight loss, and exercise can suppress hypothalamic GnRH secretion, resulting in dysfunction of the hypothalamo-pituitary-gonadal (HPG) axis, leading to functional hypothalamic amenorrhea (HA) (2, 3). This well-characterized pathophysiologic state of hypogonadotropic hypogonadism often presents in the context of the female athlete triad (i.e., low nutritional energy availability, HA, and osteoporosis) (4) and is typically reversible when the relative energy deficit is corrected (2). Furthermore, a genetic contribution to HA has been described, with mutations in genes affecting GnRH neuronal integrity identified in some women with HA (5). However, to date, there are limited data describing a male phenotypic parallel to HA.
In contrast to women, men appear more resistant to disruptions of the HPG axis from physiologic stressors. However, a limited number of studies have shown reduced serum testosterone (T) levels in response to exercise, yet T levels typically remain within the normal range (6–13). Similarly, caloric restriction and starvation decrease serum T levels (14–16). Studies of soldiers during intense training exercises demonstrate that stress, energy deficit, and physical exertion are associated with decreased T, sometimes even below the normal range (17–22). However, it is not clear whether these men experience symptoms of overt clinical hypogonadism (23). Notably, frequent sampling studies have demonstrated that even healthy men may have frankly hypogonadal T levels over the course of a 24-hour period without experiencing hypogonadal symptoms (i.e., decreased libido and sexual dysfunction) (24). To date, a few case reports have depicted men exhibiting functional hypogonadotropic hypogonadism (FHH), that is, clinical hypogonadism evidenced by low serum T and hypogonadal symptoms in the setting of extreme exercise or energy imbalance (25, 26), analogous to young women presenting with HA. However, the neuroendocrine profile, natural history, and genetic predisposition to FHH in men remain to be investigated. To address this gap, detailed biochemical profiling and genetic investigation were undertaken to identify salient neuroendocrine and genetic features of FHH in a cohort of otherwise healthy young men who presented for evaluation of hypogonadism secondary to excessive exercise or weight loss.
Materials and Methods
Subjects
This retrospective study included otherwise healthy young men (18 to 35 years old) presenting to the Reproductive Endocrine Associates Group Practice at Massachusetts General Hospital for clinical evaluation of hypogonadism between 1986 and 2016. Hypogonadal subjects reported in this study were enrolled in genetic and physiologic study protocols at Massachusetts General Hospital (NCT00494169) (27). FHH was defined as a fasting morning serum T of <300 ng/dL (<10.4 nmol/L) (threshold consistent with current Endocrine Society guidelines for testosterone therapy in men with hypogonadism) (23), accompanied by symptoms of hypogonadism (i.e., complaints of decreased libido, decreased frequency of morning erections, and erectile dysfunction) in the setting of low serum gonadotropins and a predisposing factor previously implicated to cause HA in women: excessive exercise (>10 hours/week) or recent weight loss >10% of body weight (28, 29). Other potential causes of hypogonadism were excluded, as evidenced by pubertal completion, adult testicular volume (TV >15 mL), normal sense of smell, serum cortisol, prolactin, ferritin, iron binding studies, and normal MRI of the hypothalamo-pituitary region. None of the men had a history of opiate or anabolic androgen use. A reference group of 18 age-matched, normal weight, healthy subjects without a history of excessive exercise or calorie deficits served as the control group. These men were on no medications, had stable weight, and exhibited normal TV and were drawn from a previous research study (NCT00392457) (30). The research activities of the hypogonadal subjects and control subjects were all approved by the Partners HealthCare Human Research Committee. All subjects provided written informed consent before the initiation of study procedures.
Clinical and biochemical assessment
Subjects had a comprehensive medical history including family and personal health, pubertal history, dietary review, exercise review, drug and alcohol use, comorbidities, and symptoms of hypogonadism. A complete physical examination was performed, including assessment of testicular volume by Prader orchidometer and formal smell testing (31). Patients and healthy control subjects were admitted for an overnight frequent blood sampling study (every 10 minutes × 12 hours) to assess their GnRH-induced pattern of LH secretion (32). Serum FSH, T, estradiol, and inhibin B were measured in pooled samples (constituted from equal aliquots of the 10-minute samples). A modified version of the Santen and Bardin method was used to evaluate their patterns of LH secretion (33, 34). Semen samples were obtained after 48 hours of abstinence in patients (n = 3) able to provide a sample. Frozen samples were analyzed according to standard World Health Organization criteria (35). Bone density and body composition were assessed with dual X-ray absorptiometry (DXA) (Prodigy, General Electric, Madison, WI).
Genetic studies
Genomic DNA was isolated from peripheral blood lymphocytes. Sanger sequencing for 14 well-validated genes (36) including ANOS1 (formerly KAL1) (OMIM 308700), GNRH1 (OMIM 152760), GNRHR (OMIM 138850), KISS1R (OMIM 604161), KISS1 (OMIM 603286), CHD7 (OMIM 608892), NSMF (OMIM 608137), FGF8 (OMIM 600483), FGFR1 (OMIM 136350), PROK2 (OMIM 607002), PROKR2 (OMIM 607212), HS6ST1 (OMIM 1 604846), TAC3 (OMIM 162330), and TACR3 (OMIM 162332) was performed. The PCR primers and amplification conditions for each gene have been previously published (37–39). A rare sequence variant was defined as a variant affecting canonical splice junctions within 2 bp of coding sequence or a protein-altering/protein-truncating nonsynonymous variant and present in <0.1% minor allele frequency in gnomAD (http://gnomad.broadinstitute.org). All coding DNA and protein changes were based on the Genome Reference Consortium (GRCh37/hg19), and nomenclature was reported per most updated guidelines of the Human Genome Variation Society (40).
Assays
Serum gonadotropins were measured with Abbott Architect or AxSYM systems (Chicago, IL). For comparability and sake of consistency, we set the level of detection of 1.6 IU/l based on the human menopausal gonadotropin standard that is equivalent to 0.34 mIU/mL LH or 0.66 mIU/mL FSH based on pituitary standards (80/552 and 92/510, respectively). Level of detection was 1.6 IU/L for LH and FSH, with an intra-assay coefficient of variation (CV) of <7% and an interassay CV of <7.4%. Serum T concentrations were measured consistently throughout the study period with the DPC Coat-A-Count RIA kit (Diagnostic Products Corp., Los Angeles, CA) which has an intra- and interassay CV of <10% for all samples. Estradiol (E2) was measured by the Abbott AxSYM system (Chicago, IL), which has an analytical sensitivity of 10 pg/mL, an intra-assay CV of <6.4%, and an interassay CV of <10.6%. Inhibin B was measured with a commercially available (Serotec, Oxford, UK) double-antibody ELISA as previously described (41). Clinical limit of detection is 15.6 pg/mL, with a CV of 4% to 6% within plate and 15% to 18% between plates.
Analysis
Student t test was used to assess differences between groups and from baseline to follow-up. When data were not distributed normally, Mann-Whitney U test was used. A P < 0.05 was considered statistically significant. Data are presented as mean ± SD unless otherwise stated. For genetic studies, given the small number of subjects in the FHH cohort, statistical burden testing for rare variant enrichment was not performed.
Results
Baseline clinical characteristics
A total of 10 men met the inclusion criteria for FHH and underwent detailed neuroendocrine profiling. Their clinical characteristics at diagnosis and at the time of overnight frequent sampling are shown in Table 1 and Table 2. The men (18 to 33 years old) were otherwise healthy, had undergone complete pubertal development (mean TV, 21.6 ± 2.6 mL, median 21.5 mL), and had other possible causes of hypogonadism ruled out. The majority (6/10) reported regular, strenuous aerobic exercise (i.e., running, rowing, marathon or triathlon training) for >10 h/wk. Similarly, 6 men had weight loss of ≥10% of their body weight (Table 2). Since their initial presentation and diagnosis of hypogonadism, several men with FHH had gained weight (and in some cases before their overnight frequent sampling study), yet one subject (subject 10) remained underweight [body mass index (BMI) <18.5 kg/m2] (Table 1). Despite weight gain, men with FHH had significantly lower BMIs compared with the age-matched healthy controls (20.3 ± 2.2 kg/m2 vs 24.1 ± 2.2 kg/m2, P < 0.001). A subset of six hypogonadal patients underwent body composition assessment by DXA. These men were lean, with overall body fat ranging from 4.1% to 13% (median 8%) (Table 2).
Clinical and Biochemical Characteristics of Men With FHH
| Subject | TV (mL) | BMI (kg/m2) | Testosterone (ng/dL) | Estradiol (pg/mL) | FSH (IU/L) | Inhibin B (pg/mL) | LH (IU/L) | Pulses (#) | Mean Amplitude | LH Pulse Pattern | Recovery | Sperm Count (×106/mL) | ||
|---|---|---|---|---|---|---|---|---|---|---|---|---|---|---|
| Present | NE Eval | Present | NE Eval | |||||||||||
| 1 | 23 | 17.7 | 19.9 | 53 | 473 | 15 | 5.0 | n/a | 9.3 | 3 | 6.1 | Normal | Yes | n/a |
| 2 | 20 | 18.8 | 19.3 | 191 | 247 | 13 | 4.2 | n/a | 5.3 | 6 | 3.0 | Normal | Yes | n/a |
| 3 | 20 | 18.9 | 19.3 | 122 | 133 | <10 | 4.7 | 147.2 | 2.8 | 5 | 2.5 | Normal | Yes | n/a |
| 4 | 23 | 21.3 | 22.1 | 109 | 193 | 13 | 3.5 | 74.4 | 9.1 | 5 | 6.6 | Normal | Yes | 23 |
| 5 | 20 | 23.9 | 26.8 | 145 | 225 | <10 | 2.7 | n/a | 4.9 | 3 | 4.0 | Sleep-entrained | Yes | n/a |
| 6 | 20 | 19.1 | 20.8 | 82 | 121 | 11 | 7.4 | 70.7 | 6.7 | 4 | 3.0 | Sleep-entrained | n/a | n/a |
| 7 | 25 | 20.5 | 26.8 | 144 | 187 | 12 | 2.5 | n/a | 5.7 | 3 | 5.3 | Sleep-entrained | n/a | n/a |
| 8 | 25 | 22.2 | 23.0 | 179 | 243 | 22 | 2.9 | n/a | 7.0 | 5 | 5.7 | Normal | n/a | 50 |
| 9 | 17 | 22.7 | 22.9 | 99 | 228 | 28 | 6.6 | 74.2 | 5.0 | 4 | 3.6 | Normal | n/a | 118 |
| 10 | 23 | 23 | 17.8 | 129 | 161 | <10 | 2.3 | n/a | 1.5 | 0 | n/a | Apulsatile | n/a | n/a |
| Men with FHH (n = 10) | 20.3 ± 2.1 | 20.6 ± 2.1a | 125 ± 40 | 193 ± 47a | 14.4 ± 6.0a | 4.1 ± 1.8 | 91.6 ± 37.1b | 4.1 ± 1.8a | 3.9 ± 1.8 | 4.2 ± 1.5c | — | — | — | |
| Controls (n = 18) | — | 24.1 ± 2.2 | — | 513 ± 93 | 38.2 ± 9.7 | 5.0 ± 1.7 | 176.8 ± 58.8 | 10.2 ± 2.8 | 5.0 ± 1.9 | 7.7 ± 2.9 | Normal | — | — | |
Statistically significant differences noted in bold.
Abbreviations: n/a, not applicable; NE eval, at neuroendocrine evaluation; present; at presentation.
P < 0.001.
P = 0.015.
P = 0.004.
Presenting Symptoms and Characteristics of Predisposing Factors in Subjects With FHH
| Subject | Age (y) | TV (mL) | Presenting Symptoms | Exercise | Weight Loss | Body Fat (%) | Comments |
|---|---|---|---|---|---|---|---|
| 1 | 19 | 23 | ↓ Libido, erectile dysfunction | X | n/a | Weight loss = 14% of BW | |
| 2 | 19 | 20 | ↓ Training performance, ↓ libido, ↓ morning erections | X | 10.3 | Exercise = 2–5 h/d (triathlete); restrictive diet | |
| 3 | 18 | 20 | ↓ Training performance, ↓ libido | X | 4.1 | Exercise = 2–3 h/d; restrictive diet; weight loss = 10% of BW | |
| 4 | 26 | 23 | ↓ Libido, erectile dysfunction | X | 7.8 | Weight loss = 13% of BW (daily exercise + restrictive diet) | |
| 5 | 18 | 20 | ↓ Training performance, ↓ libido, absent morning erections | X | X | 12.0 | Exercise = runs 75–80 miles/wk |
| 6 | 21 | 20 | ↓ Libido, ↓ morning erections | X | X | 8.1 | Exercise = runs 40–50 miles/wk, weight loss = 15% of BW |
| 7 | 18 | 25 | ↓ Training performance, absent morning erections | X | 13.0 | Exercise = 2 h/d (running, elliptical, and weight lifting) | |
| 8 | 31 | 25 | ↓ Libido and potency | X | n/a | Exercise = runs 40–45 miles/wk | |
| 9 | 31 | 17 | ↓ Libido and potency | X | n/a | Weight loss = 27% of BW (daily exercise + restrictive diet) | |
| 10 | 33 | 23 | ↓ Libido, absent morning erections | X | n/a | Weight loss = 19% of BW (daily exercise + restrictive diet) |
Body fat was assessed using DXA.
Abbreviations: BW, body weight; n/a, not applicable.
Reproductive phenotypes and neuroendocrine profiles of men with FHH
The men with FHH exhibited normal adult male testicular volumes, which were not different from controls (median 21.5 vs 25 mL, P = 0.175). Men with FHH had similar serum FSH levels but significantly lower LH levels (Table 1). A spectrum of GnRH-induced LH pulse secretion patterns was evident in FHH (Fig. 1). Six men with FHH displayed a normal, albeit inappropriately normal, LH secretion pattern given the hypogonadal T levels; three exhibited a developmental arrest pulse pattern with nocturnal, sleep-entrained LH pulses; and one subject exhibited an apulsatile pattern with undetectable LH. The pulse studies of three subjects (subjects 8, 6, and 10) with each of the three representative pulse patterns (normal, sleep-entrained, and apulsatile, respectively) are shown in Fig. 1. Pulse studies of the remaining subjects (subjects 1, 2, 3, 4, 7, and 9) are shown in Fig. 2. Longitudinal pulse studies in subject 5 are shown in Fig. 3: baseline (Fig. 3A) and reversal of GnRH deficiency after weight gain (Fig. 3B). Pulse studies of control subjects are shown in an online repository (42). LH pulse frequency did not differ between the FHH group and controls (3.8 ± 1.7 vs 5.0 ± 1.9, P = 0.109), yet the patient group exhibited significantly lower LH pulse amplitude in the setting of T deficiency (4.0 ± 2.0 vs 7.7 ± 2.9 IU/L, P = 0.001) (Table 1). Only three men with FHH (subjects 4, 8, and 9) could produce a semen sample for analysis, and all samples showed normal sperm counts (i.e., >15 × 106/mL). A subset of men (subjects 3, 4, 6, and 9) had serum inhibin B measured. Serum inhibin B levels were significantly lower compared with controls (Table 1).
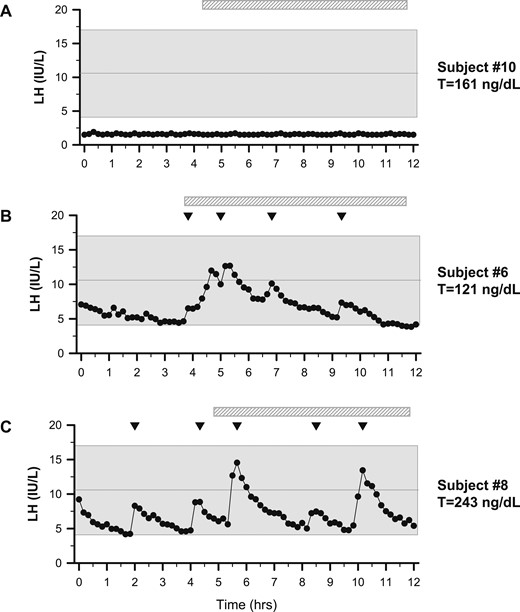
Representative graphs of LH secretion patterns in three men with FHH. Subjects underwent neuroendocrine profiling (every 10 minutes × 12 hours) to chart GnRH-induced LH secretion. (A) Subject 10 was the lone patient with an apulsatile LH secretion pattern. (B) Subject 6 displayed sleep-entrained pulses (hatched bar depicts sleep period). (C) Subject 8 exhibited a normal LH secretion pattern with characteristic peaks, as observed in healthy controls (42). Shaded region represents the normal reference range (27). Inverted triangles indicate LH pulses.
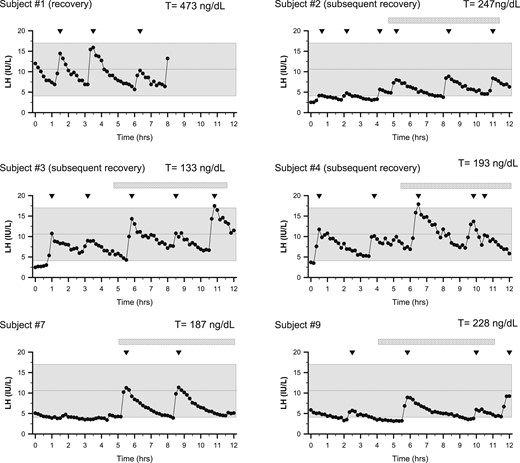
Spectrum of LH secretion patterns of men presenting with FHH. Subjects underwent detailed neuroendocrine profiling (every 10 minutes × 12 hours) to chart LH secretion pattern. Inverted triangles depict LH pulses. Shaded region depicts the normal reference range (27). Subject 1 underwent only 8 hours of sampling and had recovered HPG axis function at the time of the neuroendocrine evaluation (normal serum T levels).
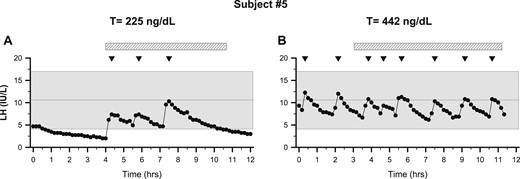
Recovery from functional hypogonadotropic hypogonadism. Subjects underwent neuroendocrine profiling (every 10 minutes × 12 hours) to chart GnRH-induced LH secretion. (A) Patient 5 exhibited nocturnal sleep-entrained LH pulses and hypogonadal serum T (225 ng/dL, 7.8 nmol/L). (B) After weight gain, repeat frequent sampling showed normal LH pulse frequency and amplitude with normal serum T (442 ng/dL, 15.3 nmol/L). Note: The study was stopped at 11 hours of sampling because of a problem with the IV. Shaded region represents the normal reference range (27). Inverted triangles indicate LH pulses. The hatched bars depict periods of sleep.
Natural history of FHH
Follow-up data were available for five men with FHH, enabling us to examine the natural history of FHH. Subject 1 had gained weight before his overnight neuroendocrine study admission (BMI 17.7 to 19.9 kg/m2) and therefore had normalized his serum T levels, and, accordingly, his neuroendocrine evaluation revealed a normal LH pulse pattern (Fig. 2), demonstrating recovery of HPG function and reversal of FHH (T 473 ng/dL, 16.4 nmol/L). Normal T levels were documented subsequently at 2 months (358 ng/dL, 12.4 nmol/L) and 4 months after recovery (601 ng/dL, 20.8 nmol/L). Patient 2 was a competitive runner who first presented at age 19 with a BMI of 18.8 and hypogonadotropic hypogonadism (T = 119 ng/dL, LH = 0.8 IU/L, FSH = 2.3 IU/L). Although he surprisingly had a normal LH pulse pattern (amplitude and frequency), his LH pulse amplitude doubled during sleep. The mean amplitude of his waking pulses was 1.9 IU/L, and the three pulses during sleep averaged 4.0 IU/L (Fig. 2). He decreased his training from 75 to 80 miles/wk to ∼50 miles/wk. Within 3 months, his T normalized to 365 ng/dL (12.7 nmol/L), and his symptoms improved. Follow-up a month later showed sustained normalized T levels (604 ng/dL, 20.9 nmol/L).
Patient 3 was an 18-year-old triathlete who had a BMI of 18.9 kg/m2 with very low body fat (4.1%). Serum T was 133 ng/dL (4.6 nmol/L), yet he had a normal LH pulse pattern (5 pulses/12 h) (Fig. 2). He experienced a stress fracture and decreased his training to three times a week. During this time, his BMI increased to 20.3 kg/m2 and serum T increased to 292 ng/dL (10.2 nmol/L). Patient 4 was a 26-year-old runner whose family history was notable for a sister with a history of HA. At neuroendocrine evaluation, he had gained weight, increasing his BMI from 21.3 to 22.1 kg/m2 (7.8% body fat). His serum T was still low at 193 ng/dL (6.7 nmol/L) in the setting of a normal LH secretion pattern (five pulses/12 h) (Fig. 2). He decreased his exercise by limiting his training to three times per week, resulting in weight gain (BMI increased to 23.3 kg/m2), a concurrent rise in serum T to 280 ng/dL (9.7 nmol/L), and improved symptoms.
Subject 5 was a competitive rower whose family history was positive for HA in an aunt. He exhibited a normal BMI at evaluation (23.9 kg/m2) yet was hypogonadal, with a serum T of 145 ng/dL (5.0 nmol/L) in the setting of excessive exercise and very low body fat (12%) (Table 2). Notably, his overnight neuroendocrine study showed that he exhibited a nocturnal LH pulse pattern with three sleep-entrained pulses (Fig. 3A). He was encouraged to increase dietary fat intake and decrease his training frequency/intensity. Over a 5-month period with modified diet and nutrition, he had gained weight and his BMI had increased to 27.9 kg/m2 and serum T levels normalized to 361 ng/dL (12.5 nmol/L). He agreed to undergo a repeat frequent sampling study revealing a normal frequency and amplitude (Fig. 3B) with a normal mean serum T of 442 ng/dL (15.3 nmol/L). These illustrative cases suggest that, similar to HA in women (2, 3), HPG suppression observed in men with FHH can be reversed by correcting the precipitating caloric deficit or excessive exercise.
Genetic studies
Interestingly, a family history of HA was noted in two subjects with FHH (sister of subject 4, aunt of subject 5). Given the familial co-occurrence of FHH and HA and previously established genetic basis of HA (8), we screened the male FHH cohort for variants in 14 genes known to underlie isolated GnRH deficiency (i.e., hypogonadotropic hypogonadism or Kallmann syndrome) (36, 43). Neither of the FHH subjects with a family history of HA harbored any rare variants. However, we identified rare, heterozygous variants in two other men with FHH (Table 3). Patient 7 harbors a heterozygous rare missense variant in CHD7 predicted to be damaging by three in silico prediction algorithms without associated features of CHARGE syndrome. Patient 9 harbors a heterozygous rare missense variant in NSMF, which is also predicted to have a deleterious effect in three in silico prediction programs.
Rare Genetic Variants Identified in Men With FHH
| Subject | Gene | Nucleotide Change | AA Change | Zygosity | Genomic Location | Transcript | Minor Allele Frequency (gnomAD) | Polyphen | SIFT | Mutation Taster |
|---|---|---|---|---|---|---|---|---|---|---|
| 7 | CHD7 | c.7043G>A | p.G2348D | Het | Chr 8: 61768640G>A | NM_017780 | 4.14 × 10−06 | Probably damaging | Deleterious | Disease causing |
| 9 | NSMF | c.1025G>T | p.G342V | Het | Chr9: 140347530C>A | NM_001130969 | 4.48 × 10−05 | Probably damaging | Deleterious | Disease causing |
Abbreviations: AA, amino acid; gnomAD: gnomad database (http://gnomad.broadinstitute.org); het, heterozygous.
Discussion
A cohort of 10 men with FHH secondary to exercise or weight loss was studied via detailed neuroendocrine studies that show pathophysiologic neuroendocrine defects similar to those previously reported in women with HA (2, 3, 44, 45). Longitudinal studies also show that, like their HA counterparts, men with FHH display a similar reversibility of their HPG axis suppression upon restoring a more physiologic energy/caloric balance. Indeed, FHH and HA co-occurred in related family members in two FHH pedigrees, suggesting shared pathogenic mechanisms. These observations indicate that male FHH is a phenotypic equivalent parallel to women with HA and expand the spectrum of GnRH deficiency disorders in men to include FHH as a distinct hypogonadotropic state. We also hypothesized that some men may harbor a genetic predisposition to FHH similar to previous reports in HA and identified two rare genetic variants in genes related to GnRH deficiency.
In this report, we describe detailed neuroendocrine profiles of 10 subjects with FHH exhibiting pathognomonic symptoms of overt androgen deficiency, with documented evidence of hypogonadal levels of serum T. One of the first publications showing decreased serum T levels in marathon runners demonstrated decreased LH pulse frequency and amplitude (every-20-minute sampling × 8 hours) (7). In the current study, detailed neuroendocrine profiling (every 10 minutes × 12 hours) revealed a normal GnRH-induced LH secretion pattern in the majority of men with FHH. A small subset of men with FHH exhibited a sleep-entrained pulse pattern characteristic of early puberty (Figs. 1–3) (46), and this “development arrest” pattern has also been observed in women with HA (2). Overall, LH pulse frequency did not differ between the FHH group and control group, whereas mean pulse amplitude was lower in the FHH group (Table 1). Cumulatively, these data suggest that a preserved GnRH-induced LH pulse frequency with a diminished pulse amplitude is the neuroendocrine signature for FHH, and this discordant pulse frequency-amplitude pattern differentiates men with FHH from the controls who exhibit robust pulse amplitude and normal frequency (Figs. 1–3) (42). Importantly, pulse patterns observed in most men with FHH also differed from another distinct GnRH-deficient state, adult-onset hypogonadotropic hypogonadism (47). Indeed, men with adult-onset hypogonadotropic hypogonadism lack identifiable triggers (i.e., exercise or weight loss), display apulstatile LH secretion, and do not recover (48). However, it is notable that neuroendocrine studies in the men with FHH were performed several weeks after most of these men had initiated lifestyle changes to address their energy deficit state. Thus, lifestyle changes may have influenced the observed LH pulse patterns.
The strikingly similar neuroendocrine abnormalities in FHH and HA suggest the possibility that pathophysiologic mechanisms in these two mirror phenotypes may be similar. It is well established that HA is caused primarily by hypothalamic GnRH deficiency (2, 3, 44, 45). However, the precise pathophysiologic mechanisms underlying the GnRH deficiency in FHH remain unclear. The normal E2 levels in the men with FHH suggest that GnRH suppression was not mediated by in vivo E2 levels. It has been previously shown that pulsatile GnRH treatment can rescue the HA phenotype (2, 44), and likewise, pulsatile GnRH can avert fasting-induced hypogonadotropism in men (49). Like HA in women, FHH in men appears to be reversible when the energy deficit state is removed. From a teleologic standpoint, HA in women represents an adaptive response in the face of nutritional or physical stress to save energy instead of using it for the energy-consuming process of pregnancy. However, it is unclear whether FHH in men may also represent a similar energy-sparing adaptive response. Although energy costs of fatherhood and raising children may have evolutionary and teleologic relevance for men, this hypothesis warrants additional investigation.
Hypogonadotropism in men is also known to occur in the context of acute starvation (19, 50) and critical illness (51). Similarly, HIV-related hypogonadism may also share some pathophysiologic features with FHH (e.g., undernutrition, weight loss). However, in contrast to FHH, patients with HIV also exhibit SHBG abnormalities and some may also display primary gonadal deficits (52). A previous study from Freidl et al. (19) demonstrated that acute starvation and high demands of physical exertion during training exercises can induce T levels that fall well below the normal range. In this acute model, refeeding rapidly returned T levels to the normal range. Furthermore, a study of acute starvation (72 hours) in healthy men showed decreased T levels resulting from lower LH pulse amplitude that can be restored by refeeding. Furthermore, leptin administration could not only restore but also prevent starvation-induced inhibition of the HPG axis (53). Thus, falling leptin levels appear to underlie the GnRH-deficient state induced by energy deficits. Indeed, in keeping with this notion, leptin administration has previously been shown to restore menstrual cyclicity for women with HA (54). Presumably, leptin administration could exert similar effects on men with FHH, yet this possibility was beyond the scope of the current investigation.
Importantly, although reversibility of HPG axis function has been previously shown for acute energy deficit states in men, our data suggest that in a chronic energy deficit model (i.e., FHH), T levels can be restored to normal levels when the precipitating trigger is alleviated. In women, suppressed HPG axis function and HA often appear as part of the female athlete triad (energy imbalance, amenorrhea, and osteoporosis). We assessed bone mineral density (BMD) in six men with FHH, all of whom had normal BMD at the hip. However, three men exhibited osteopenia in the lumbar spine (range, T = −1.4 to −1.6), presumably resulting from T deficiency. Similarly, a recent study by Hooper et al. (55) identified T levels <12 nmol/L (<346 ng/dL) in eight of nine distance runners, of whom three displayed osteopenia. However, as a group, their BMD did not differ from that of controls. Thus, it seems plausible that reduced BMD may also be a characteristic feature of the male FHH state. Because BMD was not systematically assessed in all 10 subjects studied herein, further investigation is warranted to clarify this question.
To date, no studies have specifically examined the effect of prolonged exercise excess or caloric deficit on spermatogenesis or Sertoli cell function (inhibin B levels). Although spermatogenesis was not systematically assessed in this retrospective FHH cohort, three men with FHH able to provide a sample had normal sperm counts (Table 1). However, serum inhibin B levels in three of four exhibited levels <92 pg/mL, a cutoff associated with increased risk for oligospermia (56). These varied findings probably reflect differing duration of hypogonadism before assessment of gonadal status (sperm count, inhibin B levels). Thus, given the incomplete data and variable duration of androgen deficiency, we cannot definitively state that gonadal status (spermatogenesis, inhibin B levels) is preserved in all men with FHH.
It has been previously shown that genetic variants in genes related to GnRH neuronal ontogeny are enriched in patients with HA (5). In this study, we screened for rare variants in a subset of genes linked to GnRH deficiency, and we identified two men with FHH harboring heterozygous variants in NSMF and CHD7, respectively. Both variants were predicted to be deleterious by in silico prediction programs. Both NSMF (57) and CHD7 (37) encode proteins that are known to play a critical developmental role in the GnRH network and have been implicated in patients with pubertal failure (Kallmann syndrome or idiopathic hypogonadotropic hypogonadism) (36). Both patients with FHH harboring genetic variants had normal timing of puberty, with normal smell testing, and presented only with FHH. However, it is well established that genetic variants linked to genes relating to GnRH deficiency can result in variable expressivity (36). Indeed, CHD7 rare variants have previously been associated with milder reproductive phenotypes such as self-limiting delayed puberty (58) and reversal of hypogonadotropic hypogonadism (59). Thus, it is plausible that the genetic variants discovered in this study could contribute to the FHH phenotype. However, given the small size and heterogeneity of the FHH predispositions, statistically rare variant enrichment was not feasible. However, the presence of a family history of HA in 2 of 10 men supports the notion of genetic susceptibility variants in FHH. However, determining the precise genetic contribution to FHH will require screening of a larger cohort of FHH for all known genes linked to GnRH deficiency and an unbiased genome-wide search for novel genes.
Relative strengths of this study include the detailed clinical evaluation of subjects with FHH, overnight neuroendocrine profiling, and longitudinal follow-up. In the current report, all 10 subjects with FHH exhibited pathognomonic symptoms of overt androgen deficiency. Although previous reports have described an “exercise hypogonadal male condition” (12, 13, 60), before this current report, only one study demonstrated clinically relevant symptoms (as assessed by the Aging Male Symptoms questionnaire) associated with serum T levels <12 nmol/L in eight of nine runners (ran 81 ± 14 km/wk over the past 12 months) (55). Our observations suggest that although FHH shares phenotypic and pathophysiologic similarities with HA, men appear to be much more resistant to HPG suppression secondary to energy deficit and intense exercise. However, the small number of subjects identified in this retrospective, single-center study design, with enrollment of cases and controls from independently recruited cohorts, represents a limitation for assessing the true prevalence of FHH in men. Thus, the findings of this report must be replicated by studies focused on FHH and its neuroendocrine correlates as their primary aim. Another limitation of this study is that gold standard liquid chromatography–mass spectroscopy was not used to measure sex steroids because of the limited sample availability given the long retrospective nature of the study. Additionally, a serum T threshold of 300 ng/dL was used to diagnose FHH in this report, whereas other community-based studies have used higher thresholds (e.g., 320 ng/dL) were used for diagnosing hypogonadism (61). However, because all subjects with FHH showed unequivocally low total serum T levels <200 ng/dL at presentation (Table 1), there was no misclassification of diagnosis with the <300 ng/dL threshold used in this study.
In summary, this study establishes FHH as a rare cause of GnRH deficiency in men secondary to excessive exercise or weight loss. FHH is characterized by distinct abnormalities of the neuroendocrine secretory patterns of GnRH-induced LH secretion, such as diminished LH pulse amplitude. Moreover, a subset of men exhibits a nocturnal entrained pattern of GnRH-induced LH secretion. Despite hypogonadism, seminiferous tubular function remains intact, with normal testicular volume and normal sperm counts. Much like women with HA, men with FHH can recover HPG axis function with removal of the energy deficit. Additional work is needed to investigate the genetic predisposition of men to FHH.
Acknowledgments
We thank the patients and the control subjects for their generous participation in this study. We also acknowledge the research nursing staff at the Mallinckrodt General Clinical Research Center for their collaboration and excellent patient care.
Financial Support: This work was supported by the Harvard Reproductive Sciences Center (grant P50 HD028138, to W.F.C.) from the Eunice Kennedy Shriver National Institute of Child Health and Development. R.B. is supported by the Eunice Kennedy Shriver National Institute of Child Health and Development (grants K23 HD077043 and R01 HD096324). S.B.S. is supported by the Eunice Kennedy Shriver National Institute of Child Health and Development (grant R01 HD043341).
Disclosure Summary: The authors have nothing to disclose.
Abbreviations:
- BMD
bone mineral density
- BMI
body mass index
- CV
coefficient of variation
- DXA
dual X-ray absorptiometry
- E2
estradiol
- FHH
functional hypogonadotropic hypogonadism
- HA
hypothalamic amenorrhea
- HPG
hypothalamo-pituitary-gonadal
- T
testosterone
- TV
testicular volume
