


Abstract
Nonalcoholic fatty liver disease (NAFLD) is a common obesity-associated pathology characterized by hepatic fat accumulation, which can progress to fibrosis, cirrhosis, and hepatocellular carcinoma. Obesity is associated with profound changes in gene-expression patterns of the liver, which could contribute to the onset of comorbidities.
As these alterations might be linked to a dysregulation of the splicing process, we aimed to determine whether the dysregulation in the expression of splicing machinery components could be associated with NAFLD.
We collected 41 liver biopsies from nonalcoholic individuals with obesity, with or without hepatic steatosis, who underwent bariatric surgery.
The expression pattern of splicing machinery components was determined using a microfluidic quantitative PCR-based array. An in vitro approximation to determine lipid accumulation using HepG2 cells was also implemented.
The liver of patients with obesity and steatosis exhibited a severe dysregulation of certain splicing machinery components compared with patients with obesity without steatosis. Nonsupervised clustering analysis allowed the identification of three molecular phenotypes of NAFLD with a unique fingerprint of alterations in splicing machinery components, which also presented distinctive hepatic and clinical-metabolic alterations and a differential response to bariatric surgery after 1 year. In addition, in vitro silencing of certain splicing machinery components (i.e., PTBP1, RBM45, SND1) reduced fat accumulation and modulated the expression of key de novo lipogenesis enzymes, whereas conversely, fat accumulation did not alter spliceosome components expression.
There is a close relationship between splicing machinery dysregulation and NAFLD development, which should be further investigated to identify alternative therapeutic targets.
Nonalcoholic fatty liver disease (NAFLD) is rapidly emerging as an important and growing health issue in western countries, as a result of the rising prevalence of obesity, type 2 diabetes, and metabolic syndrome (1). NAFLD is described as a range of liver disorders characterized by fat accumulation within the liver (steatosis), which is not related to alcohol consumption. These disorders comprise a wide range of diseases, from simple steatosis to hepatic inflammation and fibrosis [nonalcoholic steatohepatitis (NASH)], cirrhosis, and hepatocellular carcinoma (HCC) (2, 3). Although most patients with simple steatosis would remain stable, 10% to 15% with histologically proven NASH will progress to cirrhosis and HCC. Indeed, as a result of its high prevalence, NAFLD has emerged as a speedily growing cause of end-stage liver disease and HCC, in addition to hepatitis C, hepatitis B, and alcohol abuse (4, 5). Unfortunately, the molecular mechanisms underlying the heterogeneous outcomes of NAFLD remain unclear, precluding any attempt to anticipate the disease progression to decompensated cirrhosis or HCC (6). Within the natural history of NAFLD, hepatic steatosis is the first stage, wherein an improved understanding of the pathogenesis of liver steatosis would have a critical prognostic impact for preventing disease progression (7, 8). In this sense, whereas hepatic steatosis is closely associated with obesity, there is a meaningful percentage of people with obesity who have normal intrahepatic triglyceride content and appear to be resistant to developing obesity-related metabolic complications, including NAFLD (9). However, little is known about the mechanisms underlying the apparent resistance of this group of patients.
Several studies have demonstrated that NAFLD development and progression result from a combination of environmental and genetic factors (8, 10–12). Many of these studies have performed transcriptome profiling by microarray in humans with NAFLD and assessed changes in gene expression; however, most studies do not address changes in RNA alternative splicing. This process is of relevance, as numerous diseases course with a dysregulation in the process of alternative RNA splicing and as alterations in alternative RNA splicing are associated with inflammation, metabolic disorders, and cancer, which are critical hallmarks in the natural history of NAFLD (13–15). The splicing process is catalyzed by the minor and major spliceosomes, which act on different types of introns (13). The spliceosome is an intricate macromolecular complex whose functional core is comprised by several small nuclear ribonucleoprotein (snRNP) subunits that dynamically interact to regulate the splicing process. In addition, the activity of the spliceosome is modulated by many splicing factors that specifically recognize certain sequences in exons and introns (16). Consequently, the dysregulation of the expression and/or function of certain spliceosomal components may result into an aberrant splicing process (16).
In recent years, a growing body of evidence pinpoints an obvious association between several metabolism-related elements and processes of alternative splicing, which could represent potential tools for the translational research on NAFLD. Specially, genes linked to obesity are regulated by alternative splicing (17–20), and some studies have underlined the importance of splicing variants in NAFLD and NASH development (21, 22). The appearance of these aberrant alternative splicing variants might be linked to a dysregulation of the cellular machinery responsible for this process, including the spliceosome and splicing factors (13, 14, 23). Actually, some studies have found correlations in the expression levels between specific splicing isoforms and certain splicing factors in the context of obesity and diabetes (17, 24). Moreover, NAFLD and NASH are associated with changes in the mRNA expression of certain splicing factors in the liver of patients with obesity (10, 25–27).
Taken as a whole, the existing evidence suggests that the cellular machinery responsible for the catalysis and regulation of the splicing process (spliceosome components and splicing factors) could be dysregulated and associated with obesity-derived NAFLD, wherein we hypothesize that these alterations could be causally related to the development of NAFLD. Therefore, the aim of the current study was to implement a comprehensive approach to identify alterations in the expression of spliceosome components and splicing factors that could be associated to the development of hepatic steatosis in patients with obesity.
Materials and Methods
Patients and samples
All experimental protocols were carried out in accordance with approved guidelines of the Maimonides Institute for Biomedical Research of Córdoba/University Hospital Ethics Committees. Informed consent was obtained from all participants. Excessive alcohol consumption, as defined by a daily alcohol intake >20 g, was the main exclusion criterion. Liver biopsies were obtained during bariatric surgery from women with obesity [body mass index (BMI) > 30], with (n = 32) and without (n = 9) hepatic steatosis. The presence and grade of steatosis were assessed by the same operator using liver ultrasound. Patients were classified in the absence of steatosis (normal liver pattern), mild steatosis (increase in echoes of the liver parenchyma compared with the kidney cortex but with adequate visualization of vessels and diaphragm), moderate steatosis (increased fine echoes within the liver parenchyma with impaired visualization of vascular structures but not diaphragm), and severe steatosis (marked increase in echoes of the liver parenchyma with poor or no visualization of vascular structures, posterior right lobe, and diaphragm). The presence of fibrosis and inflammation was evaluated by liver histology by two experienced pathologists. Lipid content was also evaluated by liver histology; however, the result of these analyses did not completely match with the classification obtained according to liver ultrasound. In this sense, biopsy histology, considered the gold standard, has important limitations (28–31), including that it is not capable to evaluate the liver completely, and it is not suitable to be used to determine the follow-up of the patients, one of the main aims of this study. For these reasons—as one of the major aims of this study was to correlate the changes observed with the follow-up of the patients, and liver echography is also a well-recognized, established tool for the screening of fatty liver (31–33)—we used the classification established by liver echography. As NAFLD is a tremendously gender-dimorphic disease (34), and the gene-expression patterns in the liver are clearly gender dependent (35), in this study, only women were included, as they represented the vast majority of subjects undergoing bariatric surgery in our hospital during the study period.
RNA extraction and reverse transcription
Details regarding RNA extraction, quantification, and reverse transcription have been previously reported elsewhere by our group (36–38). Specifically, total RNA from liver samples was isolated using the AllPrep DNA/RNA/Protein Mini Kit, following the manufacturer’s protocol (Qiagen, Madrid, Spain), and RNA from the HepG2 cell line, using TRI Reagent (Sigma-Aldrich, Madrid, Spain), followed by DNase treatment. The amount and purity of RNA recovered were determined using the NanoDrop 2000 spectrophotometer (Thermo Fisher Scientific, Madrid, Spain). RNA (1 μg) was reverse transcribed to cDNA using the random hexamer primers and RevertAid First Strand cDNA Synthesis Kit (Thermo Fisher Scientific).
Analysis of splicing machinery components by qPCR dynamic array based on microfluidic technology
A 48.48 Dynamic Array (Fluidigm, San Francisco, CA), using a microfluidic-based technique for gene-expression analysis, was implemented to determine the expression of 48 transcripts in 48 samples simultaneously, as previously reported (39). Specific primers for human transcripts, including the components of the major (n = 13) and minor (n = 4) spliceosome, as well as associated splicing factors (n = 28) and three housekeeping genes (40), were specifically designed with Primer3 software and StepOne™ Real-Time PCR system software v2.3 (Applied Biosystems, Foster City, CA). Preamplification, exonuclease treatment, and quantitative (q)PCR dynamic array, based on microfluidic technology, were implemented following the manufacturer’s instructions using the Biomark System and Real-Time PCR analysis software (Fluidigm). Additional details are provided in del Rio-Moreno et al. (40). To control for variations in the amount of RNA used and the efficiency of the reverse-transcription reaction, the expression level of each transcript was adjusted by ACTB (silencing experiments in HepG2 cells) or by a normalization factor (NF) obtained from the expression levels of different housekeeping genes (ACTB and HPRT in human samples and GAPDH and HPRT in HepG2 cells) using Genorm 3.3 (41).
Real-time qPCR
qPCR reactions were carried out using the Stratagene Mx3000p system with the Brilliant III SYBR Green Master Mix (Stratagene, La Jolla, CA), as previously reported (36–38). The primers for human transcripts were designed and qPCR results generated, adjusted by an NF, as explained above. Specific primers for human transcripts for de novo lipogenesis enzymes genes are included in del Rio-Moreno et al. (40).
Cell culture and treatments
The human HepG2 cell line was purchased from the American Type Culture Collection (Manassas, VA; HB-8065) and maintained following the manufacturer’s instructions at 37°C and 5% CO2. This cell line was validated by the analysis of a short tandem-repeat analysis (GenePrint 10 system; Promega, Madrid, Spain) and routinely tested for mycoplasma contamination, as previously reported (42). To explore the modulation of the expression of key spliceosome components and splicing factors, 24-hour treatments with glucose (25 mM; Sigma-Aldrich), insulin (10 nM; Sigma-Aldrich), IGF-1 (10 nM, I3769; Sigma-Aldrich), leptin (10 ng/mL, 003-12; Phoenix Pharmaceuticals, Burlingame, CA), oleic acid (OA; 500 μM, O1383; Sigma-Aldrich), and palmitic acid (PA; 500 μM, P9767; Sigma-Aldrich) were performed. Doses were chosen based on previous studies (43, 44).
Transfection with specific siRNAs
To perform silencing experiments, specific small interfering RNAs (siRNAs) for the factors of interest were used (Thermo Fisher Scientific and Origene, Herford, Germany). A commercial negative control (scramble; Thermo Fisher Scientific) was used in all the experiments. For transfection assays, 200,000 cells were seeded in fetal bovine serum (FBS)-containing medium during 48 hours. Then, medium was replaced by antibiotic–antimycotic-free medium, and cells were transfected with 100 nM of each specific siRNA using the Lipofectamine RNAiMAX reagent (Thermo Fisher Scientific). After 48 hours, cells were detached and seeded to analyze in vitro lipid accumulation experiments or to extract RNA to validate the transfection efficiency and to determine the expression of key de novo lipogenesis enzymes (measured by qPCR).
Lipid accumulation experiments and Oil Red O staining in HepG2
HepG2 cells were treated with OA for two different purposes: (i) to assess the effect of the silencing of selected splicing machinery components on lipid accumulation or (ii) to evaluate the effect of lipid accumulation on the expression of the selected splicing machinery components. In brief, cells were seeded, and once 80% of cell confluence was reached, cells were cultured in FBS-free medium and 0.5% free fatty acid BSA for 1 hour. Then, HepG2 cells were treated with 500 μM OA in FBS-free medium and 2% BSA for 24 hours (for the silencing experiment in HepG2 cells) or 10, 24, and 48 hours (naive HepG2 cells). After the incubation time, medium was removed, and silenced cells were washed with PBS and fixed with 10% paraformaldehyde for 15 minutes, whereas naive HepG2 cells were lysed with TRIzol reagent to isolate RNA, as described above. Control cells were treated with OA-free medium. In silenced HepG2 cells, after removing paraformaldehyde, cells were washed and incubated with 60% isopropanol. Then, Oil Red O working solution was added for 10 minutes in agitation and washed. At this point, cells were examined under a light inverse microscope to acquire images. OD was measured at a wavelength of 520 nm in the FlexStation 3 system (Molecular Devices, Sunnyvale, CA).
alamarBlue assay
alamarBlue assay (Bio-Rad Laboratories, Madrid, Spain) was used to determine cell viability, as previously reported (42). In brief, cell viability was analyzed at 0 hours (before OA treatment) and 24 hours (after OA treatment and before Oil Red O staining) by measurement of fluorescent signal exciting at 560 nm and reading at 590 nm (FlexStation 3). Specifically, the day of the measurement, alamarBlue reduction was measured after cells were incubated for 3 hours with 10% alamarBlue/serum-free media.
Statistical and bioinformatical analysis
Data are expressed as means ± SEM or compared with the corresponding controls (set at 100%). Data were evaluated for heterogeneity of variance using the Kolmogorov–Smirnov test, and consequently, parametric (Student’s t) or nonparametric (Mann-Whitney U) tests were implemented to analyze the statistical differences. Heatmaps were generated using MetaboAnalyst 3.0 (45). Predictive models were constructed by Random Forest algorithm (with R language) as a classifier, followed by a leave-one-out crossvalidation using the full dataset of variables or a selection of them (obtained by feature-ranking processes), as described in del Rio-Moreno et al. (40). P values <0.05 were considered statistically significant. All statistics analyses were performed using GraphPad Prism 6.0 software (La Jolla, CA) (45).
Results
Patients and clinical correlations
Demographic and clinical features of the 41 patients included in the study (nine without and 32 with hepatic steatosis) are summarized in Table 1, whereas the same parameters in the patients with steatosis, according to the grade of hepatic steatosis, are shown in del Rio-Moreno et al. (40). In general, patients with steatosis presented higher levels of plasma alanine aminotransferase (P = 0.041), which validates the ultrasound diagnosis, and higher homeostatic model assessment for insulin resistance (HOMA-IR; P = 0.049) and fasting insulin levels (P = 0.049) compared with patients without steatosis. Within the patients with steatosis, HOMA-IR and total protein plasma levels were associated with the grade of steatosis (P = 0.03 and 0.007, respectively). Histology analysis revealed no signal of fibrosis or NASH. It should be noted that these patients presented an early stage of NAFLD, only with the presence of steatosis and not fibrosis, inflammation, or liver damage.
Demographic and Clinical Characteristics of the Patients Included in this Study
| Nonsteatosis | Steatosis | P Value | |
|---|---|---|---|
| Age, y | 37.00 ± 5.00 | 40.41 ± 1.77 | 0.425 |
| n = 9 | n = 32 | ||
| Body weight, kg | 125.60 ± 3.07 | 133.1 ± 3.58 | 0.292 |
| n = 9 | n = 32 | ||
| BMI, kg/m2 | 48.96 ± 0.92 | 50.63 ± 1.31 | 0.513 |
| n = 9 | n = 32 | ||
| WHR | 0.86 ± 0.02 | 0.91 ± 0.01 | 0.059 |
| n = 9 | n = 32 | ||
| HOMA-IR | 2.00 ± 0.48 | 5.00 ± 0.71 | 0.049 |
| n = 5 | n = 22 | ||
| Glucose, mg/dL | 101.70 ± 7.62 | 106.60 ± 3.33 | 0.125 |
| n = 9 | n = 32 | ||
| Insulin, mU/L | 9.44 ± 1.32 | 19.59 ± 2.29 | 0.049 |
| n = 5 | n = 22 | ||
| Glycated hemoglobin, % | 6.01 ± 0.44 | 6.181 ± 0.13 | 0.175 |
| n = 8 | n = 32 | ||
| GGT, U/L | 23.33 ± 2.11 | 38.94 ± 5.05 | 0.181 |
| n = 9 | n = 33 | ||
| ALT, U/L | 19.44 ± 2.76 | 28.19 ± 2.35 | 0.041 |
| n = 9 | n = 32 | ||
| AST, U/L | 17.11 ± 2.17 | 21.84 ± 1.76 | 0.202 |
| n = 9 | n = 32 | ||
| Alkaline phosphatase, U/L | 74.67 ± 2.54 | 78.75 ± 4.03 | 0.602 |
| n = 9 | n = 32 | ||
| Bilirubin, mg/dL | 0.60 ± 0.07 | 0.66 ± 0.05 | 0.835 |
| n = 8 | n = 27 | ||
| Direct bilirubin, mg/dL | 0.30 ± 0.04 | 0.27 ± 0.016 | 0.644 |
| n = 6 | n = 28 | ||
| Indirect bilirubin, mg/dL | 0.38 ± 0.05 | 0.37 ± 0.03 | 0.735 |
| n = 6 | n = 28 | ||
| HDL, mg/dL | 43.78 ± 4.89 | 41.50 ± 1.82 | 0.596 |
| n = 9 | n = 32 | ||
| LDL, mg/dL | 126.60 ± 11.38 | 136.10 ± 6.34 | 0.245 |
| n = 9 | n = 31 | ||
| Triglycerides, mg/dL | 103.30 ± 18.72 | 136.60 ± 19.81 | 0.215 |
| n = 9 | n = 32 | ||
| Cholesterol, mg/dL | 191.60 ± 11.97 | 204.20 ± 6.62 | 0.374 |
| n = 9 | n = 32 | ||
| Creatinin, mg/dL | 0.82 ± 0.16 | 0.69 ± 0.02 | 0.470 |
| n = 8 | n = 28 | ||
| CRP, mg/L | 8.45 ± 1.28 | 12.62 ± 1.89 | 0.476 |
| n = 9 | n = 27 | ||
| Total protein, g/dL | 6.95 ± 0.27 | 7.00 ± 0.08 | 0.817 |
| n = 9 | n = 32 | ||
| Albumin, g/dL | 3.98 ± 0.16 | 4.08 ± 0.06 | 0.451 |
| n = 9 | n = 32 | ||
| Haptoglobin, mg/dL | 158.50 ± 6.50 | 190.20 ± 8.24 | 0.065 |
| n = 8 | n = 31 |
Abbreviations: AST, aspartate transaminase; CRP, C-reactive protein; GGT, gamma-glutamyltransferase; HDL, high-density lipoprotein; LDL, low-density lipoprotein; WHR, waist/hip ratio.
Hepatic steatosis was associated with alterations in splicing machinery components
Dynamic qPCR array showed that livers from patients with steatosis showed a marked dysregulation of the expression levels of several (16 out of 45) spliceosomal components and splicing factors compared with livers from patients without steatosis (Fig. 1A), such as the snRNPs RNU6ATAC, RNU6, or RNU2 and the splicing factors PTBP1 or SRRM1 (Fig. 1B). Indeed, individual receiver operating characteristic (ROC) curve analyses of each of the altered elements revealed that the expression of these spliceosome components and splicing factors was clearly different between patients, with or without steatosis [Fig. 1B; specificity and sensitivity values for each ROC curve are shown in del Rio-Moreno et al. (40)]. Random Forest analysis demonstrated the existence of splicing machinery-associated molecular fingerprints that were significantly different between subjects with and without steatosis. Particularly, the combination of the expression levels of the factors PTBP1, SRRM1, RBM45, RNU4, and RNU6ATAC generated a ROC curve that was able to classify our cohort in patients with or without steatosis with an area under curve (AUC) of 0.960 (Fig. 1C). The validity and consistency of this and other splicing machinery-associated molecular fingerprints were demonstrated by crossvalidation analysis (Fig. 1C). A more detailed analysis demonstrated that alterations in the expression levels of the components of this machinery were not associated with the grade of steatosis, as a progressive dysregulation of these elements in individuals with different steatotic grades was not observed (Fig. 2).
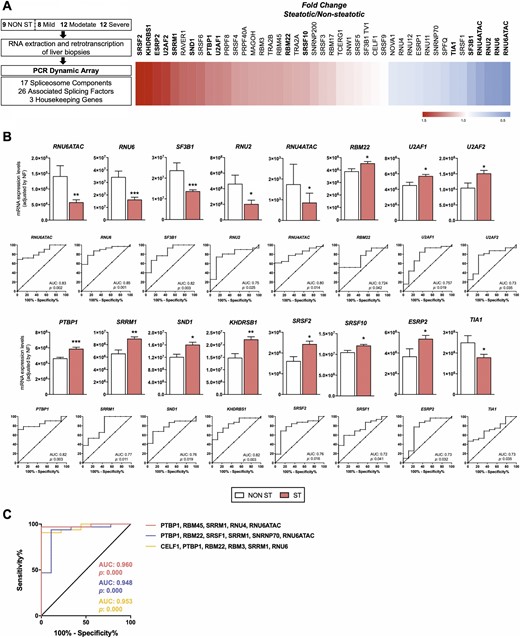
Differential expression of splicing machinery components in the liver of patients with and without steatosis with obesity. (A) Study design and pattern of dysregulation of spliceosome components and splicing factors in the liver of patients with and without steatosis with obesity. (Left) A graphical summary of the study design is shown. (Right) A schematic representation of fold-change levels of spliceosome components and splicing factors between the liver of patients with and without steatosis with obesity, represented in red (increase) or blue (decrease), is depicted. (B) Expression levels and receiver operating characteristic (ROC) curves of significantly altered spliceosome components and splicing factors in the liver of patients with obesity and steatosis compared with patients with obesity without steatosis. mRNA expression levels (adjusted by an NF, calculated from the expression level of HPRT and ACTB) of the different spliceosome components (first and second rows) and splicing factors (third and fourth rows) significantly altered in the liver of women with obesity with steatosis (ST) and without steatosis (NON ST). Values represent the means ± SEM. Asterisks indicate values that significantly differ from patients without steatosis (t test: *P < 0.05, **P < 0.01, ***P < 0.001). ROC curve analyses, to determine the accuracy of the components of the splicing machinery and splicing factors to discriminate between patients, with or without liver steatosis, are included below each graph. (C) ROC curves of subsets of spliceosome components and splicing factors generated by Random Forest computational algorithm, followed by crossvalidation analysis, considering the expression of a selection of the most relevant and discriminatory splicing machinery components. Specifically, three subset of specific splicing machinery components are included: PTBP1, RBM45, SRRM1, RNU4, and RNU6ATAC; PTBP1, RBM22, SRSF1, SRRM1, SNRNP70, and RNU6ATAC; and CELF1, PTBP1, RBM22, RBM3, SRRM1, and RNU6. AUC, area under curve.
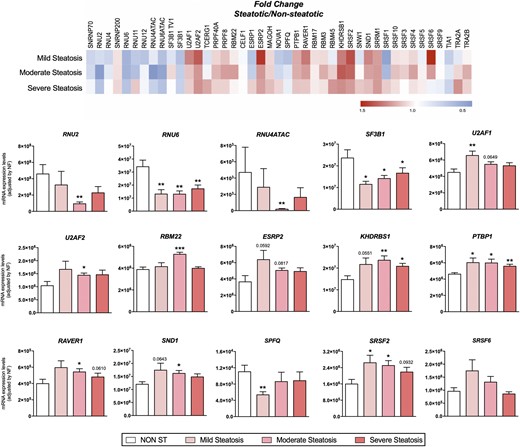
Pattern of dysregulation of spliceosome components and splicing factors in the liver of patients with and without steatosis with obesity, according to the grade of lipid accumulation. (Top) Fold-change expression levels among patients with different levels of steatosis compared with nonsteatotic livers, represented in red (increase) or blue (decrease). (Bottom) mRNA expression levels (adjusted by an NF calculated from the expression levels of HPRT and ACTB) of the different spliceosome components and splicing factors in the liver of women with obesity without steatosis (NON ST) and with three different levels of steatosis (mild, moderate, and severe). Values represent the means ± SEM. Asterisks indicate values that significantly differ from patients without steatosis (t test: *P < 0.05, **P < 0.01, ***P < 0.001).
Dysregulation of splicing machinery in steatotic condition could be associated with specific clinical alterations
Nonsupervised hierarchical analysis of patients with steatosis, according to the expression pattern of the spliceosome components and splicing factors, identified the existence of three distinct, molecularly defined groups of patients with steatosis (Clusters A, B, and C) who were grouped together by the presence of similar alterations in certain spliceosome components and splicing factors (Fig. 3A). These three molecularly defined clusters of patients with steatosis were characterized by alterations in the expression levels of key splicing machinery components, which were altered in one particular molecular cluster and could define a specific fingerprint (Fig. 3B). Indeed, patients in molecular Cluster A are defined by low levels of the spliceosome components RBM22, SNRNP200, SF3B1 tv1, PRPF40A, and PRPF8 and the splicing factors SRSF4, TRA2B, TIA1, SNW1, CELF1, and RBM3; patients in molecular Cluster B by high levels of the splicing factors RBM45 and TRA2A; and patients in molecular Cluster C by high levels of the spliceosome components RNU6ATAC, RNU4, RNU11, RNU2, RNU12, U2AF2, TCERG1, RNU4ATAC, SF3B1, and RNU6 and the splicing factors SND1, RAVER1, SRSF2, and ESRP2 and low levels of SRSF1, NOVA1, and ESRP1. In this sense, a combination of the expression levels of seven of these factors [two of them characterizing Cluster A (SRSF4 and TRA2B), two characterizing Cluster B (RBM45 and TRA2A), and three characterizing Cluster C (SND1, RAVER1, and RNU6ATAC)] was able to classify patients perfectly in one of the three clusters using the Random Forest algorithm, followed by a crossvalidation analysis (AUC = 1, P < 0.001).
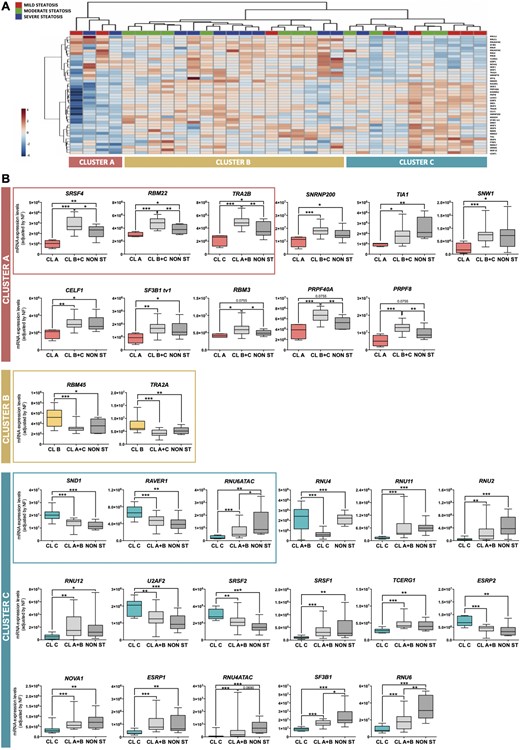
The expression of splicing machinery components is differentially altered in the liver of individuals with steatosis. (A) Unsupervised clustering analysis of the expression levels of the splicing machinery in patients with steatosis. This bioinformatic approach identified three molecularly defined populations of patients with steatosis (Clusters A, B, and C). (B) Specific changes of certain components of the splicing machinery defined each cluster of patients with steatosis. The three molecularly defined clusters of patients with steatosis were associated with the alteration in the expression of certain spliceosome components and splicing factors compared with patients without steatosis or included in the other clusters. The alteration of selected factors (within the frame) was able to classify patients in the three clusters with an AUC of 1, using the classification algorithm Random Forest. Data indicate mRNA expression levels (adjusted by an NF calculated from the expression level of HPRT and ACTB) in each cluster (A, B, and C) compared with the rest of patients, with and without steatosis (NON ST). Values represent the means ± SEM. Asterisks indicate values that significantly differ between groups (t test: *P < 0.05, **P < 0.01, ***P < 0.001).
Remarkably, the patients within each cluster were characterized by certain hepatic and clinical-metabolic alterations (Fig. 4). Thus, patients grouped in Cluster A (n = 4) exhibited elevated glucose and haptoglobin levels compared with the rest of patients with steatosis (Clusters B + C) and controls without steatosis. Cluster B (n = 17) presented high triglycerides and gamma-glutamyltransferase (GGT) plasma levels, as well as low alkaline phosphatase levels, compared with patients belonging to Clusters A + C or without steatosis. Finally, patients in Cluster C (n = 11) showed increased insulin, ALT, and aspartate aminotransferase (AST) levels. In addition, patients included in Cluster C seemed to present a worsened biochemical and hepatic response to bariatric surgery after 1 year. These patients presented a differential response to bariatric surgery after 1 year of follow-up, inasmuch as only 70% of the patients included in Cluster C (seven out of 10) presented a total recovery from hepatic steatosis (determined by liver ultrasound) compared with 86% of patients included in Clusters A and B (12 out of 14), although this difference did not reach statistical significance (Fig. 5). In addition, patients included in Cluster C exhibited a differential response, 1 year postsurgery, in terms of normalization of GGT, glucose, triglycerides, alkaline phosphatase, and high-density lipoprotein (HDL) plasma levels compared with patients included in Clusters A and B, although only GGT and glucose differences reached statistical significance (Fig. 5). It should be noted that all patients similarly decreased BMI and waist/hip ratio (WHR) without differences between clusters.
![Each molecularly defined population of patients with steatosis [Clusters (CL) A, B, and C] was characterized by certain hepatic and clinical-metabolic alterations. Relevant clinical parameters associated to each cluster of patients were grouped according to their expression levels of the spliceosome components and splicing factors. Values represent the means ± SEM. Asterisks indicate values that significantly differ between groups (t test: *P < 0.05, **P < 0.01). AST, aspartate transaminase; GGT, gamma-glutamyltransferase; NON ST, without steatosis.](https://oup.silverchair-cdn.com/oup/backfile/Content_public/Journal/jcem/104/8/10.1210_jc.2019-00021/1/m_jc.2019-00021f4.jpeg?Expires=1749963953&Signature=HUqKwhhkOpvmOFUMVZHbNnhfZWNGGcxlbUqo3~kjwgqNArFSOSA8WtfGUHOrW~rhOoQwhjHMOJfAANsjF772oRPDXkEp1e1CSr4eDiLRiWJE3GOJH9A6t1A0XvzVDq3eNryWoKK6kNAxQfkUAggFcL74CnvhjDpj4wtWw-MD9hU5rt9hrQep3gP~SAA5fVT9TrzZJJEvSkdiqhQiEhoxlVmt1e943jlfHApEG~1YtZZSEvznYuBcXqsOSHdozgJtq1M3Vh4hKFioiq0fP-rcXc9Vk3AVgRLiEWBVkXKUxPAQM0saDVWzBahbLufu9rOcb3wvw0X0BHb99QU89UuuDQ__&Key-Pair-Id=APKAIE5G5CRDK6RD3PGA)
Each molecularly defined population of patients with steatosis [Clusters (CL) A, B, and C] was characterized by certain hepatic and clinical-metabolic alterations. Relevant clinical parameters associated to each cluster of patients were grouped according to their expression levels of the spliceosome components and splicing factors. Values represent the means ± SEM. Asterisks indicate values that significantly differ between groups (t test: *P < 0.05, **P < 0.01). AST, aspartate transaminase; GGT, gamma-glutamyltransferase; NON ST, without steatosis.
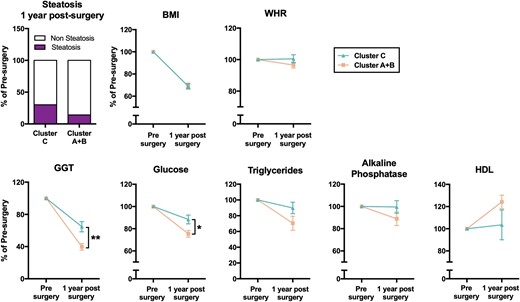
Cluster C presented a worst response to bariatric surgery after 1 year of follow-up. Recovery from hepatic steatosis and evolution of BMI, waist/hip ratio (WHR), GGT, glucose, triglycerides, alkaline phosphatase, and high-density lipoprotein (HDL) levels, 1 year after bariatric surgery in patients from Cluster C vs Clusters A + B. The data are expressed as percentage of the value before surgery (normalized to 100%). Values represent the means ± SEM. Asterisks indicate values that significantly differ between Cluster C and Cluster A + B (t test: *P < 0.05, **P < 0.01).
Alterations in splicing machinery components influenced lipid accumulation and de novo lipogenesis in HepG2 cells
Several spliceosome components and splicing factors were selected for functional analysis in the HepG2 cell line, based on the altered expression in the whole population of patients with steatosis (PTBP1) or in a particular cluster of patients with steatosis [SRSF4, RBM22 (Cluster A); RBM45 (Cluster B); SND1 and RAVER1 (Cluster C)]. Remarkably, lipid accumulation in HepG2 cells induced by OA overload, which was validated by Oil Red O absorbance (Fig. 6A), did not alter the expression of any of the factors selected for functional analysis, except for a slight decrease in SND1 after 10 hours of treatment (Fig. 6B). In contrast, the silencing of the selected splicing factors using specific siRNAs (Fig. 6C), significantly altered lipid accumulation after treatment with OA (Fig. 6D). This approach demonstrated that the modulation (silencing) of certain selected factors altered lipid accumulation, as the percentage of fat accumulation after OA treatment was lower in those cells compared with the percentage of OA accumulation in negative control cells (Fig. 6D) without any obvious influence of cell viability (40). In addition, the silencing of RBM22 and SND1 produced a decrease in the expression levels of FASN and SCD with no major substantial changes in the expression levels of other enzymes implicated in de novo lipogenesis (40).
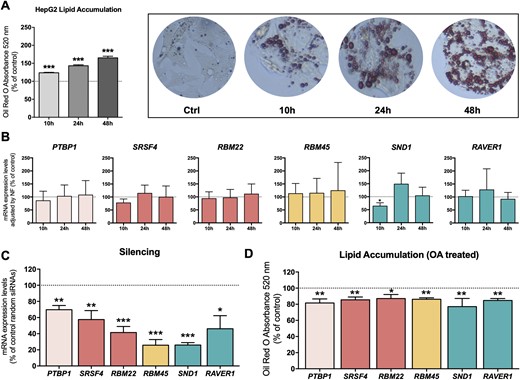
Modulation of splicing machinery components influenced lipid accumulation in HepG2 cells. (A) Validation of lipid accumulation in HepG2 cell lines by Oil Red O absorbance at 520 nm. Data are expressed as a percentage of the control (Ctrl; normalized to 100%). Asterisks indicate values that significantly differ from control cells (t test: ***P < 0.001). (B) Effect of lipid accumulation on the expression of certain spliceosome components and splicing factors at 10, 24, and 48 hours. mRNA expression levels (adjusted by an NF calculated from the expression level of HPRT and GAPDH) of the different spliceosome components and splicing factors in HepG2 cells treated with 500 µM OA. The data are expressed as a percentage of the control (normalized to 100%). Values represent the means ± SEM (n = 5). (C) qPCR validation of the silencing with specific siRNAs. mRNA expression levels adjusted by the expression level of ACTB. Data are expressed as a percentage of control random siRNAs (Scramble; set at 100%). (D) Effect of silencing of certain splicing factors in HepG2 cells on lipid accumulation determined by Oil Red O absorbance at 520 nm. Data are expressed as percentage of the control (normalized to 100%). Values represent the means ± SEM (n = 5; t test: *P < 0.05, **P < 0.01, ***P < 0.001).
Metabolic factors modulated the expression of key splicing factors
In vitro analysis in HepG2 cells showed that the expression of the key splicing machinery components selected above could be modulated in response to metabolic factors, such as glucose, leptin, PA, or IGF-1. Specifically, glucose treatment significantly decreased the expression of SND1, and leptin decreased the expression of RBM22, whereas IGF-1 treatment significantly increased the expression of RAVER1. However, insulin did not modulate the expression of any of these selected splicing factors. Finally, whereas OA treatment could not modulate the expression levels of any of these factors (as shown before), PA produced an increase in the expression of PTBP1 and RBM22 (40).
Discussion
Our study represents a comprehensive approximation for the understanding of the molecular dysregulations underlying the development of NAFLD in patients with obesity compared with patients with obesity but without steatosis. Indeed, we have shown that the livers of patients with steatosis with obesity exhibit an overt but differential (patient-dependent) alteration of the cellular machinery responsible for the regulation of the splicing process (spliceosome components and splicing factors). The clinical correlations, together with the in vitro studies, suggest that the dysregulation of certain spliceosome components and splicing factors could be causally linked to the development of hepatic steatosis and would be associated with specific NAFLD-related clinical complications (hyperinsulinemia, ALT levels, etc.), as well as with hepatic and biochemical improvements after bariatric surgery.
A growing body of evidence suggests that aberrant pre-mRNA splicing processes in the liver play an important role in the pathogenesis of NAFLD and NASH. Indeed, previous studies using microarray approaches have found an association between these liver disorders and changes in splicing-factor expression, which could, thus, contribute to alterations in normal RNA splicing (6, 10, 27, 46, 47). Nevertheless, most studies have been focused on the consequences of changes in specific mRNA splicing variants (17, 24). In the current study, we have provided a proof-of-concept that alterations in the expression of spliceosome components and splicing factors are associated to the development of hepatic steatosis in patients with obesity, including the main components of the spliceosome core (RNU2, RNU6, SF3B1, RNU6ATAC, or RNU4ATAC) and a representative set of splicing factors (PTBP1, SRRM1, SND1, or SRSF2) involved in the process. Some of these altered splicing factors have been previously related to liver development and metabolism, as is the case of the polypyrimidine tract-binding protein PTBP1 (HNRNPI), which has been shown herein to be increased in the liver of patients with steatosis and has been reported to regulate the splicing of the fatty acid desaturase genes 2 and 3 (FADS2 and FADS3) that are implicated in fatty acid elongation and desaturation (48), and multiple genes involved in cholesterol synthesis and uptake, including LDLR, MVK, HMGCS1, and PSCK9 (49). Furthermore, studies in staphylococcal nuclease and tudor domain containing 1 (SND1) protein in rats have indicated that steatogenic conditions promote SND1 action on low-density lipid droplets (50). However, we describe herein a dysregulation in some elements of the spliceosome core (snRNPs) that are essential for the appropriate recognition of intron sequences and the assembly of spliceosomes to initiate the splicing process (16). These results show that a spliceosome-associated molecular fingerprint is able to discriminate between steatotic and nonsteatotic livers in patients with obesity (with AUC > 0.96). The fact that spliceosome alterations were not associated with the grade of hepatic steatosis suggests their role as triggers for initiating fat deposition within the liver. Indeed, the in vitro results suggest that alterations in spliceosome components and/or splicing factors could precede the development of hepatic steatosis in patients with obesity, as the modulation of the expression of PTBP1, SRSF4, RBM22, RBM45, SND1, and RAVER1 lowered lipid accumulation in a well-established hepatocyte cell line model (HepG2 cells) (51), whereas an exogenous overload of lipids (OA) was not able to alter the expression of the mentioned spliceosome components and/or splicing factors. Remarkably, our results also indicate that the dysregulations in the expression of certain spliceosome components and/or splicing factors could have an impact on other key hepatic processes, inasmuch as silencing of RBM22 and SND1 decreased the expression of FASN and SCD enzymes, indicating a possible connection between the dysregulation of some of the splicing factors studied herein and de novo lipogenesis in the liver. In fact, it has been described that the inhibition of SRPK2, a regulator of the splicing factors RNA-binding SR proteins, results in intron retention and mRNA instability of lipogenic genes (52). It is also worth noticing that although OA treatment did not alter the expression of these splicing machinery components, other metabolic factors, such as glucose, leptin, IGF-1, or PA, modulated the expression of some of these key factors, suggesting a possible association among these metabolic factors, the dysregulation of specific spliceosome components, and the development of NAFLD in patients with obesity. In this sense, several studies have previously shown a regulation of specific splicing factors by metabolic factors. It has been postulated that nutrients can modulate processes required for cell homeostasis through the alteration of gene expression and the splicing of pre-mRNAs, encoding key regulatory proteins (e.g., insulin receptor, leptin receptor) (53). For example, it has been described that glucose can regulate the expression of the splicing factor MBNL1 (54). Furthermore, the splicing of the FADS3 has been observed to be modulated in the liver of baboons in response to different diets and in HepG2 cells after treatment with polyunsaturated fatty acids (55). This is especially important, as the role of spliceosome in early NAFLD makes it attractive to investigate further derived screening strategies and preventive therapeutic targets.
Our results also pinpoint a putative association between changes in the expression of certain spliceosome components and splicing factors and NAFLD-associated comorbidities (hyperinsulinemia, ALT/AST levels, etc.) and with the biochemical response to bariatric surgery. Indeed, the expression pattern of the spliceosome components and splicing factors analyzed herein seemed to identify three discrete molecularly defined subpopulations of patients with steatosis with obesity, characterized by the dysregulated expression of certain spliceosome components and splicing factors, associated to specific clinical characteristics, and also with a differential response to bariatric surgery after 1 year. In particular, patients included in Cluster A, who were mainly characterized by altered expression of SRSF4, RBM22, and TRA2B compared with nonsteatotic and Clusters B and C patients with steatosis, presented an increase in glucose plasma levels, indicating a possible relationship between this splicing factor and glucose homeostasis. Indeed, one of the splicing factors dysregulated in this cluster of patients (TRA2B; also named SRFS10) has been previously described in relation to obesity, wherein TRA2B seems to be downregulated in liver samples from insulin-resistant humans with obesity (25). Similarly, patients in Cluster B were characterized by altered hepatic expression of RBM45 and TRA2A and presented higher triglycerides and GGT levels at the diagnosis. This represents a very interesting finding, inasmuch as hepatic TRA2A has been found to be modulated in response to estrogens to control the alternative splicing of Class B scavenger receptors BI (SR-BI) and BII (SR-BII) (56), which are crucial players in the hepatic uptake of triglycerides (57). Finally, patients with obesity included in Cluster C presented elevated levels of insulin and aminotransferases and a differential evolution of biochemical parameters and of the recovery in the grade of steatosis after bariatric surgery. Interestingly, SND1, one of the splicing factors whose expression alteration characterized Cluster C, is a splicing factor associated to the physiological function and pathological transformation of the liver (50, 58). Indeed, hepatic SND1 has been shown to be associated to different aspects of lipid metabolism in the liver and with the development of hepatic steatosis (50). Hence, these results, together with the in vitro results discussed above, suggest that the dysregulation of certain spliceosome components and/or splicing factors could also be involved in the promotion of the development of NAFLD and predisposition of the patients to specific NAFLD-associated comorbidities.
Altogether, our present results demonstrate a relationship between the dysregulation of splicing machinery and the development of NAFLD and its associated metabolic comorbidities, as well as with the biochemical improvement after bariatric surgery. These findings shed light to the possible underlying molecular mechanisms responsible for the development of hepatic steatosis in patients with obesity and thus, provide information to explore the development of efficient screening strategies and diagnostic, prognostic, or therapeutic tools for obesity-related NAFLD, which is becoming one of the main sources of morbidity and mortality in developed countries.
Acknowledgments
Financial Support: This work was funded by Instituto de Salud Carlos III and co-funded by European Union (ERDF/ESF, “Investing in your future,” PI17/002287, PI16/00264, PIE14/00005, CP15/00156); MINECO (BFU2016-80360-R, TIN2017-83445-P); Junta de Andalucía (BIO-0139, CTS-1406, PI-0541-2013); and CIBERehd and CIBERobn. (CIBER is an initiative of Instituto de Salud Carlos III, Ministerio de Sanidad, Servicios Sociales e Igualdad, Spain.) Financial support was also provided by Development Merit Award (BX001114) and U.S. National Institutes of Health (Grant R01DK088133 to R.D.K.).
Disclosure Summary: The authors have nothing to disclose.
Abbreviations:
- ALT
alanine aminotransferase
- AST
aspartate aminotransferase
- AUC
area under curve
- BMI
body mass index
- FBS
fetal bovine serum
- GGT
gamma-glutamyltransferase
- HCC
hepatocellular carcinoma
- HDL
high-density lipoprotein
- HOMA-IR
homeostatic model assessment for insulin resistance
- NAFLD
nonalcoholic fatty liver disease
- NASH
nonalcoholic steatohepatitis
- NF
normalization factor
- OA
oleic acid
- PA
palmitic acid
- q
quantitative
- ROC
receiver operating characteristic
- siRNA
small interfering RNA
- snRNP
small nuclear ribonucleoprotein
- WHR
waist/hip ratio
