


Abstract
During puberty, LH pulse frequency increases during sleep; in women, LH pulse frequency slows during sleep in the early/middle follicular phase (FP) of the menstrual cycle. The origin and significance of this developmental transition are unknown.
To determine the relationship between progesterone (P4) exposure, sleep-related slowing of LH pulses in the FP, and the intercycle FSH rise, which promotes folliculogenesis, in early postmenarchal girls.
23 girls (gynecologic age 0.4 to 3.5 years) underwent hormone measurements and pelvic ultrasounds during two consecutive cycles and one frequent blood sampling study with concurrent polysomnography during the FP.
Subjects demonstrated one of four patterns during cycle 1 that represent a continuum of P4 exposure: ovulatory cycles with normal or short luteal phase lengths or anovulatory cycles ± follicle luteinization. Peak serum P4 and urine pregnanediol (Pd) in cycle 1 were inversely correlated with LH pulse frequency during sleep in the FP of cycle 2 (r = −0.5; P = 0.02 for both). The intercycle FSH rise and folliculogenesis in cycle 2 were maintained after anovulatory cycles without P4 or Pd exposure or nocturnal slowing of LH pulse frequency in the FP.
During late puberty, rising P4 levels from follicle luteinization and ovulation may promote a slower LH pulse frequency during sleep in the FP. However, a normal FSH rise and follicle growth can occur in the absence of P4-associated slowing. These studies therefore suggest that an immature LH secretory pattern during sleep is unlikely to contribute to menstrual irregularity in the early postmenarchal years.
Reactivation of the GnRH pulse generator at puberty, marked by an increase in serum LH, is initially detectable only during sleep (1). Both LH pulse amplitude and frequency increase during sleep, and LH pulses coincide with periods of slow-wave sleep (SWS) (2), suggesting a specific role for SWS (3). However, cross-sectional studies in peripubertal to early postmenarchal girls demonstrate that the relationship between sleep/wake state and LH pulses (a marker of antecedent GnRH pulses) evolves during the pubertal transition (4, 5). By late puberty, a new pattern emerges that will continue into adulthood, characterized by sleep-specific slowing of LH pulse frequency during the early/middle follicular phase (FP) of the menstrual cycle (6). In striking contrast to early puberty, SWS inhibits LH secretion in adult women, and LH pulses typically occur only after brief periods of wakefulness during the night (7).
The cause of sleep-related slowing of pulsatile LH secretion during the FP is unknown. Progesterone (P4) is an obvious candidate because it is the primary regulator of LH pulse frequency in adult women (8–10). Studies in early to midpubertal girls (11), postmenarchal girls (12), and adults (13) found that pharmacologic doses of P4 did not acutely suppress LH pulse frequency during sleep in the FP. However, it remains possible that during natural ovulatory cycles, when a longer duration of P4 exposure (luteal phase) is followed by a period of P4 withdrawal (FP), P4 may influence nocturnal LH pulse frequency. Studies in normal women (14) have demonstrated a progressive decline in LH pulse frequency across the luteal phase, rather than a nadir in the midluteal phase coinciding with peak P4 levels, suggesting that the duration of exposure to P4 is an important element in LH pulse frequency regulation. Another observational study in women with polycystic ovarian syndrome (PCOS) found that those who recently ovulated, and hence were recently exposed to P4, had a lower nighttime LH pulse frequency than those who were anovulatory (15). Interventional studies in both normal women and women with PCOS have also shown that nocturnal LH pulse frequency decreases not only during treatment with estrogen and P4 but also 7 days later, when serum P4 is no longer detectable (16, 17). Thus, during late puberty, an increase in P4 levels (18) from follicular luteinization or ovulation may influence nighttime LH secretion during the FP. However, the persistence of sleep-related slowing in postmenopausal women (19) suggests that there may also be mechanisms independent of sex steroids.
The functional significance of the nocturnal slowing of GnRH pulses during the FP is also unclear. A slower GnRH pulse frequency at night has been postulated to maintain FSH synthesis and provide the critical level of FSH needed for folliculogenesis in the FP (7, 14). Ovulation induction studies (20) and studies in normal women (21) and in GnRH-deficient women (22) have demonstrated the importance of the nearly fourfold rise in FSH, which commences in the late luteal phase and extends into the mid-FP of the next cycle, in establishing a normal tempo of follicular maturation and sex steroid synthesis. Although there has been no investigation into the effect of GnRH pulse frequency manipulation during sleep or of controlled sleep disruption on FSH patterning in women, the observation that women with abnormal sleep structure (sleep apnea or shift work) have lower sex steroids or prolonged FPs supports the hypothesis that nocturnal slowing of GnRH pulses during the FP is clinically relevant rather than coincidental (23, 24). These findings in adult women also raise the possibility that a similar deviation from the normal day/night patterning of LH and FSH secretion may contribute to the cycle irregularity that is common among adolescent girls in the early postmenarchal years (25).
The current studies were therefore designed to test the hypothesis that in early postmenarchal girls, inadequate exposure to P4 (in the setting of recurrent anovulatory cycles) precludes sleep-related slowing of GnRH pulses and the increase in FSH that normally occur in the FP of the subsequent menstrual cycle, thereby perpetuating abnormal cycle dynamics in girls.
Materials and Methods
Subjects
The characteristics of this cohort of 23 adolescent girls, aged 12.8 to 17.6 years, have been previously described (26). Briefly, subjects were healthy girls recruited from the greater Boston area. Subjects were racially diverse (15 white, 5 black, 3 Asian; 25% Hispanic). Five subjects (22%) were overweight, and nine subjects (39%) were obese. Subjects had Tanner V breast development and were 0.4 to 3.5 years postmenarchal. All subjects had normal thyroid, prolactin, and androgen levels (27) as determined at the screening visit; were nonhirsute (Ferriman-Gallwey score <8); did not exercise excessively; had no known eating disorder; and did not smoke. Subjects were not on any medications known to interfere with reproductive hormones and had never been treated for a menstrual condition.
The Partners Human Research Committee approved the study, and signed informed assent and consent were obtained from each subject and her parent, respectively.
Protocol
Cycle monitoring
The experimental protocol for cycle monitoring has been previously described (26). Briefly, hormones were measured during two consecutive menstrual cycles (from approximately cycle day 10 in cycle 1 to cycle day 20 in cycle 2; Fig. 1), from either blood [for LH, FSH, estradiol (E2), P4], dried blood spots (for LH, FSH), or dried urine [for E2, pregnanediol (Pd)] samples. FSH and LH levels from dried blood spots and E2 levels from urine samples were converted to serum equivalents (26). Because urine Pd did not correlate well with serum P4, particularly at low serum levels (0 to 2 ng/mL), progesterone exposure was expressed as either serum P4 or urine Pd (26). Total testosterone (TT) was measured at the screening visit. Subjects underwent two to five transabdominal pelvic ultrasounds per cycle to monitor follicle growth and document ovulation.
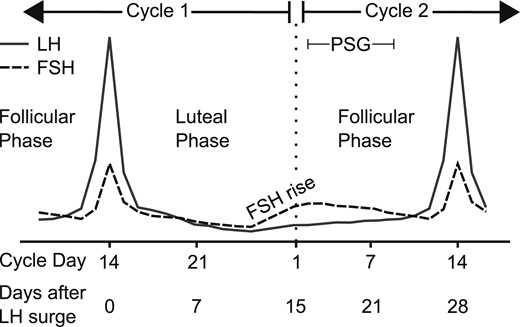
Study protocol schema. Subjects were monitored during specific phases of two consecutive menstrual cycles. In this hypothetical subject, an LH peak on cycle day 14 was followed by a 14-day luteal phase (28-day cycle), and monitoring continued into the late follicular phase of cycle 2 (cycle day 14 or 28 days since cycle 1 LH peak). Intercycle FSH dynamics were determined after centering to days since the LH peak in cycle 1 and excluding the midcycle FSH peak in cycle 2. A sleep study with concurrent frequent blood sampling was performed between days 2 and 9 of cycle 2. Solid line, LH; dotted line, FSH. PSG, polysomnography.
Sleep studies
In the early to middle FP of cycle 2 (cycle day 6.3 ± 0.4; range 2 to 9), subjects were admitted to the Clinical Research Unit at Massachusetts General Hospital for an overnight sleep study with polysomnography (PSG) and concurrent frequent blood sampling (Fig. 1). PSG (Alice LE PSG system, Sleepware software, Phillips Respironics, Murrysville, PA) was performed according to standard methods (28). In three subjects, sleep/wake state was monitored with a wireless wrist actigraph (ActiSleep+ monitor, ActiGraph, Pensacola, FL) because the PSG equipment was unavailable. All monitoring began before lights out and continued until natural awakening (06:00 to 08:30). Lights were turned off between 21:30 and 23:00, based on the subject’s habitual bedtime. Blood (2 to 3 cc) was sampled every 10 minutes for 8 hours through an IV catheter from outside the sleep room with a blood-sparing technique, as previously described (19), beginning 30 minutes to 1 hour before lights out. One subject did not complete the inpatient admission because of a scheduling conflict. Subjects took daily iron supplements to prevent anemia, and hemoglobin was monitored before and after the sleep study and at two additional time points during menstrual cycle monitoring, as described above.
Assays
Serum was analyzed for LH, FSH, E2, P4, and TT via a chemiluminescent microparticle immunoassay (Architect; Abbott Diagnostics, Abbott Hills, IL) (3). The E2 and TT assays have been calibrated against liquid chromatography/tandem mass spectrometry (LC/MS) (29, 30). Reanalysis of 23 samples with P4 of 0.4 to 10.3 ng/mL via LC/MS (Esoterix Inc, Endocrine Sciences, LabCorp, Calabasas Hills, CA) demonstrated a tight correlation between LC/MS and chemiluminescent microparticle immunoassay methods (26). Urine Pd was determined via gas chromatography tandem mass spectrometry (Agilent 7000B). Assays conducted with dried blood spots and dried urine strips were performed at ZRT Laboratory (Beaverton, OR), as previously described (31–33).
Menstrual cycle classification
Cycles were determined to be ovulatory if they met all of the following criteria: a midcycle LH peak, a preovulatory E2 peak, and a serum P4 >1.65 ng/mL or urine Pd >390.5 µg/g Cr (26). The day of ovulation was determined based on the midcycle LH, FSH, and E2 peaks, changes in P4 or Pd levels, and follicle collapse on ultrasound, as previously described (26). The length of the FP was calculated as the number of days from menses up to and including the estimated day of ovulation. The length of the luteal phase was calculated as the number of days after ovulation until the day before the next menses. Ovulatory cycles with a short luteal phase were defined as those with a luteal phase lasting <10 days (34, 35). In anovulatory cycles, follicle luteinization was defined as a serum P4 ≥1 ng/mL [based on average P4 within 36 hours of LH surge initiation in adults (36)] or a threefold rise in urine Pd above the mean FP level (37), and the length of the FP was equal to total cycle length.
Sleep scoring
A registered PSG technician visually scored all PSG recordings according to American Academy of Sleep Medicine criteria (28) in 30-second epochs as stages of non–rapid eye movement (NREM) (N1, N2, or N3), REM, or wake. Actigraph data were expressed as activity counts per 1-minute epoch via ActiLife software version 6.10.2 (Actigraph, Pensacola, FL). Each epoch was defined as sleep or wake according to the Sadeh algorithm (38). Awakenings were defined as any ≥30-second epoch of wakefulness after an epoch of sleep, as previously described (39). The number of awakenings was adjusted for intersubject differences in sleep duration by dividing by total sleep time.
Statistical analysis
Pulsatile LH secretion during sleep and sleep architecture
Pulsatile LH secretion was analyzed with a validated modification of the Santen and Bardin method of pulse detection (40, 41). LH pulse onset was defined as the pulse nadir. LH pulse frequency in a given sleep stage was calculated as the number of LH pulse nadirs occurring in that stage divided by the time spent in that sleep stage during the 8 hours of sampling. Sleep records were aligned to the LH pulse nadir to determine the predominant sleep stage in the 10 minutes before each pulse, as previously described (2, 7). Stepwise linear regression was used to identify predictors of LH pulse frequency or LH pulse amplitude during sleep in the FP including days since cycle 1 LH peak, E2 levels during sleep, body mass index (BMI) z score, baseline TT level, and serum P4 or urine Pd. LH pulse frequency in each sleep stage, corrected for the time spent in that stage during the 8 hours of sampling, was log-transformed and compared via repeated-measures one-way ANOVA with sleep stage as the within-subject factor. The amplitude of LH pulses before sleep onset and the LH pulses during sleep were compared for each subject via paired t tests. Mean LH pulse amplitude during sleep was compared in adolescent subgroups and in adults via one-way ANOVA. The relationship between sex steroids and sleep parameters was assessed via Pearson correlation coefficient.
Modeling the intercycle FSH rise
We hypothesized that escape from greater P4 negative feedback (i.e., higher luteal P4 or Pd levels) would lead to a more robust increase in FSH during the luteal-follicular transition (Fig. 1) and ultimately to faster follicle recruitment and growth in the subsequent cycle. We quantified the FSH rise by using the slope of the intercycle FSH rise, the maximum FSH level, and the number of days FSH was maintained above the “FSH threshold” (see below). To compare intercycle FSH dynamics across subjects, we modeled all FSH data starting on the day of the LH peak in cycle 1 (day 0) and continuing for 19 to 28 days (to cycle day 9 to 20 in cycle two) to exclude the midcycle FSH peak in cycle 2. In anovulatory cycles, midcycle (day 0) was determined by using the LH peak (when present) or the day with the highest LH level, highest E2 level, or the first day with evidence of follicle luteinization. We used smoothing splines implemented via a mixed model to fit a smooth trajectory of FSH during the transition from cycle 1 to cycle 2 for each subject (PROC GLIMMIX, SAS 9.4; SAS Institute, Inc, Cary, NC). Knot number and location were determined separately for each subject based on the vertices of a k-dimensional tree. Fitted trajectories exhibited a decrease in FSH from midcycle, a gradual increase, and then a plateau (Fig. 2) except for three curves that showed only a gradual increase in FSH. We determined the slope of the intercycle FSH rise and the maximum FSH level achieved from each subject’s fitted trajectory. For the three curves with only a gradual increase in FSH, the FSH level at midcycle (day 0) was taken as the FSH minimum, and the last available FSH data point was taken as the FSH maximum. We also determined the number of days on which FSH equaled or exceeded the “FSH threshold” [estimated to be 4.2 IU/L (42)]. Manipulation of FSH dosing in ovulation induction protocols has demonstrated that FSH must rise above this FSH threshold for several consecutive days to initiate folliculogenesis during the luteal-follicular transition (20, 43, 44).
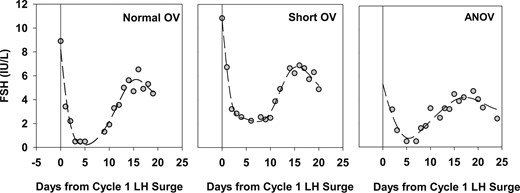
Observed and fitted FSH levels during the transition from cycle 1 to cycle 2 in three representative subjects with either normal ovulatory (OV) cycles, short OV cycles, or anovulatory (ANOV) cycles (with luteinization) in cycle 1. Data are centered to the midcycle LH peak in cycle 1 (day 0). Gray circles indicate observed FSH values, and dashed line represents fitted FSH trajectories based on smoothing splines. Fitted trajectories were used to calculate the FSH minimum, FSH maximum, slope of the FSH rise, and number of days spent above the FSH threshold (~4.2 IU/L) after the FSH rise.
Relationship between cycle 1 progesterone exposure, intercycle FSH rise, and cycle 2 folliculogenesis
We used linear regression to examine the association of cycle 1 progesterone exposure (maximum P4 or maximum Pd) with intercycle FSH dynamics (FSH slope, maximum, and days above threshold) (SAS 9.4). Using data from 21 girls with one to three ultrasounds in cycle 2, we also investigated the association between these three indices of intercycle FSH dynamics and dominant follicle size during cycle 2 by using a linear mixed model that included a random intercept for each subject and an adjustment for cycle day (Stata 14.0; StataCorp LLC, College Station, TX).
Comparison of adolescent subjects and historic adult controls with ovulatory cycles
Analyses of intercycle FSH rise and the influence of P4 level on FSH dynamics were repeated in 10 adult women, aged 18 to 34 years, who underwent daily blood sampling during the luteal-follicular transition (21). The same assay platforms for serum gonadotropins and sex steroids in adolescents were used previously in adult controls (26). Data on follicle growth were not available for adult women. FSH slope, maximum, and days above threshold were compared between adults and adolescents via the Kruskal-Wallis test (SAS 9.4).
The average LH interpulse interval (IPI) during sleep and the total number of awakenings were calculated for 11 other normal women, aged 28.6 ± 1.2 years (mean ± SD), who participated in a study that included frequent blood sampling (every 10 minutes) in the FP during PSG-monitored sleep after an ovulatory cycle (7). LH IPIs were compared between adolescent subgroups and adults via the Kruskal-Wallis test.
SigmaPlot (Systat Software, Inc., San Jose, CA) was used for all analyses except where noted.
Results
Menstrual cycle patterns
We categorized the 23 subjects into four menstrual cycle groups to best represent the spectrum of P4 and Pd exposure during cycle 1: ovulatory cycles with normal (10 to 14 days) luteal phase length (n = 11), ovulatory cycles with short (5 to 9 days) luteal phase length (n = 5), anovulatory cycles with evidence of luteinization (n = 5), and anovulatory cycles without luteinization (n = 2) [Table 1, (45)].
Baseline Characteristics of the 23 Adolescent Subjects
| Ovulatory, Normal Luteal (Group 1) | Ovulatory, Short Luteal (Group 2) | Anovulatory, Luteinization (Group 3) | Anovulatory, No Luteinization (Group 4) | |
|---|---|---|---|---|
| n | 11 | 5 | 5 | 2 |
| Chronologic age, y | 14.5 ± 0.3 | 14.0 ± 0.3 | 14.1 ± 0.4 | 13.7 ± 0.1 |
| Age at menarche, y | 12.7 ± 0.2 | 12.9 ± 0.3 | 12.3 ± 0.3 | 12.8 ± 0.1 |
| Gynecologic age, y | 1.8 ± 0.4 | 1.9 ± 0.5 | 1.8 ± 0.5 | 0.8 ± 0.04 |
| BMI z score | 1.02 ± 0.23 | 1.13 ± 0.43 | 1.78 ± 0.45 | 0.99 ± 1.22 |
| Cycle length, d | 39.4 ± 3.9 | 25.2 ± 1.1 | 38.8 ± 5.8 | 28.5 ± 6.0 |
| FP length, d | 27.8 ± 4.1 | 17.4 ± 1.2 | — | — |
| Luteal phase length, d | 11.5 ± 0.5 | 7.8 ± 0.8 | — | — |
| Peak serum P4, ng/mL | 7.1 ± 1.3 | 3.4 ± 0.4 | 1.8 ± 0.5 | 0.4 ± 0.1 |
| Peak urine Pd, μg/g Cr | 1276.7 ± 153.9 | 588.0 ± 89.0 | 377.0 ± 81.5 | 165.0 ± 24.7 |
Sleep parameters
Twenty-two of the 23 subjects were admitted for a sleep study with frequent blood sampling on cycle day 6.3 ± 0.4 of menstrual cycle 2. Subjects slept for 6.5 ± 0.9 hours of the 8 hours of blood sampling. Analysis of sleep architecture in the 19 subjects monitored with PSG demonstrated that subjects spent 23.5% ± 2.0% of total sleep time in deep sleep (N3, SWS), 50.8% ± 2.0% in light sleep (N1/N2), 17.8% ± 1.3% in REM, and 7.9% ± 1.6% awake after sleep onset (WASO), consistent with normative data in adolescents (46). Subjects fully awoke (for ≥30 seconds) 2.7 ± 0.2 times per hour. The three subjects monitored with actigraphy spent 6.0 ± 0.1 hours of the 8 hours asleep and 45.7 ± 0.9 minutes awake after sleep onset.
Recent progesterone exposure and pulsatile LH secretion during sleep in the early to middle FP
During sleep in the early to middle FP, subjects had 0.45 ± 0.05 LH pulses per hour, corresponding to an average IPI of 151.6 ± 15.2 minutes [Fig. 3, (45)]. Among 13 girls who experienced presleep LH pulses, the amplitude of LH pulses during sleep was significantly higher than that of LH pulses that occurred immediately before sleep onset (3.0 ± 0.3 vs 1.1 ± 0.2 IU/L, P < 0.01). Stepwise linear regression demonstrated that increasing levels of P4 or Pd exposure in cycle 1 were associated with a slower LH pulse frequency during sleep in the FP of cycle 2 (log serum P4 r = −0.5, P = 0.02; urine Pd r = −0.5, P = 0.02), whereas sleep study cycle day (mean ± SE: day 6.3 ± 0.4), E2 levels during sleep [30.5 ± 2.3 pg/mL (112.0 ± 8.4 pmol/L)], TT level [at screening; 20.6 ± 2.4 ng/dL (0.7 ± 0.08 nmol/L)], and BMI z score (1.27 ± 0.90) were not associated with LH pulse frequency. P4 exposure was not associated with average LH pulse amplitude during sleep (serum P = 0.8, urine P = 0.4).
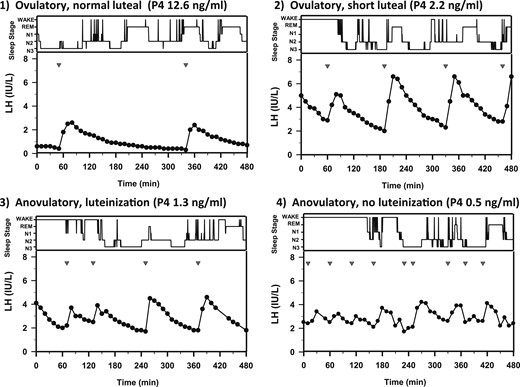
Sleep stages (wake, REM, N1, N2, and N3, in descending order) and pulsatile LH secretion in representative subjects from the four progesterone exposure groups, demonstrating the relationship between P4 level and LH pulse frequency during sleep. Studies were performed on day 5 or 6 of cycle 2. P4 = maximum serum progesterone detected in cycle 1. Inverted triangles indicate LH pulse nadirs.
Sleep-specific LH pulse frequencies in the adolescent subjects in menstrual cycle groups 1, 2, and 3 were comparable to those in adult women during the FP (7) (IPI: adults, 149.8 ± 13.3 minutes vs group 1, 183.4 ± 25.7 minutes, P = 0.4; group 2, 130.3 ± 23.6 minutes, P = 0.5; group 3, 128.9 ± 23.2 minutes, P = 0.6) whereas the two subjects with anovulatory cycles and no luteinization had higher LH pulse frequencies during sleep (IPI: group 4, 65.0 ± 15.0 minutes, P = 0.03). Average LH pulse amplitude during sleep was similar in adolescents (3.0 ± 0.3 IU/L) and adults (2.9 ± 0.5 IU/L, P = 0.9) and did not vary across adolescent subgroups (group 1, 3.4 ± 0.5 IU/L; group 2, 2.5 ± 0.5 IU/L; group 3, 2.6 ± 0.6 IU/L; and group 4, 2.7 ± 1.5 IU/L; P = 0.7).
Previous studies in reproductively mature women during the FP of the menstrual cycle demonstrated a strong association between LH pulse onset and brief periods of wakefulness during sleep (7), whereas in pubertal (premenarchal) girls and boys (2, 3) and possibly in women with PCOS (47), LH pulses are associated with SWS. In the current adolescent subjects, only 7.6% of LH pulses during sleep occurred during WASO. There was no association between LH pulse onset and a specific sleep stage (F4,53 = 1.4, P = 0.3). Because previous studies of adult women included subjects in whom ovulation had been confirmed in the previous cycle, we repeated analyses after including only subjects in group 1 (ovulatory with normal LP length), and the results were unchanged. Adolescents demonstrated more awakenings than their adult counterparts (2.7 ± 0.2 vs 1.9 ± 0.3 awakenings per hour, P < 0.01), indicating that the absence of an association between LH pulse onset and wakefulness was not caused by fewer awakenings among the adolescent subjects than the adult women.
Progesterone exposure and intercycle FSH dynamics
We predicted that an escape from greater P4 negative feedback (i.e., higher luteal P4 or Pd levels) would be associated with a steeper or more prolonged intercycle FSH rise (Fig. 1), promoting faster selection of a dominant follicle, among adolescents and adults. However, analysis of smoothed FSH trajectories in adolescents revealed no association between maximum P4 or Pd level in cycle 1, and the slope of the FSH rise, maximum FSH, or number of days FSH remained above threshold [Table 2, (45)]. LH pulse frequency during sleep also showed no association with intercycle FSH parameters (Table 2), and there was no correlation between intercycle FSH slope, FSH maximum, or days above the FSH threshold and dominant follicle size in cycle 2 [beta-coefficient (SE): FSH maximum, −0.15 (1.09), P = 0.9; slope FSH, −6.64 (6.72), P = 0.3; days FSH above threshold, 0.16 (0.16), P = 0.3]. As with adolescents, we saw no association between luteal serum P4 and intercycle FSH measures in adult women (Table 2). The predicted maximum FSH was higher in adults than in adolescents as a whole (6.38 ± 0.44 vs 5.37 ± 0.24 IU/L; P = 0.05), consistent with our previous studies demonstrating lower FSH levels in adolescents compared with adults across the luteal-follicular transition (26). There was also a trend toward a faster intercycle FSH rise in adults compared with adolescents (slope, 0.47 ± 0.05 vs 0.36 ± 0.04 IU/L/day, P = 0.09).
Results of Linear Regression Models Demonstrating the Absence of an Association Between Progesterone Exposure in Cycle 1 (Peak Serum P4 or Peak Urine Pd) or LH Pulse Frequency During the FP of Cycle 2 and Intercycle FSH Dynamics in 23 Adolescents and 10 Historic Adult Controls With Ovulatory Cycles
| Beta Coefficient (SE) | P | |
|---|---|---|
| Adolescents | ||
| Peak serum P4 (cycle 1) | ||
| Intercycle FSH slope | 0.002 (0.01) | 0.8 |
| FSH maximum | −0.02 (0.07) | 0.8 |
| Days above FSH threshold | 0.16 (0.25) | 0.5 |
| Peak urine Pd (cycle 1) | ||
| Intercycle FSH slope | −0.000004 (0.00007) | 1.0 |
| FSH maximum | −0.0003 (0.0004) | 0.5 |
| Days above FSH threshold | 0.002 (0.002) | 0.4 |
| LH pulse frequency during sleep (FP) | ||
| Intercycle FSH slope | 0.08 (0.18) | 0.7 |
| FSH maximum | 0.55 (1.09) | 0.6 |
| Days above FSH threshold | −4.19 (4.35) | 0.3 |
| Adults | ||
| Peak serum P4 (cycle 1) | ||
| Intercycle FSH slope | 0.001 (0.006) | 0.9 |
| FSH maximum | 0.02 (0.05) | 0.8 |
| Days above FSH threshold | −0.01 (0.09) | 0.9 |
Progesterone exposure and sleep architecture
Studies in reproductively mature women have demonstrated that a steeper rise in P4 from the FP to the midluteal phase is associated with greater WASO during the luteal phase (48), whereas concurrent E2 level has no effect on sleep characteristics. In the current studies of adolescent girls, greater P4 exposure in cycle 1 was not associated with greater sleep fragmentation as measured by awakenings per hour during the FP of cycle 2 (r = −0.03, P = 0.9 for maximum serum P4 and r = 0.2, P = 0.5 for maximum urine Pd). Consistent with previous studies of adult women (48), neither the E2 level on the day of the sleep study (r = −0.1, P = 0.6) nor cycle day (r = −0.2, P = 0.5) was associated with the number of awakenings in adolescents.
Discussion
The neuro-reproductive axis routinely senses and integrates a host of internal and external signals, thereby ensuring that adequate metabolic reserves are in place and that environmental conditions are favorable before energy is devoted to reproduction (49). The GnRH neuronal network is also highly sensitive to the sleep/wake state. In early puberty, there is an increase in GnRH secretion that is restricted to sleep; over time, however, GnRH pulse frequency increases primarily during wake and exceeds that of sleep by late puberty in the FP (4, 5). The biological basis of this dynamic relationship between GnRH secretion and the sleep/wake state and its clinical significance are largely unknown. The current findings suggest that in adolescent girls, as has been proposed in adult women (16), GnRH pulse frequency during sleep in the FP may be modulated by the waning influence of P4. Although we expected that a slow GnRH pulse frequency during sleep would be necessary for sustained FSH synthesis and folliculogenesis, we found that the intercycle FSH rise is not dependent on this sleep-related slowing of pulsatile GnRH secretion. Thus, differences in LH pulse frequency during sleep or in sleep architecture itself do not appear to account for the high prevalence of irregular cycles in girls in the early postmenarchal period (25).
Menstrual cycles in adolescent girls were associated with a gradation of P4 exposure, from high P4 in normal ovulatory cycles to undetectable P4 in cycles with minimal follicular growth. Luteal phase defects and anovulatory cycles with luteinization represented intermediate P4 exposure levels. Maximum level of P4 exposure in the preceding menstrual cycle had a strong inverse correlation with LH pulse frequency during sleep in the FP, whereas BMI z score, TT, E2, days since the previous LH peak, and amount of WASO had no association. It is possible that androgens, insulin sensitivity, or energy availability (17, 47, 50) may have contributed to differences in sleep-related LH pulse frequency because TT was measured only at the screening visit, and meals were not standardized during inpatient admissions in the current studies. Previous studies have also demonstrated heterogeneity in pulsatile LH secretion during sleep in regularly cycling women during the early and middle FP (75% to 91% of women show slowing) (6, 8, 51, 52) and in postmenarchal girls treated with exogenous P4 (5 of 11 showed slowing with P4 relative to placebo) (12). Although, on average, women with PCOS were reported to have a higher LH pulse frequency during PSG-monitored sleep than normal women (on cycle days 7 to 11), there was some degree of overlap in pulse frequency between groups (0.52 to 0.76 pulses per hour of sleep in PCOS vs 0.32 to 0.59 pulses per hour of sleep in controls) (47), further suggesting that additional factors beyond P4 exposure are at play. Taken together with the observation that sleep-related slowing persists in postmenopausal women (19), these data suggest that P4 exposure alone may not entirely explain LH pulse patterning during sleep and wake.
One possibility is that the observed variation in LH secretion during sleep in adolescent girls (and women) is caused not only by differences in P4 exposure but also by differences in basal opioid tone. Several endogenous opioids, initially β-endorphin (53, 54) and more recently, dynorphin (55) and orphanin Q (56), have been proposed as mediators of P4 negative feedback. The strongest evidence in support of this hypothesis comes from sophisticated in vivo and in vitro studies in the ovariectomized ewe (55). Studies in normal women have also demonstrated that the opioid antagonist naloxone induces the most robust increase in LH secretion when administered to women during the midluteal phase, when P4 levels are highest (53, 57) or to oophorectomized women pretreated with both estrogen and P4 as opposed to estrogen alone or placebo (58). Naloxone reverses the sleep-related slowing of LH pulses in the FP but has no effect on LH during the daytime in the FP (52), suggesting that hypothalamic opioid tone is naturally higher during sleep than wake in the FP. Interestingly, the prodynorphin gene (Pdyn), which encodes dynorphin (as well as other opioid peptides), is one of the most highly expressed genes in sleep-active neurons of the ventrolateral preoptic area in the mouse (59), and these neurons directly synapse on GnRH neurons (60). Thus, these studies suggest that during the luteal phase, high levels of P4 may augment endogenous opioid activity, thereby inhibiting GnRH pulse frequency during both sleep and wake. In the FP, under the waning influence of P4, opioid inhibitory tone may be sufficiently elevated only during sleep, resulting in sleep-specific slowing of GnRH pulses.
We hypothesized that a slower GnRH pulse frequency during sleep in the FP may be necessary to maintain the intercycle FSH rise and support the growth of the dominant follicle (7). Sleep-specific slowing would, in effect, provide a reprieve from the rapid daytime GnRH pulse profile in the FP that favors LH over FSH synthesis. However, the current studies suggest that in adolescent girls, slower pulses during sleep are not necessary for normal FSH secretion and folliculogenesis. Indeed, there was a sustained rise in FSH and normal follicle growth in subjects with sleep-specific LH IPIs as short as 80 minutes. The two subjects with anovulatory cycles without any P4 exposure in cycle 1, who presumably did not experience the typical slowing of GnRH pulse frequency that promotes FSH synthesis during the luteal phase, nevertheless exhibited a normal-appearing FSH rise after a fall in E2. For example, in one such subject, a dominant follicle (22 mm) was identified on cycle day 29 in association with a serum E2 of 84 pg/mL, but the follicle regressed and menses ensued 9 days later. The second subject had a 9-mm follicle on cycle day 12 (E2 37 pg/mL), but it grew to only 11 mm by cycle day 19 (E2 51 pg/mL), and menses followed 2 days later. Studies in the rhesus monkey demonstrated that surgical ablation of the dominant follicle, with or without an accompanying fall in E2, was followed by an LH surge ~12 days later, an interval comparable to the length of a normal FP (61). Collectively, these and the current studies suggest that loss of the negative feedback activity imposed by estrogen, and perhaps also by inhibin (62), can induce a normal FSH rise in the absence of P4. Although the current studies do not support a functional role for slower GnRH pulses during sleep in the FP of adolescent girls, additional studies are necessary to confirm that a faster GnRH pulse profile is tolerated over longer periods of time.
Given the intensive nature of this pediatric research study across two consecutive menstrual cycles, we were unable to obtain hormone levels on every single day of monitoring and were limited to one 8-hour frequent sampling session during sleep in the FP. We therefore relied on peak P4/Pd as a proxy for progesterone exposure during the luteal phase and could only compare LH pulse profiles during sleep among adolescent subgroups and with adults, as opposed to LH secretion during sleep compared with wake within or across subjects. We also cannot exclude the possibility that the intercycle FSH rise may be sensitive to the change in LH pulse frequency during sleep relative to wake rather than to sleep-associated LH pulse frequency per se. Future studies are necessary to confirm these findings in a cohort that includes a more balanced distribution of ovulatory and anovulatory adolescents. An interventional rather than observational study design is also needed to confirm that P4 has a causal role.
When considering the results of the current studies in the context of the considerable body of literature on modulation of pulsatile LH secretion by P4 in women, it is important to note that the effect of P4 on LH pulse frequency is not only a function of sleep/wake state but also depends on the dose and duration of P4 exposure, the estrogenic (and possibly androgenic) milieu, and the maturity of the reproductive axis (5). Whereas the current studies investigated the influence of P4 withdrawal on nocturnal LH pulse frequency in the FP (when P4 levels were undetectable), the majority of studies have considered the acute effect (i.e., 10 to 14 hours) of P4 on LH. In adult women in the late FP, for example, an oral bolus dose of P4 designed to achieve midluteal levels of P4 (~4 to 8 ng/mL) did not acutely decrease LH pulse frequency during wake or sleep (13, 63). In early (11) or late (12) pubertal girls, exogenous P4 consistently suppressed LH pulse frequency only during wake. When midluteal levels of P4 were achieved over the course of 8 days in adults during the late FP, LH pulse frequency decreased to a range typical of the luteal phase (sleep/wake effect not reported) (10). Studies in which LH pulse frequency was assessed 1 week after withdrawal from midluteal levels of P4 are the most relevant to, and also the most consistent with, the current studies in demonstrating nocturnal slowing of LH pulse frequency in the setting of undetectable P4 levels (16, 17).
In conclusion, these data suggest that for early postmenarchal girls, GnRH secretion during sleep in the FP is modulated by recent P4 exposure. However, the current studies do not support a functional role for a slow LH pulse frequency, and by inference a slow GnRH pulse frequency, during sleep in the control of FSH secretion. Even subjects without recent P4 exposure (anovulation), who had a sleep-associated LH pulse frequency two times higher than that of adults, demonstrated robust FSH secretion and a normal follicular growth rate. Although two recent epidemiological studies reported an association between poor sleep quality (64) or short sleep duration (65) and irregular menses in adolescent girls, the current studies suggest that if sleep abnormalities do in fact contribute to irregular cycles, the underlying mechanism does not appear to involve disrupted GnRH or FSH patterning.
Abbreviations:
- BMI
body mass index
- E2
estradiol
- FP
follicular phase
- IPI
interpulse interval
- LC/MS
liquid chromatography/tandem mass spectrometry
- P4
progesterone
- PCOS
polycystic ovarian syndrome
- Pd
pregnanediol
- PSG
polysomnography
- REM
rapid eye movement
- SWS
slow-wave sleep
- TT
total testosterone
- WASO
awake after sleep onset
Acknowledgments
We thank and acknowledge the nurses of the Massachusetts General Hospital Clinical Research Center for their support in conducting these studies, Johanna Clair for assistance in sample collection and processing, and Judy Boucher for setting up and scoring the sleep studies. We thank Dr. Janet Hall for providing primary data on historic adult controls and for her careful review of this manuscript.
Financial Support: This work was supported, in part, by the Intramural Research Program of the National Institutes of Health, National Institute of Environmental Health Sciences (Z01-ES103315) and by Grant 1UL1TR001102. N.D.S. is also supported as a Lasker Clinical Research Scholar (1SI2ES025429-01). The content is solely the responsibility of the authors and does not necessarily represent the official views of the National Center for Research Resources, the National Center for Advancing Translational Science, or the National Institutes of Health.
Clinical Trial Information: ClinicalTrials.gov no. NCT02486757 (registered 1 July 2015).
Author Contributions: N.D.S. (study PI) designed and implemented the study and supervised all aspects of data collection and analysis. N.D.S. and B.Z.S. wrote the manuscript, with editorial contributions by D.M.U. N.D.S. provided interpretation and prepared all graphics. T.K. recruited subjects, coordinated study visits, obtained study samples, and collected and organized the data. J.M.A. performed all ultrasounds and analyzed and interpreted the corresponding data. P.S., D.W.C., and D.T.Z. oversaw all laboratory studies. D.M.U. directed statistical analyses; N.D.S., B.Z.S., J.A.M., and D.M.U. conducted all statistical analyses. All authors read, edited, and approved the final manuscript.
Disclosure Summary: D.W.C. is an employee and shareholder of Laboratory Corp. D.T.Z. is the owner of ZRT Laboratory. The remaining authors have nothing to disclose.
