


Abstract
Sex steroid hormones exhibit anabolic effects whereas a deficiency engenders sarcopenia. Moreover, supraphysiological levels of glucocorticoids promote skeletal muscle atrophy, whereas physiologic levels of glucocorticoids may improve muscle performance.
To study the relationship between both groups of steroid hormones at a physiological range with skeletal muscle mass and function in the general population.
Cross-sectional analysis of the associations between urinary excreted androgens, estrogens, glucocorticoids, and steroid hormone metabolite ratios with lean mass and handgrip strength in a population-based cohort.
Three centers in Switzerland including 1128 participants.
Urinary steroid hormone metabolite excretion by gas chromatography–mass spectrometry, lean mass by bioimpedance analysis, and isometric handgrip strength by dynamometry.
For lean mass a strong positive association was found with 11β-OH-androsterone and with most glucocorticoids. Androsterone showed a positive association in middle-aged and older adults. Estriol showed a positive association only in men. For handgrip strength, strong positive associations with androgens were found in middle-aged and older adults, whereas positive associations were found with cortisol metabolites in young to middle-aged adults.
Sex steroids and glucocorticoids are strongly positively associated with skeletal muscle mass and strength in the upper limbs. The associations with muscle strength appear to be independent of muscle mass. Steroid hormones exert age-specific anabolic effects on lean mass and handgrip strength. Deficits in physical performance of aged muscles may be attenuated by androgens, whereas glucocorticoids in a physiological range increase skeletal muscle mass at all ages, as well as muscle strength in particular in younger adults.
Sex steroid hormones regulate myogenic differentiation of pluripotent cells and stimulate muscle protein synthesis (1, 2). By these means, they exhibit anabolic effects, which are reflected by skeletal muscle growth and improved muscle function. The deficiency of sex steroid hormones usually manifests as sarcopenia, a syndrome defined as the age-related loss in skeletal muscle and strength (3, 4) and associated with increased morbidity and mortality (5–7). Sarcopenia is considered as the target organ damage associated with frailty, a major public health burden in current aging societies (8). A high lean mass and high handgrip strength were both found to be associated with lower all-cause mortality and with a lower risk of falls (9–12). Electrical bioimpedance analysis (BIA) and handgrip strength are generally recognized as inexpensive, simple, and reproducible ways to assess muscle mass and overall muscular strength in population-based studies (5, 13, 14).
Randomized controlled trials have demonstrated a decreasing lean mass in healthy men due to both short- and long-term suppression of endogenous testosterone and 17β-estradiol production (15, 16), and men receiving androgen-deprivation therapy for prostate cancer are at increased risk to develop sarcopenic obesity (17, 18). In young men undergoing anterior cruciate ligament reconstruction, perioperative testosterone supplementation increased lean mass at 6 weeks (19). Physiological levels of testosterone were associated positively with lean mass in younger and older men (20–22), and baseline serum testosterone and 17β-estradiol levels were associated positively with handgrip strength in older men (23). Longitudinal data suggest that high baseline serum testosterone levels may protect elderly men against frailty (24–28). However, a longitudinal analysis revealed no association between baseline serum testosterone levels with 3-year change in muscular strength in older men (29). High serum 17β-estradiol, but not serum testosterone, was associated with higher lean mass in 3014 Swedish men aged 69 to 80 years (30). In a population-based study, serum androgens were not associated with grip strength in men aged 55 to 85 years, although they were associated with other measures of physical performance (31). So far, there has been no clear association of androgens with handgrip strength in men (28, 31), possibly reflecting methodological issues in measuring steroid hormones. With the increasing replacement of radioimmunoassay-based methods by liquid chromatography–mass spectrometry and gas chromatography–mass spectrometry (GC-MS) in steroid hormone analysis (32), this association may become clearer.
Unlike sex steroids, an excessive exposure to glucocorticoids, whether administered as medication or endogenously produced due to Cushing syndrome, engenders myopathy with skeletal muscle wasting and weakness (33). Supraphysiologic doses of glucocorticoids appear to promote skeletal muscle atrophy by decreasing protein anabolic pathways and by increasing protein catabolic pathways in the muscle through mitochondrial dysfunction and oxidative damage (34, 35). The resulting glucocorticoid myopathy concerns in particular the lower limbs with reduced maximal quadriceps strength (36). Whereas numerous studies, including population-based studies, explored the relationship of muscle mass and muscle strength with androgens, considerably fewer data exist on the relationships with glucocorticoids, in particular in the general population. Glucocorticoids have been shown to improve muscle function in early physiologic studies and in more recent studies with athletes (37) and are considered as doping agents by the World Anti-Doping Agency because they enhance physical performance (38). In patients with Duchenne muscular dystrophy, glucocorticoid treatment improves muscle strength and function (39). High salivary cortisol was associated with greater loss of grip strength during follow-up in older people from the general Dutch population (40). We found no study investigating the association between physiological levels of glucocorticoids in blood or urine with handgrip strength.
Subjects and Methods
Study population
Participants were selected from the Swiss Kidney Project on Genes in Hypertension (SKIPOGH), a multicenter, cross-sectional family-based study in the general adult Swiss population (41, 42). Recruitment was performed from December 2009 to March 2013 in the regions of Bern and Geneva and in the city of Lausanne in Switzerland by different strategies. A random sample of volunteers was selected (i) in the region of Geneva from an index list provided by the population-based Bus Santé study (43), (ii) in the city of Lausanne from the population-based CoLaus study (44), and (iii) in the region of Bern from the cantonal telephone registry. The following inclusion criteria were applied: (i) age ≥18 years, (ii) European ancestry, and (iii) at least one and ideally three first-degree family members willing to participate.
A comprehensive health questionnaire about current and past medical history, medication, nutrition, and lifestyle habits was answered by all participants and checked for completeness and accuracy during a study visit. Participants were excluded from the analyses for the presence of pregnancy, self-reported bilateral oophorectomy or hysterectomy, adrenal insufficiency or hypopituitarism when diagnosed previously (these disorders were not ruled out by testing), self-reported diagnosis of active malignant disease, self-reported liver disease or more than threefold elevated liver enzymes, body mass index <16 kg/m2 or >40 kg/m2, or when 24-hour urine was undercollected or overcollected according to reference (45). Study participants with chronic medication or on-demand medication used in the 2 weeks preceding the study visit and interacting with sex hormone or glucocorticoid metabolism were also excluded from analysis. Such medication included hormonal contraceptives, hormones to suppress menstrual bleeding, hormonal menopause treatment, topic or systemic glucocorticoids or mineralocorticoids, 5α-reductase inhibitors, aromatase inhibitors, antiepileptic agents, and CYP3A4 inhibitors such as systemic azole derivatives (46, 47). It is therefore possible that some participants took one or several of the aforementioned drugs >2 weeks prior to urine collection. The SKIPOGH study adhered to the Declaration of Helsinki and was approved by the competent institutional ethics committees in Geneva, Lausanne, and Bern. All participants provided written informed consent.
Measurement of anthropometric parameters
Body weight (BW) was measured in kilograms to the nearest 0.1 kg with an electronic scale in the morning in light indoor clothing without shoes after an overnight fast including a 12-hour abstinence from caffeine and alcohol. Body height (BH) was measured in meters to the nearest 0.5 cm with a wall-mounted stadiometer. Body mass index (BMI) was calculated by dividing BW by BH squared. Body composition was assessed by measuring bioelectrical single arm-to-leg impedance at a single frequency of 50 kHz on the right-hand side using a Bodystat 1500 analyzer (Bodystat, Isle of Man, UK) while lying supine on a nonconducting surface as previously described (48). The following values were derived from BIA: total lean mass (TLM) in kilograms and lean mass as a percentage of BW (TLM/BW × 100), lean mass index (TLM/BH2), total dry lean mass in kilograms and dry lean mass as a percentage of BW (total dry lean mass/BW × 100), total body water (TBW) in kilograms and body water as a percentage of BW (TBW/BW × 100), total fat mass (TFM) in kilograms and fat mass as a percentage of BW (TFM/BW × 100), fat mass index (TFM/BH2), and the TLM/TFM ratio. The device also provided basal metabolic rate in kilocalories per day, which represents the minimum daily energy requirement of the body at rest, as well as the average daily calorie requirement, which represents the daily energy requirement of the body at a self-reported physical activity level below which weight loss occurs. Isometric grip strength of both hands was measured with a Baseline® hand-held medical dynamometer (Medline Industries, Northfield, IL) three times alternately while holding shoulders adducted, elbows flexed at 90°, and forearms in a neutral position. The highest value out of six measurements was taken as the maximal isometric grip strength. All measurements were performed by well-trained study nurses and doctors.
Laboratory measurements
Urinary steroid hormone metabolites were determined centrally for all study participants by a GC-MS method previously described in urine samples covering 24 hours (49, 50). The steroid laboratory participates monthly in an external quality control, and recently the method has been further validated by multidimensional gas chromatography–time-of-flight mass spectrometry (51, 52). Figure 1 provides an overview of the metabolism of steroid hormones analyzed in this study. We further calculated steroid hormone metabolite ratios indicative of enzyme activities (53, 54). Glucose, insulin, lipid profile, creatinine, albumin, and blood count were analyzed in fasting blood venous samples by standard clinical laboratory methods at each center. Diabetes was defined as reported, treated, or fasting glycemia ≥7 mmol/L. The degree of insulin resistance was assessed by the homeostasis model assessment of insulin resistance calculated by [Insulin fasting (mU/L) × Glucose fasting (mmol/L)]/22.5 (55). The Chronic Kidney Disease Epidemiology Collaboration 2009 equation was used to calculate estimated glomerular filtration rate (56).
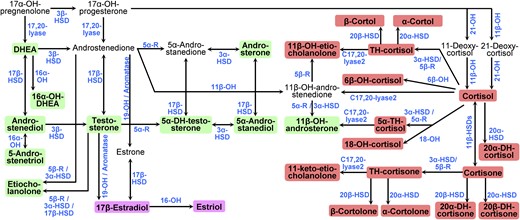
Pathways of human sex steroid hormone and glucocorticoid biosynthesis. The pathways start with 17α-hydroxypregnelonone in the upper left corner. Pathways from the testis, the ovary, and adrenal glands are combined. The 28 urinary steroid hormones analyzed in this study are highlighted with colored backgrounds: green for androgens and their metabolites, pink for estrogens, and red for glucocorticoids. Enzymes involved in steroidogenic pathways are denoted in blue. 5α-R, 5α-reductase; 5β-R, 5β-reductase; DH, dehydro; DHEA, dehydroepiandrosterone; HSD, hydroxysteroid dehydrogenase; OH, in enzyme names, indicates a hydroxylase, for example, 17α-OH for 17α-hydroxylase; OH, in steroid names, indicates a hydroxyl group, for example, 17α-OH-pregnelonone for 17α-hydroxypregnelonone; TH, tetrahydro.
Assessment of physical activity and of other covariates
Physical activity was assessed by a questionnaire. The daily physical load during work, at sports, and leisure activities was graded on a scale from 1 (very low) to 10 (very exhausting and repeated physical activity). The following examples were given to participants: 1, an elderly person spending all day long in a sitting position; 4 to 5, an administrative official with exclusively seated activity, who goes to work and who works in the garden in his leisure time; and 9 to 10, a construction worker, who loads his vehicle with sand every day by using a spade and who cycles by bike to work and back 20 km per day. Participants were asked whether they pursued an occupational activity and about their level of physical activity required at work: 1, sedentary pursuits; 2, drive car; 3, push a wheelbarrow; 4, loading a truck without mechanical aids. Participants were also asked whether they were currently practicing sports regularly and how many hours they were practicing sports per week. The presence of further covariates not underlying the exclusion criteria and with a potential impact on lean mass or handgrip strength were assessed (57, 58), including current smoking status (yes/no), alcohol consumption (yes/no), and regular caffeine consumption (yes/no). Hypertension was defined as either systolic blood pressure ≥140 mm Hg, diastolic blood pressure ≥90 mm Hg, or the use of antihypertensive medications.
Statistical analysis
Sex-specific extreme outliers in anthropometric and urinary steroid hormone metabolite data were defined as outside the range of the 25th percentile − 3 × the interquartile range to the 75th percentile + 3 × the interquartile range for each sex and were excluded from analysis. Summary statistics were calculated, distributions of continuous variables were visually inspected, and transformations were applied where appropriate to ensure normality for statistical analyses. Sex-specific differences for anthropometric, lifestyle-related, and laboratory parameters and for urine steroid hormone metabolites were assessed by Welch t tests, Mann–Whitney U tests, or χ2 tests as appropriate and are indicated by P values. These tests were two-sided and a P value <0.05 was considered statistically significant. The relationship between handgrip strength and body composition parameters from BIA was assessed visually and by calculation of Pearson and Spearman correlation coefficients separately for both sexes. The relation of handgrip strength and TLM with steroid hormone metabolites was similarly assessed. For all androgens and estrogens and for the 10 quantitatively most excreted glucocorticoids in urine, the potential influence on lean mass and handgrip strength was evaluated by multivariable mixed-effects linear regression analysis. All regression analyses took the family as a random effect into account and included the covariables sex, age, BH, daily physical activity (on a scale from 1 to 10), regular caffeine consumption (yes/no), current smoking (yes/no), regular alcohol consumption (yes/no), hypertension (yes/no), diabetes (yes/no), serum albumin, estimated glomerular filtration rate (Chronic Kidney Disease Epidemiology Collaboration 2009 equation), hemoglobin, and the study center. To take account of the influence of lean mass on handgrip strength, all regression models including handgrip strength as an outcome variable were recalculated by adding lean mass as an explanatory covariable. Continuous explanatory covariables were mean centered at zero to reduce the effect of collinearity, and steroid hormone metabolites were checked for the presence of an interaction effect with sex and/or with age. Accounting for the calculation of 25 models for TLM and 25 models for handgrip strength, a P value <0.05/50 = <0.001 for main terms and a P value <0.1/50 = <0.002 for interaction terms was considered to be significant in these models. Associations between metabolite ratios with lean mass and handgrip strength were similarly evaluated by multivariable mixed-effects linear regression analyses. All statistical analyses were conducted using R software version 3.3.3 (59).
Results
Characteristics of the study population
The study recruited 1128 participants from December 2009 to March 2013. In accordance with the inclusion and exclusion criteria described in Subjects and Methods, 798 participants were included in this analysis. Their demographic, anthropometric, and lifestyle characteristics are shown in Table 1. The age of the participants ranged from 18 to 90 years, and among them 366 (45.9%) were women and 172 (47.0%) of women were self-reported to be postmenopausal. The mean ± SD age in women was 51.5 ± 16.0 years and was slightly higher than in men (48.6 ± 17.3 years), mainly due to the exclusion of younger women (n = 118) taking hormonal contraceptives. A wide range of BW was observed in the population, from 39.3 to 132.9 kg, with a BH range from 144.0 to 201.0 cm, and a BMI range from 16.5 to 39.3 kg/m2. Anthropometric parameters differed by sex (Table 1) and showed a sex-related bimodal distribution and similar distributions within each single study center. Self-reported physical activity and smoking, alcohol, and caffeine consumption were higher and hypertension and diabetes more frequent in men (Table 1). Sex-specific differences were also found for most laboratory parameters, except for low-density lipoprotein cholesterol and serum albumin.
Anthropometric, Lifestyle, and Laboratory Parameters According to Sex
| Variable | Men | Women | P |
|---|---|---|---|
| Sex, N (%) | 432 (54.1) | 366 (45.9) | — |
| Age, y | 48.6 ± 17.3 | 51.5 ± 16.0 | 0.015 |
| Anthropometric parameters | |||
| BW, kg | 80.0 (72.6–89.4) | 64.6 (57.2–71.9) | <2.2 × 10⁻¹⁶ |
| BH, m | 177.2 ± 6.6 | 164.2 ± 6.4 | <2.2 × 10⁻¹⁶ |
| BMI, kg/m2 | 25.6 (23.2–28.3) | 23.8 (21.4–26.4) | 2.1 × 10⁻⁹ |
| Lean mass, kg | 62.7 ± 8.1 | 43.5 ± 6.3 | <2.2 × 10⁻¹⁶ |
| Lean mass, % | 77.2 ± 7.0 | 66.9 ± 8.5 | <2.2 × 10⁻¹⁶ |
| Lean mass index, kg/m2 | 19.9 ± 2.0 | 16.1 ± 1.8 | <2.2 × 10⁻¹⁶ |
| Dry lean mass, kg | 17.2 ± 4.1 | 10.3 ± 3.4 | <2.2 × 10⁻¹⁶ |
| Dry lean mass, % | 21.1 ± 4.3 | 15.7 ± 4.7 | <2.2 × 10⁻¹⁶ |
| Body water, kg | 45.5 ± 5.1 | 33.3 ± 3.6 | <2.2 × 10⁻¹⁶ |
| Body water, % | 56.3 ± 5 | 51.3 ± 6.2 | <2.2 × 10⁻¹⁶ |
| Fat mass, kg | 17.8 (13.3–23.7) | 21.0 (16.2–27.2) | 6.6 × 10⁻⁹ |
| Fat mass, % | 22.7 ± 6.8 | 33.0 ± 8.4 | <2.2 × 10⁻¹⁶ |
| Fat mass index, kg/m2 | 5.7 (4.1–7.7) | 7.8 (6–10.2) | <2.2 × 10⁻¹⁶ |
| Lean mass/fat mass ratio, kg/kg | 3.5 (2.6–4.7) | 2.1 (1.6–2.7) | <2.2 × 10⁻¹⁶ |
| Basal metabolic rate, kcal/d | 1871 ± 228 | 1413 ± 156 | <2.2 × 10⁻¹⁶ |
| Average daily calorie requirement, kcal/d | 2954 ± 422 | 2214 ± 287 | <2.2 × 10⁻¹⁶ |
| Maximal handgrip strength, kg | 46.4 ± 10.1 | 26.6 ± 5.8 | <2.2 × 10⁻¹⁶ |
| Lifestyle parameters and diseases | |||
| Daily physical activity (on a scale from 1 to 10) | 5.2 ± 1.7 | 5.0 ± 1.6 | 0.020 |
| Occupational activity, N (%) | 310 (71.8) | 223 (60.9) | 0.0012 |
| Daily occupational activity (on a scale of 1–4) | 2.0 (1.0–3.0) | 1.0 (1.0–3.0) | 0.029 |
| Currently practicing sports regularly, N (%) | 273 (63.2) | 220 (60.1) | 0.37 |
| Duration of practicing sports, h/wk | 2.0 (0.0–4.5) | 1.0 (0.0–3.0) | 0.0056 |
| Current smoking, N (%) | 115 (26.7) | 69 (18.9) | 0.0094 |
| Regular alcohol consumption, N (%) | 339 (78.5) | 200 (54.6) | 1.9 × 10⁻¹³ |
| Regular caffeine consumption, N (%) | 383 (88.9) | 314 (86.5) | 0.31 |
| Hypertension, N (%) | 125 (28.9) | 74 (20.2) | 0.0046 |
| Systolic blood pressure, mm Hg | 121 ± 13.3 | 113 ± 16 | 1.3 × 10⁻¹¹ |
| Diastolic blood pressure, mm Hg | 77.2 ± 9.2 | 71.9 ± 8.8 | 6.7 × 10⁻¹⁵ |
| Diabetes, N (%) | 29 (6.7) | 10 (2.7) | 0.0094 |
| Laboratory parameters | |||
| Glucose fasting, mmol/L | 5.3 (4.9–5.7) | 5.0 (4.6–5.4) | 1.7 × 10⁻¹² |
| Insulin fasting, mU/L | 5.6 (3.1–8.8) | 4.4 (2.3–6.8) | 0.00018 |
| HOMA-IR | 0.046 (0.026–0.070) | 0.040 (0.021–0.059) | 0.0044 |
| Cholesterol, mmol/L | 5.0 ± 1.1 | 5.4 ± 1.1 | 3.1 × 10⁻⁷ |
| Low-density lipoprotein cholesterol, mmol/L | 3.2 ± 0.9 | 3.3 ± 0.9 | 0.11 |
| High-density lipoprotein cholesterol, mmol/L | 1.3 (1.1–1.5) | 1.7 (1.4–2.0) | <2.2 × 10⁻¹⁶ |
| Triglycerides, mmol/L | 1.0 (0.7–1.5) | 0.8 (0.6–1.1) | 1.1 × 10⁻⁹ |
| Serum albumin, g/L | 40.0 (37.0–44.0) | 40.0 (36.0–44.0) | 0.16 |
| Serum creatinine, µmol/L | 81.0 (73.0–89.0) | 66.0 (60.0–72.0) | <2.2 × 10⁻¹⁶ |
| eGFR, mL/min per 1.73 m2 body surface area | 96.7 ± 18.3 | 92.7 ± 17.2 | 0.0018 |
| Hemoglobin, g/L | 148 (141–154) | 134 (128–140) | <2.2 × 10⁻¹⁶ |
Categorical variables are described by number of participants N (%), continuous variables are described by their mean ± SD or by median (25th to 75th percentile). Sex-specific differences were assessed by χ2 tests, Welch t tests, or Mann–Whitney U tests where appropriate and are indicated by P values.
Abbreviations: eGFR, estimated glomerular filtration rate; HOMA-IR, homeostasis model assessment of insulin resistance.
Urinary excretion of steroid hormone metabolites
Similarly to anthropometric parameters, the excretion of androgens, estrogens, and of almost all glucocorticoids in 24-hour urine followed a sex-specific pattern, with higher values in men (Table 2). The main excreted androgen metabolites were androsterone and etiocholanolone, followed by the androstenedione metabolite 11β-OH-androsterone, the androsterone metabolite 5-androstenetriol, and the dehydroepiandrosterone metabolite 16α-OH-dehydroepiandrosterone (Table 2). The excreted amount of estriol was higher than that of 17β-estradiol. Among glucocorticoids, the highest amounts excreted in urine were found for the cortisone metabolites TH-cortisone, α-cortolone, and β-cortolone and for the cortisol metabolites TH-cortisol, allo-TH-cortisol, and β-cortol.
Urine Steroid Hormone Metabolite Excretion According to Sex
| Measurement (nmol/24 h) | Men | Women | P |
|---|---|---|---|
| Sums of steroid hormones | |||
| Androgens and metabolites (n = 10) | 16,703 (12,064–21,347) | 8406 (5258–12762) | 2.02 × 10−40 |
| Estrogens (n = 2) | 31.9 (24.2–40.0) | 20.9 (11.0–46.1) | 0.00032 |
| Glucocorticoids and metabolites (n = 16) | 27,849 (23,703–33,716) | 17,712 (13,914–22,439) | 5.30 × 10−52 |
| Androgens and metabolites | |||
| Dehydroepiandrosterone | 316 (157–943) | 181 (85.5–448) | 7.55 × 10⁻¹³ |
| 16α-OH-dehydroepiandrosterone | 745 (271–1465) | 296 (142–687) | 1.91 × 10⁻²⁰ |
| Androstenediol | 374 (170–732) | 147 (74.1–255) | 2.41 × 10⁻³⁵ |
| Testosterone | 154 (98.4–232) | 24.8 (15.1–45.4) | 3.86 × 10−124 |
| 5α-DH-testosterone | 83.4 (52–122) | 33.2 (21.1–56.3) | 1.93 × 10−45 |
| Androstanediol | 289 (198–383) | 75.9 (46.6–121) | 2.56 × 10−115 |
| Androsterone | 6208 (4023–8806) | 2147 (1159–3598) | 2.15 × 10−62 |
| 5-Androstenetriol | 1281 (728–1958) | 546 (292–901) | 7.28 × 10−44 |
| 11β-OH-androsterone | 2805 (2107–3543) | 1515 (1118–2054) | 1.21 × 10−68 |
| Etiocholanolone | 5238 (3422–7706) | 3068 (1673–4699) | 6.41 × 10⁻²⁹ |
| Estrogens | |||
| 17β-Estradiol | 8.94 (6.63–11.9) | 6.47 (3.6–13.6) | 2.04 × 10⁻⁷ |
| Estriol | 21.5 (15.3–30.8) | 14.8 (6.72–34.7) | 2.97 × 10⁻⁸ |
| Glucocorticoids and metabolites | |||
| Cortisol | 300 (225–413) | 232 (166–326) | 2.93 × 10⁻¹⁷ |
| 6β-OH-cortisol | 282 (191–379) | 244 (155–357) | 0.00061 |
| 18-OH-cortisol | 464 (298–694) | 455 (285–649) | 0.26 |
| 20α-DH-cortisol | 147 (104–210) | 120 (86.8–176) | 5.23 × 10⁻⁶ |
| TH-cortisol | 4871 (3907–6100) | 3218 (2422–3982) | 4.18 × 10−44 |
| α-Cortol | 896 (705–1146) | 600 (453–804) | 1.30 × 10−43 |
| β-Cortol | 1225 (958–1676) | 741 (541–1006) | 1.46 × 10−53 |
| 11β-OH-etiocholanolone | 1208 (641–1777) | 975 (572–1475) | 0.0036 |
| Allo-TH-cortisol | 3944 (2916–5376) | 1593 (1120–2332) | 2.99 × 10−76 |
| Cortisone | 467 (358–635) | 378 (266–511) | 3.77 × 10⁻¹⁴ |
| 20α-DH-cortisone | 66.3 (49.8–88.7) | 46.2 (33.6–61.8) | 8.85 × 10⁻²⁹ |
| 20β-DH-cortisone | 170 (122–224) | 133 (98.9–183) | 8.97 × 10⁻¹¹ |
| TH-cortisone | 8494 (6855–11016) | 5534 (4225–7300) | 8.06 × 10−44 |
| α-Cortolone | 3361 (2708–4166) | 2426 (1842–3142) | 1.24 × 10⁻³³ |
| β-Cortolone | 1754 (1387–2231) | 1018 (772–1313) | 2.06 × 10−65 |
| 11-Keto-etiocholanolone | 1267 (795–1793) | 1132 (681–1495) | 0.00013 |
Steroid hormone values are measured in nanomoles per 24 h and are described by median (25th to 75th percentile). Sex-specific differences were assessed by Welch t tests and are indicated by P values.
Correlation between anthropometric parameters
Both TLM (Spearman ρ = 0.839, P = 4.8×10−213) and maximal handgrip strength (Spearman ρ = 0.779, P = 1.2 × 10−162) correlated stronger with BH than with BW or BMI. BH was therefore selected as the covariable for subsequent multivariable regression analyses instead of BW and BMI. Handgrip strength correlated highest with TLM (Spearman ρ = 0.811, P = 1.6 × 10−186) and with basal metabolic rate (Spearman ρ = 0.805, P = 4.5 × 10−181) among all other anthropometric parameters. The direction of all correlations assessed was similar across study centers.
Analysis of independent association between steroid hormones and lean mass
The sum of urinary androgens showed a significant interaction with age but not with sex for the association with lean mass (sum androgens: β, 6.9 × 10⁻⁵; 95% CI, −2.5 × 10⁻⁵ to 1.6 × 10⁻⁴; P = 0.16 and for interaction with age: β, 6.7×10⁻⁵; 95% CI, 3.0 × 10⁻⁶ to 1.0 × 10⁻⁵; P = 0.00038). This interaction was basically driven by the main androgen metabolite androsterone (β, 3.9 × 10⁻⁴; 95% CI, 1.9 × 10⁻⁴ to 5.9 × 10⁻⁴; P = 0.00017 and for interaction with age: β, 1.5 × 10⁻⁵; 95% CI, 7.9 × 10⁻⁶ to 2.3 × 10⁻⁵; P = 0.000066). This means that a positive association between androsterone and lean mass was only present at a higher age (Fig. 2A) (60). Sex and BH were both positively associated with lean mass (Fig. 2B and 2C). A significant positive association with lean mass was found for another main androgen metabolite, 11β-OH-androsterone (β, 0.0013; 95% CI, 0.00086 to 0.0016; P = 1.4 × 10⁻⁹), with no significant interaction in the models. In contrast, for the association between lean mass and estriol a significant interaction with sex was found (β, 0.11; 95% CI, 0.070 to 0.15; P = 1.2 × 10⁻⁷ and for interaction with sex: β, −0.10; 95% CI, −0.15 to −0.057; P = 0.000023) (Table 3). In this model, lean mass was significantly positively associated with estriol at all ages (Fig. 2D) but only in men (Fig. 2E). A strong positive association between lean mass and most cortisol and cortisone metabolites was found (Table 3), as illustrated for the main glucocorticoid metabolite TH-cortisone in Fig. 2F.
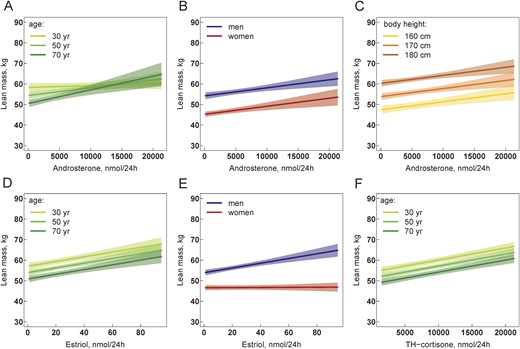
(A–F) Association of 24-h urine steroid hormone metabolite excretion with lean mass. Multivariable regression models are visualized by showing the relationship between the steroid hormone metabolite and lean mass while holding the effect of all other covariables in the model constant. All models in (A)–(F) are adjusted for sex, age, BH, daily physical activity, current smoking, regular caffeine and alcohol consumption, hypertension, diabetes, serum albumin, estimated glomerular filtration rate, hemoglobin, and study center. The relationships are visualized separately for male and female sex and for belonging to the nearest class of age and BH with breaks at 30, 50, and 70 y for age and at 160, 170, and 180 cm for height. Solid lines represent regression lines, and shaped areas represent the corresponding 95% CI. Different slopes of regression lines in (A) indicate a significant interaction between androsterone and age in the model. Different slopes of regression lines in (E) indicate a significant interaction between estriol and sex. The statistical R package visreg was used to generate all figures (60).
Association Between TLM, as Dependent Variable, With Urine Steroid Hormone Excretion
| Predictor | N | Model 1: Without Interaction | Model 2: Interaction With Sex | Model 3: Interaction With Age | |||||||
|---|---|---|---|---|---|---|---|---|---|---|---|
| Predictor | Predictor | Interaction: Predictor and Women | Predictor | Interaction: Predictor and Age | |||||||
| β (95% CI)a | P | β (95% CI)a | P | β (95% CI)a | P | β (95% CI)a | P | β (95% CI)a | P | ||
| Sums of steroid hormones | |||||||||||
| Androgens and metabolites | 505 | 0.02 (−0.07 to 0.12) | 0.61 | 0.02 (−0.09 to 0.13) | 0.75 | 0.02 (−0.13 to 0.16) | 0.84 | 0.07 (−0.03 to 0.16) | 0.16 | 0.01 (0 to 0.01) | 3.8 × 10⁻⁴ |
| Estrogens | 728 | 32.3 (13.9 to 50.8) | 7.2 × 10⁻⁴ | 97.1 (62.1 to 132.4) | 1.1 × 10⁻⁷ | −89.9 (−131.9 to –48.3) | 3.1 × 10⁻⁵ | 34.7 (15.9 to 53.5) | 3.7 × 10⁻⁴ | 0.79 (−0.44 to 2.02) | 0.21 |
| Glucocorticoids and metabolites | 555 | 0.22 (0.17 to 0.28) | 2.2 × 10⁻¹³ | 0.25 (0.17 to 0.32) | 3.6 × 10⁻¹⁰ | −0.06 (−0.17 to 0.05) | 0.30 | 0.23 (0.17 to 0.28) | 1.8 × 10⁻¹³ | 0 (0 to 0) | 0.47 |
| Androgens and metabolites | |||||||||||
| Dehydroepiandrosterone | 668 | 0.2 (−0.43 to 0.82) | 0.54 | −0.01 (−0.81 to 0.77) | 0.97 | 0.51 (−0.65 to 1.69) | 0.39 | 0.25 (−0.47-0.96) | 0.49 | 0.01 (−0.04 to 0.05) | 0.75 |
| 16α-OH-dehydroepiandrosterone | 741 | 0.13 (−0.43 to 0.68) | 0.65 | 0.12 (−0.49 to 0.72) | 0.70 | 0.05 (−1.01 to 1.1) | 0.92 | 0.55 (−0.12 to 1.22) | 0.11 | 0.04 (0 to 0.07) | 0.033 |
| Androstenediol | 731 | 0.46 (−0.64 to 1.57) | 0.42 | −0.03 (−1.25 to 1.2) | 0.97 | 2.1 (−0.19 to 4.4) | 0.08 | 1.05 (−0.18 to 2.27) | 0.10 | 0.07 (0 to 0.13) | 0.038 |
| Testosterone | 739 | 1.07 (−3.73 to 5.89) | 0.67 | −0.65 (−5.65 to 4.39) | 0.80 | 14.01 (1.64 to 26.33) | 0.03 | 2.63 (−2.72 to 8) | 0.34 | 0.15 (−0.08 to 0.38) | 0.20 |
| 5α-DH-testosterone | 756 | 9.01 (0.74 to 17.2) | 0.033 | 10.48 (0.98 to 19.94) | 0.032 | −5.14 (−21.66 to 11.21) | 0.54 | 9.81 (1.47 to 18.07) | 0.021 | 0.28 (−0.13 to 0.69) | 0.18 |
| Androstanediol | 746 | 3.52 (0.17 to 6.88) | 0.042 | 3.02 (−0.72 to 6.76) | 0.12 | 2.1 (−4.88 to 9.11) | 0.56 | 4.31 (0.83 to 7.81) | 0.017 | 0.11 (−0.03 to 0.25) | 0.12 |
| Androsterone | 666 | 0.18 (0.01 to 0.35) | 0.046 | 0.18 (0 to 0.37) | 0.059 | −0.01 (−0.29 to 0.27) | 0.94 | 0.39 (0.19 to 0.59) | 1.7 × 10⁻⁴ | 0.02 (0.01 to 0.02) | 6.6 × 10⁻⁵ |
| 5-Androstenetriol | 759 | 0.14 (−0.39 to 0.67) | 0.61 | 0.19 (−0.4 to 0.79) | 0.52 | −0.21 (−1.2 to 0.79) | 0.69 | 0.43 (−0.15 to 1.01) | 0.15 | 0.03 (0.01 to 0.06) | 0.016 |
| 11β-OH-androsterone | 752 | 1.25 (0.86 to 1.65) | 1.4 × 10⁻⁹ | 1.23 (0.77 to 1.7) | 3.9 × 10⁻⁷ | 0.07 (−0.78 to 0.92) | 0.87 | 1.27 (0.87 to 1.67) | 9.4 × 10⁻¹⁰ | 0.01 (−0.01 to 0.03) | 0.22 |
| Etiocholanolone | 677 | −0.01 (−0.19 to 0.16) | 0.87 | −0.08 (−0.27 to 0.11) | 0.43 | 0.22 (−0.08 to 0.52) | 0.16 | 0.04 (−0.14 to 0.22) | 0.67 | 0.01;0 to 0.02) | 0.041 |
| Estrogens | |||||||||||
| 17β-Estradiol | 745 | 99.5 (36.8 to 162) | 0.0021 | 129.4 (11.7 to 247.4) | 0.033 | −41.6 (−181.4 to 97.2) | 0.56 | 92.5 (28.1 to 156.8) | 0.0054 | −2.07 (−6.54 to 2.42) | 0.37 |
| Estriol | 742 | 36.1 (14.4 to 57.9) | 0.0013 | 109.6 (69.9 to 149.6) | 1.2 × 10⁻⁷ | −104.3 (−152.2 to −56.8) | 2.3 × 10⁻⁵ | 39.6 (17.6 to 61.7) | 5.1 × 10⁻⁴ | 1.26 (−0.14 to 2.66) | 0.080 |
| Glucocorticoids and metabolites | |||||||||||
| TH-cortisol | 654 | 0.61 (0.36 to 0.86) | 3.0 × 10⁻⁶ | 0.54 (0.23 to 0.85) | 7.0 × 10⁻⁴ | 0.2 (−0.3 to 0.69) | 0.44 | 0.61 (0.36 to 0.87) | 2.4 × 10⁻⁶ | −0.01 (−0.03 to 0) | 0.032 |
| α-Cortol | 760 | 5.5 (4.22 to 6.79) | 4.4 × 10⁻¹⁶ | 5.8 (4.21 to 7.39) | 3.1 × 10⁻¹² | −0.78 (−3.19 to 1.65) | 0.53 | 5.61 (4.32 to 6.9) | 2.2 × 10⁻¹⁶ | −0.05 (−0.12 to 0.02) | 0.14 |
| β-Cortol | 758 | 2.03 (1.29 to 2.77) | 1.1 × 10⁻⁷ | 1.85 (0.95 to 2.76) | 7.5 × 10⁻⁵ | 0.5 (−1 to 1.99) | 0.52 | 2.13 (1.38 to 2.88) | 4.6 × 10⁻⁸ | 0.03 (−0.01 to 0.07) | 0.17 |
| 11β-OH-etiocholanolone | 763 | −0.02 (−0.5 to 0.46) | 0.94 | −0.3 (−0.91 to 0.31) | 0.34 | 0.75 (−0.24 to 1.73) | 0.14 | −0.01 (−0.5 to 0.47) | 0.95 | −0.02 (−0.05 to 0.01) | 0.18 |
| Allo-TH-cortisol | 677 | 0.86 (0.61 to 1.11) | 8.2 × 10⁻¹¹ | 0.88 (0.59 to 1.18) | 9.3 × 10⁻⁹ | −0.09 (−0.6 to 0.42) | 0.73 | 0.86 (0.61 to 1.11) | 9.6 × 10⁻¹¹ | 0 (−0.01 to 0.01) | 0.96 |
| Cortisone | 763 | 1.65 (−0.44 to 3.73) | 0.12 | 2.17 (−0.42 to 4.76) | 0.10 | −1.3 (−5.18 to 2.56) | 0.51 | 1.63 (−0.46 to 3.72) | 0.13 | −0.01 (−0.13 to 0.1) | 0.82 |
| TH-cortisone | 701 | 0.56 (0.43 to 0.7) | 1.6 × 10⁻¹⁵ | 0.61 (0.45 to 0.78) | 1.0 × 10⁻¹² | −0.14 (−0.41 to 0.13) | 0.31 | 0.59 (0.45 to 0.72) | 4.4 × 10⁻¹⁶ | 0.01 (0 to 0.01) | 0.12 |
| α-Cortolone | 723 | 1.93 (1.59 to 2.27) | <2.2 × 10⁻¹⁶ | 2.19 (1.78 to 2.61) | <2.2 × 10⁻¹⁶ | −0.69 (−1.34 to −0.05) | 0.037 | 1.94 (1.6 to 2.28) | 2.2 × 10⁻¹⁶ | 0.01 (−0.01 to 0.03) | 0.30 |
| β-Cortolone | 727 | 2.69 (2.03 to 3.36) | 8.9 × 10⁻¹⁵ | 3.14 (2.33 to 3.95) | 1.4 × 10⁻¹³ | −1.27 (−2.59 to 0.06) | 0.064 | 2.91 (2.23 to 3.59) | 6.7 × 10⁻¹⁶ | 0.04 (0.01 to 0.07) | 0.016 |
| 11-Keto-etiocholanolone | 765 | 0.19 (−0.33 to 0.71) | 0.47 | 0.26 (−0.41 to 0.93) | 0.45 | −0.16 (−1.23 to 0.89) | 0.76 | 0.18 (−0.34 to 0.7) | 0.50 | −0.01 (−0.04 to 0.02) | 0.59 |
In the regression models the β-coefficient (β) represents the degree of change in the dependent variable (lean mass) for every one unit of change in the predictor variable (sum of steroid hormone metabolites or single steroid hormone metabolite) and has the unit kilograms per (micromole per 24 h). Men were coded to be 0 and women to be 1 in all models. All models were calculated by mixed-effects linear regression, taking family as a random effect into account and were adjusted for sex, age, BH, daily physical activity, current smoking, regular caffeine and alcohol consumption, hypertension, diabetes, serum albumin, estimated glomerular filtration rate, hemoglobin, and study center.
Values were multiplied by 1000 to support a clear display of the data.
Analysis of independent association between steroid hormones and maximal handgrip strength
Five of 10 androgens and also the sum of androgens showed a significant interaction with age for the association with handgrip strength (Table 4). Thus, similar to lean mass, androgens were clearly positively associated with handgrip strength only in the group of oldest participants (illustrated by androsterone in Fig. 3A). Furthermore, the association between androgens and handgrip strength was independent from lean mass, as the association persisted when lean mass was added to the model as an explanatory covariable (illustrated by dehydroepiandrosterone in Fig. 3B). No significant association was found between estrogens and handgrip strength. Among glucocorticoids, a significant interaction with age for the association with handgrip strength was found for the cortisol metabolites TH-cortisol and α-cortol and with a trend for β-cortol (Table 4). Unlike androgens, the positive association between cortisol metabolites and handgrip strength was not found in the elderly population but in younger adults (Fig. 3C). When the models were recreated by adding lean mass as an explanatory covariable, this association became weaker for the cortisol metabolites TH-cortisol and α-cortol and stronger for β-cortol (Fig. 3D).
Association Between Maximal Handgrip Strength, as Dependent Variable, With Urine Steroid Hormone Excretion
| Predictor | N | Model 1: No Interaction | Model 2: Interaction With Sex | Model 3: Interaction With Age | |||||||
|---|---|---|---|---|---|---|---|---|---|---|---|
| Predictor | Predictor | Interaction: Predictor and Women | Predictor | Interaction: Predictor and Age | |||||||
| β (95% CI)a | P | β (95% CI)a | P | β (95% CI)a | P | β (95% CI)a | P | β (95% CI)a | P | ||
| Sums of steroid hormones | |||||||||||
| Androgens and metabolites | 503 | 0.1 (−0.01 to 0.2) | 0.071 | 0.14 (0.02 to 0.26) | 0.029 | −0.11 (−0.27 to 0.06) | 0.21 | 0.15 (0.04 to 0.26) | 0.0065 | 0.01 (0 to 0.01) | 2.5 × 10⁻⁴ |
| Estrogens | 727 | 1.57 (−23.3 to 26.7) | 0.90 | −14.37 (−61.88 to 33.02) | 0.56 | 22.64 (−33.74 to 79.6) | 0.44 | 1.08 (−24.34 to 26.78) | 0.93 | −0.22 (−1.89 to 1.46) | 0.80 |
| Glucocorticoids and metabolites | 553 | 0.12 (0.04 to 0.2) | 0.0022 | 0.15 (0.05 to 0.25) | 0.0047 | −0.06 (−0.2 to 0.09) | 0.46 | 0.11 (0.04 to 0.19) | 0.0044 | 0 (−0.01 to 0) | 0.083 |
| Androgens and metabolites | |||||||||||
| Dehydroepiandrosterone | 665 | 1.17 (0.41 to 1.93) | 0.0029 | 1.12 (0.15 to 2.07) | 0.024 | 0.14 (−1.28 to 1.57) | 0.85 | 2.01 (1.16 to 2.86) | 5.6 × 10⁻⁶ | 0.11 (0.06 to 0.17) | 6.4 × 10⁻⁵ |
| 16α-OH-dehydroepiandrosterone | 738 | −0.05 (−0.77 to 0.66) | 0.89 | −0.01 (−0.8 to 0.77) | 0.97 | −0.15 (−1.54 to 1.23) | 0.83 | 0.86 (−0.01 to 1.72) | 0.052 | 0.08 (0.04 to 0.12) | 3.4 × 10⁻⁴ |
| Androstenediol | 728 | 1.33 (−0.1 to 2.75) | 0.071 | 1.06 (−0.54 to 2.64) | 0.20 | 1.14 (−1.84 to 4.14) | 0.46 | 1.8 (0.21 to 3.38) | 0.028 | 0.06 (−0.03 to 0.14) | 0.18 |
| Testosterone | 737 | 5.94 (−0.11 to 12.01) | 0.058 | 6.08 (−0.33 to 12.55) | 0.068 | −1.02 (−17.21 to 14.82) | 0.90 | 8.14 (1.4 to 14.88) | 0.020 | 0.22 (−0.08 to 0.53) | 0.15 |
| 5α-DH-testosterone | 753 | −1.49 (−12.04 to 8.69) | 0.78 | 3.7 (−8.63 to 15.87) | 0.56 | −17.47 (−39.34 to 4.06) | 0.12 | 0.07 (−10.55 to 10.34) | 0.99 | 0.58 (0.04 to 1.13) | 0.038 |
| Androstanediol | 744 | 1.49 (−2.87 to 5.83) | 0.51 | 1.63 (−3.27 to 6.48) | 0.52 | −0.55 (−9.7 to 8.66) | 0.91 | 2.09 (−2.47 to 6.62) | 0.37 | 0.08 (−0.1 to 0.26) | 0.38 |
| Androsterone | 663 | 0.03 (−0.19 to 0.24) | 0.81 | 0.06 (−0.18 to 0.29) | 0.63 | −0.13 (−0.48 to 0.23) | 0.49 | 0.33 (0.08 to 0.57) | 0.0094 | 0.02 (0.01 to 0.03) | 3.0 × 10⁻⁶ |
| 5-Androstenetriol | 756 | −0.05 (−0.74 to 0.64) | 0.89 | 0.16 (−0.62 to 0.93) | 0.69 | −0.8 (−2.11 to 0.52) | 0.24 | 0.53 (−0.22 to 1.28) | 0.17 | 0.07 (0.03 to 0.1) | 1.5 × 10⁻⁴ |
| 11β-OH-androsterone | 749 | 0.7 (0.17 to 1.23) | 0.010 | 0.59 (−0.04 to 1.21) | 0.066 | 0.37 (−0.76 to 1.51) | 0.53 | 0.69 (0.15 to 1.21) | 0.012 | −0.01 (−0.04 to 0.01) | 0.33 |
| Etiocholanolone | 674 | 0.2 (−0.02 to 0.41) | 0.072 | 0.23 (−0.01 to 0.46) | 0.067 | −0.1 (−0.48 to 0.28) | 0.61 | 0.32 (0.1 to 0.54) | 0.0042 | 0.02 (0.01 to 0.03) | 1.1 × 10⁻⁴ |
| Estrogens | |||||||||||
| 17β-Estradiol | 742 | 90 (6.2 to 173.6) | 0.037 | 189.4 (32 to 345.7) | 0.019 | −139.3 (−320 to 45.4) | 0.15 | 72.3 (−13.1 to 157.2) | 0.10 | −4.99 (−10.9 to 0.94) | 0.11 |
| Estriol | 739 | −3.49 (−32.6 to 26.1) | 0.82 | −38.8 (−92.2 to 14.7) | 0.16 | 50.9 (−13.2 to 115.8) | 0.13 | −2.69 (−32.4 to 27.5) | 0.86 | 0.27 (−1.62 to 2.17) | 0.78 |
| Glucocorticoids and metabolites | |||||||||||
| TH-cortisol | 651 | 0.43 (0.09 to 0.77) | 0.015 | 0.46 (0.04 to 0.88) | 0.032 | −0.1 (−0.72 to 0.58) | 0.77 | 0.43 (0.09 to 0.76) | 0.014 | −0.03 (−0.05 to –0.01) | 4.5 × 10⁻⁴ |
| α-Cortol | 757 | 1.21 (−0.52 to 2.93) | 0.18 | 1.34 (−0.82 to 3.49) | 0.23 | −0.35 (−3.67 to 3) | 0.84 | 1.48 (−0.24 to 3.21) | 0.10 | −0.15 (−0.24 to–0.07) | 0.0012 |
| β-Cortol | 755 | 1.37 (0.39 to 2.34) | 0.0068 | 1.51 (0.31 to 2.72) | 0.015 | −0.41 (−2.43 to 1.6) | 0.70 | 1.07 (0.08 to 2.06) | 0.037 | −0.08 (−0.14 to –0.03) | 0.0030 |
| 11β-OH-etiocholanolone | 760 | 0.45 (−0.19 to 1.09) | 0.17 | 0.36 (−0.45 to 1.17) | 0.39 | 0.23 (−1.08 to 1.55) | 0.74 | 0.43 (−0.2 to 1.07) | 0.19 | −0.05 (−0.09 to –0.01) | 0.012 |
| Allo-TH-cortisol | 674 | 0.31 (−0.04 to 0.66) | 0.081 | 0.36 (−0.05 to 0.76) | 0.090 | −0.15 (−0.87 to 0.56) | 0.69 | 0.29 (−0.06 to 0.64) | 0.10 | −0.01 (−0.03 to 0.01) | 0.27 |
| Cortisone | 760 | 3.83 (1.19 to 6.49) | 0.0051 | 4.12 (0.97 to 7.46) | 0.017 | −0.71 (−5.85 to 4.35) | 0.79 | 3.84 (1.33 to 6.44) | 0.0052 | 0.01 (−0.14 to 0.16) | 0.92 |
| TH-cortisone | 698 | 0.31 (0.14 to 0.48) | 5.7 × 10⁻⁴ | 0.33 (0.12 to 0.54) | 0.0026 | −0.06 (−0.42 to 0.29) | 0.73 | 0.32 (0.14 to 0.5) | 5.7 × 10⁻⁴ | 0 (−0.01 to 0.01) | 0.67 |
| α-Cortolone | 720 | 0.49 (0.03 to 0.95) | 0.040 | 0.59 (0.01 to 1.16) | 0.048 | −0.25 (−1.14 to 0.64) | 0.58 | 0.48 (0.01 to 0.94) | 0.046 | −0.01 (−0.03 to 0.02) | 0.52 |
| β-Cortolone | 724 | 0.85 (−0.04 to 1.73) | 0.065 | 0.95 (−0.14 to 2.03) | 0.092 | −0.29 (−2.09 to 1.51) | 0.76 | 0.82 (−0.11 to 1.73) | 0.086 | −0.01 (−0.05 to 0.04) | 0.81 |
| 11-Keto-etiocholanolone | 762 | 0.65 (−0.03 to 1.34) | 0.063 | 0.8 (−0.07 to 1.69) | 0.077 | −0.37 (−1.77 to 1.02) | 0.60 | 0.65 (−0.03 to 1.34) | 0.065 | 0 (−0.03 to 0.04) | 0.95 |
In the regression models the β-coefficient (β) represents the degree of change in the dependent variable (lean mass) for every one unit change in the predictor variable (sum of steroid hormone metabolites or single steroid hormone metabolite) and has the unit kilograms (per micromole per 24 h). Men were coded to be 0 and women to be 1 in all models. All models were calculated by mixed-effects linear regression, taking family as a random effect into account and were adjusted for sex, age, BH, daily physical activity, current smoking, regular caffeine and alcohol consumption, hypertension, diabetes, serum albumin, estimated glomerular filtration rate, hemoglobin, and study center.
Values were multiplied by 1000 to support a clear display of the data.
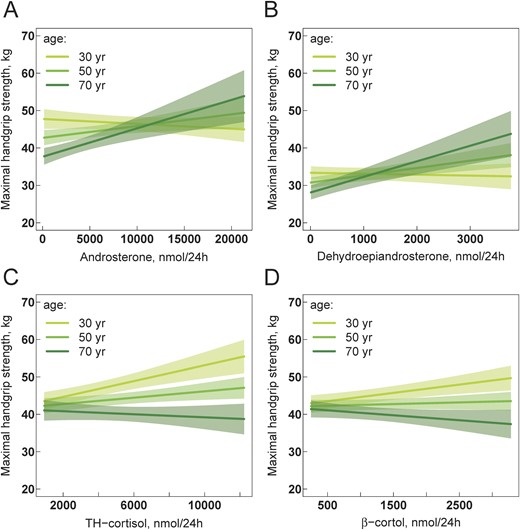
(A–D) Association of 24-h urine steroid hormone metabolite excretion with maximal handgrip strength. Multivariable regression models are visualized by showing the relationship between the steroid hormone metabolite and handgrip strength while holding the effect of all other covariables in the model constant. Models in (A) and (C) are adjusted for sex, age, BH, daily physical activity, current smoking, regular caffeine and alcohol consumption, hypertension, diabetes, serum albumin, estimated glomerular filtration rate, hemoglobin, and study center. Models in (B) and (D) are additionally adjusted for lean mass. The relationships are visualized separately for belonging to the nearest class of age with breaks at 30, 50, and 70 y. Solid lines represent regression lines, and the shaped areas represent the corresponding 95% CI. Different slopes of regression lines indicate a significant interaction between steroid hormones and age in the models. The statistical R package visreg was used to generate all figures (60).
Analysis of independent association between steroid hormone metabolite ratios and lean mass
A higher ratio of 11β-OH-androsterone/androstenediol, reflecting a possibly higher Δ4-pathway activity of the 17α-hydroxylase compared with its Δ5-pathway activity, was found to be associated with a higher lean mass in younger women and men (Table 5; Fig. 4A). A higher ratio of androsterone/etiocholanolone, indicative of a higher activity of the alternative backdoor pathway to androgen biosynthesis, was associated with a higher lean mass in women and men at all ages (Table 5; Fig. 4B). Additionally, a higher ratio of (α-cortol + α-cortolone)/(β-cortol + β-cortolone), indicative of the 20α-hydroxysteroid dehydrogenase activity compared with the 20β-hydroxysteroid dehydrogenase activity, showed a trend to be associated with higher lean mass.
Association Between TLM, as Dependent Variable, With Steroid Hormone Metabolite Ratios Reflecting Enzyme Activities
| Enzyme Activities/Deficiencies and Corresponding Ratios as Predictors | N | Model 1: No Interaction | Model 2: Interaction with Sex | Model 3: Interaction with Age | |||||||
|---|---|---|---|---|---|---|---|---|---|---|---|
| Predictor | Predictor | Interaction: Predictor and Women | Predictor | Interaction: Predictor and Age | |||||||
| β (95% CI) | P | β (95% CI) | P | β (95% CI) | P | β (95% CI) | P | β (95% CI) | P | ||
| 3β-Hydroxysteroid dehydrogenase deficiency | |||||||||||
| DHEA/THE | 616 | −2.83 (−7.14 to 1.46) | 0.20 | −5.32 (−11.78 to 1.08) | 0.11 | 4.16 (−3.81 to 12.17) | 0.31 | −2.95 (−7.69 to 1.75) | 0.23 | −0.02 (−0.3 to 0.27) | 0.90 |
| DHEA/(THE + THF + 5αTHF) | 528 | −2.77 (−11.42 to 5.82) | 0.53 | −4.69 (−19.43 to 9.9) | 0.54 | 2.76 (−14.23 to 19.87) | 0.75 | −2.81 (−12.87 to 7.2) | 0.59 | −0.01 (−0.65 to 0.64) | 0.99 |
| (DHEA + 16OHDHEA)/THE | 609 | −2.91 (−5.53 to –0.35) | 0.028 | −4.55 (−8.52 to –0.62) | 0.026 | 2.54 (−2.11 to 7.2) | 0.29 | −2.67 (−5.6 to 0.23) | 0.076 | 0.03 (−0.13 to 0.19) | 0.72 |
| (DHEA + 16OHDHEA)/(THE + THF + 5αTHF) | 522 | −4.47 (−9.71 to 0.68) | 0.094 | −6.74 (−15.72 to 2.13) | 0.14 | 3.1 (−6.81 to 13.02) | 0.55 | −3.09 (−9.33 to 3.08) | 0.34 | 0.14 (−0.21 to 0.49) | 0.43 |
| 17,20-Lyase global activity | |||||||||||
| (AT + ET)/THE | 599 | −0.71 (−1.28 to –0.14) | 0.016 | −1.68 (−2.55 to –0.81) | 1.9 × 10⁻⁴ | 1.41 (0.45 to 2.37) | 0.0047 | −0.47 (−1.12 to 0.17) | 0.15 | 0.02 (−0.01 to 0.05) | 0.14 |
| (AT + ET)/(THE + THF + 5αTHF) | 523 | −1.13 (−2.34 to 0.08) | 0.072 | −3.03 (−4.92 to –1.14) | 0.0021 | 2.64 (0.62 to 4.66) | 0.012 | −0.51 (−1.93 to 0.9) | 0.48 | 0.05 (−0.01 to 0.12) | 0.10 |
| CYP17 global Δ4- vs Δ5-pathway activity | |||||||||||
| 11βOHAT/(DHEA + 16OHDHEA) | 650 | 0.13 (0.04 to 0.22) | 0.0051 | 0.23 (0.1 to 0.36) | 5.9 × 10⁻⁴ | −0.17 (−0.32 to –0.01) | 0.038 | 0.25 (0.12 to 0.38) | 1.5 × 10⁻⁴ | −0.01 (−0.01 to 0) | 0.011 |
| 11βOHAT/Δ5diol | 719 | 0.03 (−0.01 to 0.07) | 0.18 | 0.07 (0.01 to 0.13) | 0.023 | −0.07 (−0.14 to 0) | 0.062 | 0.1 (0.05 to 0.16) | 2.9 × 10⁻⁴ | 0 (−0.01 to 0) | 1.1 × 10− |
| 11βOHAT/(DHEA + 16OHDHEA + Δ5diol) | 650 | 0.23 (0.08 to 0.38) | 0.0031 | 0.39 (0.18 to 0.6) | 3.5 × 10⁻⁴ | −0.28 (−0.53 to –0.02) | 0.037 | 0.46 (0.25 to 0.67) | 1.9 × 10⁻⁵ | −0.01 (−0.02 to –0.01) | 0.0023 |
| Alternative androgen backdoor pathway activity after the 17,20-lyase vs classic pathway activity | |||||||||||
| AT/ET | 630 | 1.54 (0.65 to 2.43) | 8.5 × 10⁻⁴ | 1.94 (0.92 to 2.95) | 2.5 × 10⁻⁴ | −1.45 (−3.23 to 0.36) | 0.12 | 1.52 (0.63 to 2.41) | 9.9 × 10⁻⁴ | 0.02 (−0.02 to 0.07) | 0.27 |
| 5α-Reductase deficiency | |||||||||||
| ET/AT | 630 | −0.95 (−1.67 to –0.23) | 0.011 | −1.74 (−2.76 to –0.72) | 9.9 × 10⁻⁴ | 1.48 (0.13 to 2.83) | 0.034 | −0.66 (−1.47 to 0.14) | 0.11 | −0.04 (−0.08 to 0.01) | 0.12 |
| 11βOHET/11βOHAT | 754 | −1.09 (−2 to –0.19) | 0.019 | −1.64 (−2.88 to –0.39) | 0.011 | 1.12 (−0.65 to 2.89) | 0.22 | −0.92 (−1.91 to 0.07) | 0.071 | −0.03 (−0.08 to 0.03) | 0.38 |
| THF/5αTHF | 633 | −0.02 (−0.08 to 0.04) | 0.47 | −0.02 (−0.08 to 0.04) | 0.50 | −0.07 (−0.52 to 0.37) | 0.75 | 0.08 (−0.09 to 0.25) | 0.35 | −0.01 (−0.02 to 0) | 0.21 |
| 11β-Hydroxysteroid dehydrogenase type 2 deficiency/apparent mineralocorticoid excess | |||||||||||
| F/E | 761 | 0.43 (−1 to 1.86) | 0.56 | 0.97 (−1.07 to 3.01) | 0.36 | −0.95 (−3.54 to 1.62) | 0.47 | 0.42 (−1.04 to 1.88) | 0.58 | 0 (−0.08 to 0.08) | 0.95 |
| (THF + 5αTHF)/THE | 596 | −0.49 (−1.98 to 1) | 0.52 | −1.36 (−3.28 to 0.56) | 0.17 | 2.03 (−0.79 to 4.88) | 0.17 | −0.32 (−1.87 to 1.23) | 0.69 | −0.03 (−0.11 to 0.05) | 0.45 |
| (αC + βC)/(αCl + βCl) | 684 | −3.96 (−7.42 to –0.49) | 0.027 | −7.59 (−12.32 to –2.87) | 0.0019 | 7.61 (0.85 to 14.41) | 0.030 | −4.07 (−7.53 to –0.61) | 0.023 | −0.15 (−0.35 to 0.05) | 0.15 |
| (F + E)/(THF + 5αTHF + THE) | 596 | −5.61 (−11.78 to 0.55) | 0.079 | −5.94 (−14.16 to 2.29) | 0.16 | 0.7 (−10.88 to 12.23) | 0.91 | −5.37 (−11.56 to 0.81) | 0.094 | −0.15 (−0.46 to 0.17) | 0.37 |
| 11β-Hydroxysteroid dehydrogenase type 1 deficiency/Apparent cortisone reductase deficiency | |||||||||||
| THE/(THF + 5αTHF) | 596 | 0 (−1.46 to 1.44) | 1.00 | 2.03 (−0.47 to 4.52) | 0.12 | −2.95 (−5.9 to –0.01) | 0.053 | 0.25 (−1.23 to 1.73) | 0.74 | 0.06 (−0.01 to 0.13) | 0.10 |
| (αCl + βCl)/(αC + βC) | 684 | 0.63 (−0.02 to 1.27) | 0.059 | 1.52 (0.58 to 2.47) | 0.0019 | −1.61 (−2.87 to –0.36) | 0.013 | 0.77 (0.12 to 1.43) | 0.023 | 0.04 (0 to 0.07) | 0.039 |
| 20α-Hydroxysteroid dehydrogenase deficiency | |||||||||||
| (THF + 5αTHF + THE)/(αC + αCl) | 600 | −1.11 (−1.89 to –0.33) | 0.0057 | −1.54 (−2.52 to –0.54) | 0.0028 | 1.04 (−0.47 to 2.57) | 0.18 | −1.17 (−1.94 to –0.39) | 0.0037 | −0.04 (−0.08 to 0) | 0.052 |
| 20β-Hydroxysteroid dehydrogenase deficiency | |||||||||||
| (THF + 5αTHF + THE)/(βC + βCl) | 622 | 0.14 (−0.28 to 0.56) | 0.52 | 0.11 (−0.48 to 0.7) | 0.72 | 0.06 (−0.74 to 0.86) | 0.89 | 0.14 (−0.28 to 0.56) | 0.52 | −0.01 (−0.04 to 0.01) | 0.31 |
| 20α-Hydroxysteroid dehydrogenase activity vs 20β-hydroxysteroid dehydrogenase activity | |||||||||||
| (αC + αCl)/(βC + βCl) | 684 | 1.34 (0.53 to 2.15) | 0.0013 | 2.26 (1.01 to 3.5) | 4.9 × 10⁻⁴ | −1.51 (−3.09 to 0.07) | 0.064 | 1.34 (0.53 to 2.15) | 0.0014 | 0 (−0.04 to 0.05) | 0.91 |
| 3α-Hydroxysteroid dehydrogenase deficiency | |||||||||||
| 20αDHF/(THF + 5αTHF) | 629 | −30.5 (−56.0 to –5.38) | 0.019 | −53.8 (−122 to 13.9) | 0.13 | 26.9 (−45.9 to 99.8) | 0.47 | −32.7 (−63.3 to –2.37) | 0.038 | −0.18 (−1.54 to 1.19) | 0.80 |
Increasing values of the ratios are indicative of an increasing enzyme activity or an increasing enzyme deficiency, or an increasing activity of an enzyme pathway in proportion to another enzyme pathway as described in the enzyme names. The β-coefficient (β) represents the degree of change in the dependent variable (lean mass) for every one unit change in the metabolite ratio as a predictor variable and has the unit kilograms. Men were coded to be 0 and women to be 1 in all models. All models were calculated by mixed-effects linear regression, taking family as a random effect into account and were adjusted for sex, age, BH, daily physical activity, current smoking, regular caffeine and alcohol consumption, hypertension, diabetes, serum albumin, estimated glomerular filtration rate, hemoglobin, and study center.
Abbreviations: 5α3αdiol, androstanediol; 5αTHF, allo-TH-cortisol; 11βOHAT, 11β-OH-androsterone; 11βOHET, 11β-OH-etiocholanolone; 16OHDHEA, 16α-OH-dehydroepiandrosterone; 20αDHF, 20α-DH-cortisol; AT, androsterone; DH, dehydro; DHEA, dehydroepiandrosterone; E, cortisone; ET, etiocholanolone; F, cortisol; OH, hydroxy; TH, tetrahydro; THE, TH-cortisone; THF, TH-cortisol; αC, α-cortol; αCl, α-cortolone; βC, β-cortol; βCl, β-cortolone; Δ5-diol, androstenediol.
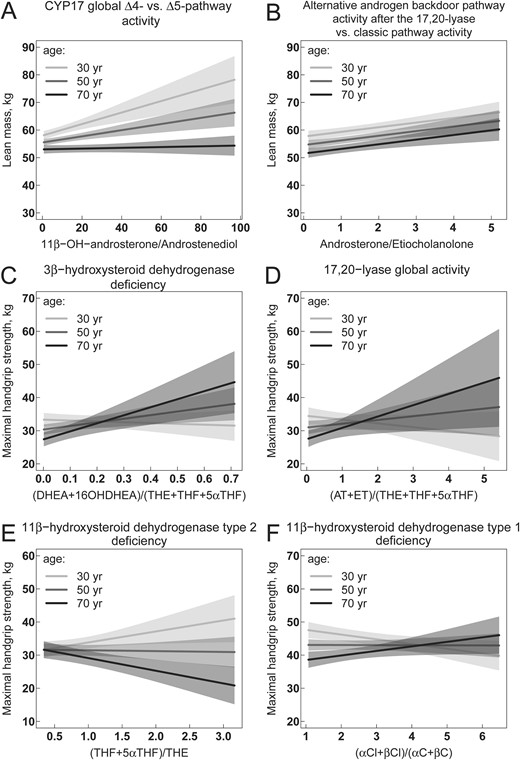
(A–F) Association of steroid hormone metabolite ratios reflecting enzyme activities with lean mass and maximal handgrip strength. Increasing values of the ratios are indicative of an increasing enzyme activity or an increasing enzyme deficiency, or an increasing activity of an enzyme pathway in proportion to another enzyme pathway as described in the enzyme names. Multivariable regression models are visualized by showing the relationship between steroid hormone metabolite ratios and lean mass (A and B) or handgrip strength (C–F) while holding the effect of all other covariables in the model constant. Models in (A) and (B) are adjusted for sex, age, BH, daily physical activity, current smoking, regular caffeine and alcohol consumption, hypertension, diabetes, serum albumin, estimated glomerular filtration rate, hemoglobin, and study center. Models in (C)–(F) are additionally adjusted for lean mass. The relationships are visualized separately for belonging to the nearest class of age with breaks at 30, 50, and 70 y. Solid lines represent regression lines, and the shaped areas represent the corresponding 95% CI. Different slopes of regression lines indicate a significant interaction between steroid hormones and age in the models. The statistical R package visreg was used to generate all figures (60). 5αTHF, allo-TH-cortisol; 16OHDHEA, 16α-OH-dehydroepiandrosterone; DHEA, dehydroepiandrosterone; THE, TH-cortisone; THF, TH-cortisol; αC, α-cortol; αCl, α-cortolone; βC, β-cortol; βCl, β-cortolone.
Analysis of independent association between steroid hormone metabolite ratios and handgrip strength
A higher handgrip strength was found to be associated with a ratio reflecting a possibly lower 3β-hydroxysteroid dehydrogenase activity (Table 6; Fig. 4C) and a possibly higher activity of the CYP17-17,20-lyase (Table 6; Fig. 4D) in older women and men. A possibly lower activity of the 11β−hydroxysteroid dehydrogenase type 2, based on the (TH-cortisol + allo-TH-cortisol)/TH-cortisone ratio but not on the cortisol/cortisone ratio, was associated with a trend to higher handgrip strength in younger adults and with lower handgrip strength in older adults (Table 6; Fig. 4E). For 11β-hydroxysteroid dehydrogenase type 1 the opposite association was found using the ratio (α-cortolone + β-cortolone)/(α-cortol + β-cortol) (Table 6; Fig. 4F).
Association Between Maximal Handgrip Strength, as Dependent Variable, With Steroid Hormone Metabolite Ratios Reflecting Enzyme Activities
| Enzyme Activities/Deficiencies and Corresponding Ratios as Predictors | N | Model 1: No Interaction | Model 2: Interaction With Sex | Model 3: Interaction With Age | |||||||
|---|---|---|---|---|---|---|---|---|---|---|---|
| Predictor | Predictor | Interaction Predictor and Women | Predictor | Interaction Predictor and Age | |||||||
| β (95% CI) | P | β (95% CI) | P | β (95% CI) | P | β (95% CI) | p | β;95% CI | p | ||
| 3β-Hydroxysteroid dehydrogenase deficiency | |||||||||||
| DHEA/THE | 613 | 5.25 (0.3 to 10.24) | 0.041 | 7.14 (−0.3 to 14.57) | 0.063 | −3.16 (−12.39 to 6.16) | 0.51 | 7.57 (2.15 to 13.02) | 0.0072 | 0.34 (0.01 to 0.67) | 0.046 |
| DHEA/(THE + THF + 5αTHF) | 525 | 11.8 (1.61 to 22.1) | 0.026 | 18 (0.58 to 35.3) | 0.046 | −8.99 (−29.1 to 11.5) | 0.39 | 18.8 (6.95 to 30.7) | 0.0023 | 0.87 (0.11 to 1.63) | 0.027 |
| (DHEA + 16OHDHEA)/THE | 606 | 1.26 (−1.73 to 4.28) | 0.42 | 3.69 (−0.91 to 8.29) | 0.12 | −3.79 (−9.22 to 1.67) | 0.18 | 3.75 (0.39 to 7.12) | 0.031 | 0.3 (0.11 to 0.49) | 0.0022 |
| (DHEA + 16OHDHEA)/(THE + THF + 5αTHF) | 519 | 2.8 (−3.38 to 9.03) | 0.38 | 8.93 (−1.77 to 19.61) | 0.11 | −8.39 (−20.27 to 3.58) | 0.17 | 9.83 (2.46 to 17.22) | 0.010 | 0.72 (0.3 to 1.13) | 0.0010 |
| 17,20-Lyase global activity | |||||||||||
| (AT + ET)/THE | 596 | −0.29 (−0.98 to 0.41) | 0.42 | −0.15 (−1.23 to 0.92) | 0.79 | −0.2 (−1.4 to 1.02) | 0.75 | 0.33 (−0.46 to 1.11) | 0.42 | 0.06 (0.02 to 0.1) | 0.0017 |
| (AT + ET)/(THE + THF + 5αTHF) | 520 | −0.54 (−2.07 to 0.98) | 0.49 | −0.56 (−2.98 to 1.85) | 0.66 | 0.02 (−2.58 to 2.64) | 0.99 | 0.98 (−0.8 to 2.75) | 0.29 | 0.13 (0.05 to 0.22) | 0.0016 |
| CYP17 global Δ4- vs Δ5-pathway activity | |||||||||||
| 11βOHAT/(DHEA + 16OHDHEA) | 647 | −0.08 (−0.19 to 0.03) | 0.16 | −0.13 (−0.29 to 0.03) | 0.10 | 0.09 (−0.1 to 0.28) | 0.36 | 0.04 (−0.12 to 0.19) | 0.64 | −0.01 (−0.01 to 0) | 0.046 |
| 11βOHAT/Δ5diol | 716 | −0.03 (−0.09 to 0.02) | 0.22 | −0.08 (−0.16 to 0) | 0.059 | 0.07 (−0.02 to 0.16) | 0.15 | −0.01 (−0.09 to 0.06) | 0.69 | 0 (0 to 0) | 0.44 |
| 11βOHAT/(DHEA + 16OHDHEA + Δ5diol) | 647 | −0.14 (−0.32 to 0.04) | 0.14 | −0.25 (−0.51 to 0.01) | 0.060 | 0.19 (−0.12 to 0.51) | 0.24 | 0.02 (−0.24 to 0.28) | 0.88 | −0.01 (−0.02 to 0) | 0.082 |
| Alternative androgen backdoor pathway activity after the 17,20-lyase vs classic pathway activity | |||||||||||
| AT/ET | 627 | −1.27 (−2.38 to –0.18) | 0.025 | −1.13 (−2.4 to 0.13) | 0.084 | −0.51 (−2.77 to 1.72) | 0.66 | −1.3 (−2.4 to –0.2) | 0.022 | 0.04 (−0.01 to 0.1) | 0.11 |
| 5α-Reductase deficiency | |||||||||||
| ET/AT | 627 | 0.28 (−0.61 to 1.19) | 0.54 | 0.13 (−1.13 to 1.41) | 0.84 | 0.27 (−1.42 to 1.98) | 0.75 | 0.74 (−0.25 to 1.74) | 0.15 | −0.06 (−0.11 to 0) | 0.037 |
| 11βOHET/11βOHAT | 751 | −0.83 (−2.03 to 0.38) | 0.18 | −1.05 (−2.69 to 0.61) | 0.21 | 0.46 (−1.9 to 2.82) | 0.70 | −0.31 (−1.6 to 0.99) | 0.64 | −0.08 (−0.16–0.01) | 0.036 |
| THF/5αTHF | 630 | −0.02 (−0.1 to 0.06) | 0.58 | −0.02 (−0.1 to 0.06) | 0.55 | 0.12 (−0.47 to 0.73) | 0.69 | 0.09 (−0.13 to 0.31) | 0.44 | −0.01 (−0.02 to 0.01) | 0.30 |
| 11β-Hydroxysteroid dehydrogenase type 2 deficiency/apparent mineralocorticoid excess | |||||||||||
| F/E | 758 | −2.02 (−3.81 to –0.22) | 0.029 | −1.53 (−4.13 to 1.12) | 0.26 | −0.87 (−4.32 to 2.52) | 0.62 | −1.87 (−3.69 to –0.04) | 0.047 | −0.04 (−0.15 to 0.06) | 0.42 |
| (THF + 5αTHF)/THE | 593 | −1.35 (−3.25 to 0.57) | 0.17 | −2.05 (−4.52 to 0.41) | 0.11 | 1.65 (−1.98 to 5.32) | 0.38 | −0.36 (−2.3 to 1.61) | 0.73 | −0.18 (−0.28 to –0.09) | 3.2 × 10⁻⁴ |
| (αC + βC)/(αCl + βCl) | 681 | −0.57 (−4.94 to 3.82) | 0.80 | −1.74 (−7.74 to 4.29 | 0.58 | 2.44 (−6.22 to 11.09) | 0.58 | −0.91 (−5.24 to 3.45) | 0.69 | −0.46 (−0.72 to –0.21) | 5.3 × 10⁻⁴ |
| (F + E)/(THF + 5αTHF + THE) | 593 | 0.45 (−7.38 to 8.35) | 0.91 | 1.08 (−9.46 to 11.61 | 0.84 | −1.34 (−16.23 to 13.77) | 0.86 | 0.2 (−7.65 to 8.12) | 0.96 | 0.17 (−0.24 to 0.58) | 0.42 |
| 11β-hydroxysteroid dehydrogenase type 1 deficiency/apparent cortisone reductase deficiency | |||||||||||
| THE/(THF + 5αTHF) | 593 | 0.18 (−1.68 to 2.02) | 0.85 | 0.1 (−3.09 to 3.31) | 0.95 | 0.11 (−3.72 to 3.89) | 0.95 | 0.88 (−1.01 to 2.76) | 0.37 | 0.15 (0.05 to 0.24) | 0.0024 |
| (αCl + βCl)/(αC + βC) | 681 | −0.1 (−0.91 to 0.71) | 0.82 | 0.05 (−1.16 to 1.26) | 0.93 | −0.27 (−1.88 to 1.34) | 0.74 | 0.22 (−0.61 to 1.04) | 0.61 | 0.08 (0.04 to 0.12) | 4.3 × 10⁻⁴ |
| 20α-Hydroxysteroid dehydrogenase deficiency | |||||||||||
| (THF + 5αTHF + THE)/(αC + αCl) | 597 | 0.57 (−0.43 to 1.56) | 0.27 | 0.66 (−0.62 to 1.94) | 0.31 | −0.23 (−2.19 to 1.73) | 0.82 | 0.51 (−0.49 to 1.51) | 0.32 | −0.04 (−0.09 to 0.02) | 0.18 |
| 20β-Hydroxysteroid dehydrogenase deficiency | |||||||||||
| (THF + 5αTHF + THE)/(βC + βCl) | 619 | 0.05 (−0.51 to 0.61) | 0.87 | 0.27 (−0.53 to 1.06) | 0.51 | −0.42 (−1.5 to 0.67) | 0.45 | 0.05 (−0.51 to 0.61) | 0.87 | −0.01 (−0.04 to 0.02) | 0.66 |
| 20α-Hydroxysteroid dehydrogenase activity vs 20β-hydroxysteroid dehydrogenase activity | |||||||||||
| (αC + αCl)/(βC + βCl) | 681 | −0.74 (−1.77 to 0.28) | 0.16 | −0.25 (−1.85 to 1.34) | 0.76 | −0.82 (−2.84 to 1.22) | 0.44 | −0.76 (−1.78 to 0.27) | 0.15 | 0.02 (−0.04 to 0.07) | 0.52 |
| 3α-Hydroxysteroid dehydrogenase deficiency | |||||||||||
| 20αDHF/(THF + 5αTHF) | 626 | −25.8 (−59.4 to 8.47) | 0.14 | −30.5 (−121 to 61.0) | 0.52 | 5.34 (−92.3 to 103) | 0.92 | −8.2 (−48.7 to 32.9) | 0.70 | 1.41 (−0.42 to 3.24) | 0.14 |
Increasing values of the ratios are indicative of an increasing enzyme activity or an increasing enzyme deficiency, or an increasing activity of an enzyme pathway in proportion to another enzyme pathway as described in the enzyme names. The β coefficient (β) represents the degree of change in the dependent variable (handgrip strength) for every one unit change in the metabolite ratio as a predictor variable and has the unit kilograms. Men were coded to be 0 and women to be 1 in all models. All models were calculated by mixed-effects linear regression, taking family as a random effect into account and were adjusted for sex, age, BH, daily physical activity, current smoking, regular caffeine and alcohol consumption, hypertension, diabetes, serum albumin, estimated glomerular filtration rate, hemoglobin, and study center.
Abbreviations: 5α3αdiol, androstanediol; 5αTHF, allo-TH-cortisol; 11βOHAT, 11β-OH-androsterone; 11βOHET, 11β-OH-etiocholanolone; 16OHDHEA, 16α-OH-dehydroepiandrosterone; 20αDHF, 20α-DH-cortisol; AT, androsterone; DH, dehydro; DHEA, dehydroepiandrosterone; E, cortisone; ET, etiocholanolone; F, cortisol; OH, hydroxy; TH, tetrahydro; THE, TH-cortisone; THF, TH-cortisol; αC, α-cortol; αCl, α-cortolone; βC, β-cortol; βCl, β-cortolone; Δ5-diol, androstenediol.
Discussion
Overall, androsterone, its 5β-epimer etiocholanolone, and 11β-OH-androsterone were by far the three most excreted androgen metabolites in the studied population, accounting together for >80% of measured urinary androgens in men and women. These results corroborate previous findings by Shackleton (61) and Gronowska et al. (62) in smaller populations using GC-MS methods. Among the three most excreted androgens, a strong positive association with lean mass was found for 11β-OH-androsterone, as well as for androsterone only in middle-aged and older adults, and no association was found for etiocholanolone. Consistent to these findings, a higher lean mass was found to be positively associated with a possibly higher activity of the alternative backdoor pathway to androgen biosynthesis and in younger adults also with a possibly higher activity of the Δ4-pathway of the 17α-hydroxylase. For handgrip strength, a strong positive association was shown for dehydroepiandrosterone and its metabolite 16α-OH-dehydroepiandrosterone, and also for androsterone, etiocholanolone, and 5-androstenetriol, but not for 11β-OH-androsterone. In older adults, a higher handgrip strength mass was also found to be positively associated with a possibly lower activity of the 3β-hydroxysteroid dehydrogenase and a possibly higher activity of the CYP17-17,20-lyase. The associations with handgrip strength were robust and persisted even when multivariable models were further adjusted for lean mass. The results suggest that different androgens and different enzymatic pathways to androgen biosynthesis may exert different and in part age-dependent effects on whole-body skeletal muscle mass and on muscle strength of the upper limbs and that the effects on muscle strength may be independent of muscle mass.
Dehydroepiandrosterone together with its sulfonated form dehydroepiandrosterone sulfate stand at the beginning of human synthesis pathways to sex steroids and are the most abundant circulating steroid hormones mainly secreted by the zona reticularis of the adrenal glands (63, 64). In an epidemiologic study including nearly 900 healthy older men and women, higher levels of circulating dehydroepiandrosterone sulfate were associated with lower levels of frailty and with higher grip strength (65). These findings, and the associations found in the current study, may be due to a direct role of dehydroepiandrosterone sulfate at physiologic levels in the regulation of muscle differentiation by the following mechanisms: (i) decreased transcription of the MuRF-1 protein, which degrades myosin heavy chain and other sarcomeric thick proteins; (ii) increased expression of the muscle-specific transcription factor myogenin and of the heat shock protein Hsp70, which is decreased during aging or muscle disuse; and (iii) increased activity of creatine kinase (66). The result of the current study with a robust association of urinary dehydroepiandrosterone and of its metabolite 16α-OH-dehydroepiandrosterone with handgrip strength further supports the hypothesis that dehydroepiandrosterone and/or its sulfonated form are associated with a more efficient and functional state of muscle, in particular in the elderly.
In contrast to dehydroepiandrosterone, it is comparatively more challenging to generate statements about the potential influence of urinary androgen metabolites on muscle mass and function and whether these metabolites are direct products of testosterone or even stand at the end of the human synthesis pathway to sex steroids. This is due to the presence of different possible pathways to androgen biosynthesis enabling the generation of different sequences and amounts of intermediate sex hormone metabolites. The origin of urinary sex hormone metabolites associated with lean mass and handgrip strength in this study is therefore of potential interest. Early studies using chromatography methods identified androsterone and etiocholanolone as the main urinary testosterone metabolites in young and elderly men and women after administration of a single dose of radiolabeled [4-14C]testosterone (67, 68). Additionally, the urinary excretion of androsterone and etiocholanolone measured by GC-MS rose after oral ingestion of each of the testosterone precursors dehydroepiandrosterone, androstenediol, or androstenedione (69, 70). Conversely, 11β-OH-androsterone was shown to be the main metabolite of radiolabeled [4-14C]11β-OH-androstenedione in humans (71), which mainly results from adrenal 11β-hydroxylation of androstenedione (72). The pathway via 17α-hydroxypregnenolone → dehydroepiandrosterone → androstenedione (please refer to Fig. 1) is attributed the dominant role in human biosynthesis of testosterone (73), which is formed in men mainly in the testis and in women, to a lesser extent, in the ovary and adrenal gland (74). Although testosterone is the main endogenous steroid exerting potent anabolic effects on musculoskeletal development, androstenedione, androstenediol, and 11β-OH-androstenedione are so far suggested to be prohormone-like precursors of active androgens in peripheral tissues and 11β-OH-androsterone is assumed so far to be an inactive androgen metabolite (72, 75). Furthermore, endogenous 5α-reduced androgens, including androsterone and to a lesser extent also etiocholanolone, were shown to be potent inhibitors of the enzyme aromatase (76). Androsterone inhibits the formation of estrogens from circulating androgen precursors and might thereby exert anabolic effects by locally increasing androgen levels in the muscle. On this background, our results are surprising in that they reveal a strong positive association between an estrogen metabolite and lean mass; it remains further unclear why this association was found exclusively for estriol, but not for 17β-estradiol, and exclusively in men, but not in women. In addition to their aromatase-inhibiting effects, androsterone and again to a lesser extent also etiocholanolone are ascribed to be neurosteroids with anticonvulsant properties by modulation of inhibitory γ-aminobutyric acid A (GABAA) channels (77). The GABAA channel and its subunits are ubiquitously expressed in neuronal tissues of the mammalian central and peripheral nervous system and were also found in smooth muscle cells from different organs and in neuroendocrine cells and fibroblasts, but not in skeletal muscle cells (78, 79). Whether the age-specific association of androsterone with lean mass and handgrip strength in this study may also be influenced by the modulation of GABAA channels remains unknown.
For most metabolites of cortisol and cortisone a strong positive association with lean mass was revealed. Moreover, a higher lean mass was associated with a possibly higher enzymatic activity of the 20α-hydroxysteroid dehydrogenase pathway compared with the 20β-hydroxysteroid dehydrogenase pathway activity. Three cortisol metabolites showed a positive association with handgrip strength only in young to middle-aged adults, whereas the cortisone metabolite TH-cortisone showed a strong positive association with handgrip strength without a modifying effect by age. However, an age-modifying effect was found on the association between handgrip strength and ratios indicative of 11β-hydroxysteroid dehydrogenase type 1 and type 2 pathway activities. The associations of glucocorticoid metabolites and ratios with handgrip strength persisted even when multivariable models were further adjusted for lean mass. We found one single study investigating the association between urinary glucocorticoids and muscle strength and size. In univariable analysis, total 24-hour urinary excreted glucocorticoid metabolites were positively associated with mid-thigh quadriceps cross-sectional area (β-coefficient, 0.61; P < 0.01) and isometric knee extensor strength (β-coefficient, 0.45; P < 0.05) in a group of 30 older women and men but not in a another group of 52 younger and older men (80). After adjusting for age, sex, and BMI, the positive association of urinary excreted glucocorticoid metabolites with muscle size and strength in the group of 30 older women and men disappeared, possibly due to a relatively modest sample size. However, in the same study, in muscle biopsies from men and women at a mean age of ∼80 years, higher levels of mRNA encoding for the cortisol-amplifying enzyme 11β-hydroxysteroid dehydrogenase type 1 were associated with reduced isometric knee extensor strength; however, no association was found with mid-thigh quadriceps cross-sectional area, suggesting that glucocorticoids may effect muscle strength more than muscle mass (80). In another study, 11β-hydroxysteroid dehydrogenase type 1 mRNA expression from the m. vastus lateralis was found to be negatively correlated with TLM and grip strength in 40 healthy men and with grip strength only in 45 healthy women (81). To our knowledge, our study is the first one investigating the association between urinary glucocorticoids and muscle strength and size in such a large cohort. Whereas physiological levels of androgens enhance both muscle mass and strength, especially at a higher age, physiological levels of glucocorticoids may increase muscle mass at all ages, but muscle strength especially at a younger age. Our results are in line with the numerous studies having shown that glucocorticoid administration enhances physical performance in athletes (37, 38). The age-related decline in muscle strength appears to result from both a decline of muscle mass and from an aging-related slowing of motility speed of actin filaments expressing the slow type I/b myosin heavy chain isoform (82). The results of the current study suggest that age- and sex-specific differences in muscle mass– and force-generating capacity of upper limb muscles may be influenced by steroid hormones.
In contrast to previous findings (33–36, 40), our study did not find an inverse association of glucocorticoids with muscle mass or strength. This might be due to the fact that the relationship between glucocorticoids and skeletal muscle atrophy has been previously described in particular in the proximal lower limbs. Lean mass measured by BIA in this study represents the whole-body skeletal muscle mass and was not restricted to proximal lower limbs muscle mass, although lower limb mass contributes most to whole-body lean mass (83). Likewise, muscle strength was measured in the upper limbs and not in the lower limbs, yet handgrip strength was found to be strongly related to lower limbs muscle strength (5). More importantly, we assessed the association between steroid hormones and muscle parameters in mostly healthy individuals, who exhibit hormone levels in a physiological range, whereas deleterious effects of glucocorticoids on muscle mass and function were hitherto investigated and found in individuals who were exposed to elevated levels of glucocorticoids. Similar to hypercortisolism, which can cause glucocorticoid myopathy, isolated cortisol deficiency due to secondary hypocortisolism is a rarely described condition that can cause muscle weakness and even respiratory failure due to a myopathy (84). Thus, whereas glucocorticoids at very high or at very low levels can induce myopathy, the results of this study suggest that glucocorticoids within a physiological range may exert anabolic effects on skeletal mass and may improve muscle function in upper limbs, although this has to be studied longitudinally and experimentally and cannot be inferred uniquely from this cross-sectional analysis of observational data. A recently published cross-sectional analysis based on the German Cushing registry systematically investigated the influence of elevated glucocorticoid levels on handgrip strength: a lower handgrip strength, normalized for age and sex, was found in patients with active pituitary and ectopic Cushing syndrome, but not in patients with adrenal Cushing syndrome, compared with obese controls, whereas proximal lower limb strength, measured by a chair rising test, was lower in all subgroups with Cushing syndrome (85). Additionally, handgrip strength did not correlate with urinary cortisol or biochemical parameters of disease activity in this study, and handgrip strength even further decreased after remission from surgically cured Cushing syndrome. The decrease of muscle strength after the successful treatment was explained inter alia by a slow recovery of anabolic factors, such as growth and sex hormones, which may have been suppressed during florid Cushing syndrome (86). However, a more important explanation for this observation may be the prolonged presence of a glucocorticoid withdrawal syndrome, which is characterized by symptoms of adrenal insufficiency despite the presence of acceptable serum cortisol levels (86). This is compatible with the hypothesis that glucocorticoids within a physiological range may exert anabolic effects on skeletal mass and may improve muscle function in upper limbs. Our results are also concordant with the observation that glucocorticoid treatment improves muscle function in patients with Duchenne muscular dystrophy (37). A recent study found that the molecular pathway responsible for the effect of glucocorticoids on muscle atrophy differs from the one linking glucocorticoid administration to a favorable impact on muscle function in patients with Duchenne muscular dystrophy (37).
This study has certain limitations. It has a cross-sectional design and therefore allows only exploring associations but not inferring causal relationships. Another limitation is that body composition was assessed by measuring bioelectrical single arm-to-leg impedance at a single frequency instead of using CT, MRI, or dual-energy X-ray absorptiometry. However, results of BIA under standard conditions have been found to correlate well with MRI- and dual-energy X-ray absorptiometry–based measurements (5). Moreover, estimations of TBW in healthy volunteers using the same single-frequency 50-kHz Bodystat 1500 analyzer correlated very well with TBW as measured by tritium dilution, the invasive and time-consuming gold standard, and were more accurate than measurements derived from a dual-frequency BIA device (48). With regard to steroid hormone analysis, GC-MS is still considered as the gold standard for comprehensive steroidomics (32), and the use of 24-hour urine samples is a noninvasive and viable method in adults and represents the body steroid production over an entire diurnal cycle.
In conclusion, we analyzed the association between a variety of sex hormones, glucocorticoids, and steroid hormone metabolite ratios characterizing enzyme activities with parameters of muscular mass and function in a population-based cohort. To the best of our knowledge, this is the most extensive observational study to date of its kind. Our main finding is that within a physiological range, not only sex steroid hormones but also glucocorticoids are strongly positively associated with lean mass and handgrip strength, in line with anabolic effects on skeletal mass and improved muscle strength in upper limbs. The association with muscle strength appears to be independent of muscle mass. Our data further suggest that sarcopenic-related alterations are attenuated by androgens in particular at older age, whereas higher amounts of glucocorticoids are associated with higher skeletal muscle mass at all ages, but are associated with muscle strength in particular in younger adults.
Abbreviations:
- BH
body height
- BIA
bioimpedance analysis
- BMI
body mass index
- BW
body weight
- GC-MS
gas chromatography–mass spectrometry
- GABAA
γ-aminobutyric acid A
- SKIPOGH
Swiss Kidney Project on Genes in Hypertension
- TBW
total body water
- TFM
total fat mass
- TLM
total lean mass
Acknowledgments
We thank the study nurses Marie-Odile Levy, Guler Gök-Sogüt, Ulla Schüpbach, and Dominique Siminski for data collection and Pamela Perler and Jan Bertschinger for performing measurement of urinary steroids.
Financial Support: This work was supported by Swiss National Science Foundation Grant 33CM30-124087 to M.B. and by CTU Scientific Grant 84801054 of the Directorate for Education and Research, Inselspital, Bern University Hospital, University of Bern, Switzerland to N.A.D.
Author Contributions: A.P.-B., P.-Y.M., M. Burnier, B.V., and M. Bochud designed the SKIPOGH study. M. Bochud and N.A.D. designed the specific research project. D.A., M.P., B.P., I.G., G. Ehret, and S.E.Y. recruited the study participants. M.G., G. Escher, and C.H.d’U. developed, validated, and performed the GC-MS method. N.A.D. performed the statistical analyses and prepared all figures and tables. M. Bochud and N.A.D. wrote the original draft. All authors reviewed and edited the manuscript.
Disclosure Summary: The authors have nothing to disclose.
