


Abstract
Normal-weight women with polycystic ovary syndrome (PCOS) may have adipose tissue insulin resistance (adipose-IR).
To examine whether adipose-IR and subcutaneous (SC) abdominal adipose stem cell (ASC) gene expression are altered in normal-weight women with PCOS and correlated with hyperandrogenemia and/or whole-body IR.
Prospective cohort study.
Academic medical center.
Ten normal-weight women with PCOS and 18 control subjects matched for age and body mass index.
Women underwent circulating hormone and metabolic measurements, IV glucose tolerance testing, total-body dual-energy x-ray absorptiometry, and SC abdominal fat biopsy.
Adipose-IR (fasting insulin × total fatty acid levels) and SC abdominal ASC gene expression were compared between groups and correlated with clinical outcomes.
Adipose-IR was greater in women with PCOS than in control subjects (P < 0.01), with 29 pmol/L × mmol/L providing 94% specificity and 80% sensitivity in discriminating the two groups (P < 0.001). Adipose-IR positively correlated with serum androgen and log of fasting triglyceride (TG) levels, percentage of small adipocytes (P < 0.01, all correlations), and acute insulin response to glucose (P < 0.05); and negatively correlated with insulin sensitivity (Si; P < 0.025) and serum adiponectin levels (P < 0.05). Adjusting for serum androgens, adipose-IR correlations with Si and log TG levels remained significant. ASC genes were differentially expressed by the two groups. Expression of functionally critical genes was associated with serum testosterone and/or fasting insulin levels.
Normal-weight women with PCOS have increased adipose-IR and altered ASC gene expression related to hyperandrogenism and IR.
Polycystic ovary syndrome (PCOS) is characterized by hyperandrogenism, menstrual irregularity, and polycystic ovarian morphology (1). Women with PCOS by National Institutes of Health (NIH) criteria also can have insulin resistance (IR) resulting from abnormal insulin signaling and metabolic dysfunction in insulin-responsive tissues, as well as increased abdominal body fat over a wide range of body mass index (BMI) values (2–5). Moreover, in women with these conditions, reduced circulating levels of high-molecular-weight (HMW) adiponectin, an important insulin-sensitizing adipokine, inversely correlate with abdominal adiposity and hyperandrogenism independent of BMI (6, 7). Consequently, 33% to 47% of women with PCOS in the United States have metabolic syndrome, by various criteria, with a prevalence two to three times higher than that of age-matched control subjects, which is worsened with obesity (8–11).
In vitro studies show that cultured subcutaneous (SC) abdominal adipocytes from women with PCOS have diminished insulin-induced glucose transport, reduced GLUT-4 content, and decreased insulin-stimulated serine phosphorylation of glycogen synthase kinase (GSK)-3β (12, 13). Such dysfunction of PCOS adipocytes has been linked with androgen excess, because testosterone treatment reduces insulin-stimulated glucose uptake in normal SC abdominal adipocytes without affecting insulin-induced mitogenesis (14). Moreover, exposure of cultured SC abdominal adipose stem cells (ASCs) to testosterone impairs ASC commitment to preadipocytes and preadipocyte differentiation into newly formed adipocytes (15) through a process known as adipogenesis (16, 17). In the absence of extant testosterone, however, cultured SC abdominal ASCs from normal-weight women with PCOS have exaggerated commitment to preadipocytes as well as increased lipid accumulation in newly formed adipocytes (18), emphasizing complex adipose-hormone interactions (19–21).
Euglycemic-hyperinsulinemic clamp studies measure the ability of insulin to enhance adipose tissue glucose uptake and lipogenesis, and suppress lipolysis (22). This technique has shown that young women with PCOS exhibit adipose resistance, as seen in obese, but not nonobese, hyperandrogenic girls, in whom circulating free fatty acid (FFA) levels correlate with IR (23, 24). Furthermore, impaired insulin suppression of lipolysis, as determined by the euglycemic-hyperinsulinemic clamp, closely correlates with adipose tissue IR (adipose-IR), defined as the product of fasting circulating FFA and insulin levels (25), as a feature of adolescents with obesity (26).
Therefore, in this study, we examined whether adipose-IR and SC abdominal ASC gene expression are altered in normal-weight women with PCOS compared with age- and BMI-balanced normoandrogenic ovulatory control subjects and, if so, whether such alterations correlate with hyperandrogenemia and/or IR.
Materials and Methods
Study participants
We studied 10 normal-weight women with PCOS and 18 female control subjects (age range, 19 to 35 years; BMI, 19 to 25 kg/m2) who participated in our NIH-funded study in which adipose dysfunction in PCOS was examined (5). All participants were healthy, non-Hispanic white women. Clinical and hormonal data from six of the 10 women with PCOS and 14 of the 18 women in the control group have been published previously (5).
PCOS was diagnosed by 1990 NIH criteria (1) and biochemical hyperandrogenism was defined as an elevated mean serum total or free testosterone level from two blood samples collected on different days of >2 SD above the normal ranges of the age- and BMI- matched control group (1, 5). Women in the control group had normal menstrual cycles at 21- to 35-day intervals and a luteal phase progesterone level, and did not have hirsutism, acne, or alopecia (1). Exclusion criteria, including late-onset congenital adrenal hyperplasia (basal serum 17-hydroxyprogesterone level >2 ng/mL), thyroid dysfunction, and hyperprolactinemia, have been reported (5). All studies were performed according to the Declaration of Helsinki after approval by the University of California, Los Angeles, Institutional Review Board and informed consent was signed by each subject.
Body fat distribution
Waist and hip measurements were determined in all participants. Nine women in the PCOS group and 16 in the control group also underwent total body dual-energy x-ray absorptiometry, with data from six in the PCOS group and 13 in the control group published previously (5). Android and gynoid fat regions were defined as from the first lumbar vertebra to the top of pelvis and from the femoral head to the midthigh, respectively.
Blood sampling
Blood samples were collected from control subjects during the follicular phase and from the PCOS group during documented oligo-anovulation by serum luteal phase progesterone level. Fasting blood samples were collected immediately before frequently sampled IV glucose tolerance testing to determine total and free testosterone, androstenedione (A4), DHT, dehydroepiandrosterone sulfate (DHEAS), gonadotropins, estrone (E1), estradiol (E2), glucose, FFAs, insulin, SHBG, and lipid [i.e., total cholesterol, high-density lipoprotein (HDL), low-density lipoprotein (LDL), triglyceride (TG)] levels. Fasting blood and waist circumference (WC) values were used to calculate adipose-IR [calculated as the product of fasting circulating insulin (pmol/L) and total fatty acid (mmol/L) levels]; homeostatic model assessment of IR (HOMA-IR) ([insulin (μU/mL) × glucose (mmol)]/L/22.5); lipid accumulation product (LAP: [WC (cm) −58] × TG (mmol/L)]), visceral adiposity index (VAI: WC/[36.58 + (1.89 × BMI]) × [TG (mmol)/0.81] × [1.52/HDL (mmol)]) and TG index (ln[TG (mg/dL) × glucose (mg/dL)/2]) (27, 28).
The frequently sampled IV glucose tolerance testing was performed according to the modified minimal model of Bergman et al. (29). After an overnight fast, glucose in 50% concentration (0.3 g/kg) and regular human insulin (0.03 unit/kg) were injected IV at 0 and 20 minutes, respectively, and blood samples were collected at −20, −15, −5, 0, 2, 4, 8, 19, 22, 30, 40, 50, 70, 90, and 180 minutes to measure glucose and insulin levels. Mathematical modeling of serial plasma glucose and insulin levels by the modified minimal model of Bergman et al. (29) was used to define insulin sensitivity (Si) index (i.e., the action of insulin to accelerate glucose uptake and suppress glucose production), glucose effectiveness (Sg) index (i.e., the combined effect of glucose to enhance glucose uptake and suppress endogenous glucose production at fasting insulin levels), the acute response to glucose (AIRg; i.e., the pancreatic β-cell response to glucose infusion), and the disposition index (DI; or the β-cell compensation index; the product of Si index and AIRg).
Hormone and metabolite assays
Serum levels of total testosterone, A4, DHEAS, DHT, and E1 were quantified by liquid chromatography–tandem mass spectrometry (Quest Diagnostics Nichols Institute, San Juan Capistrano, CA). The manufacturer intra-assay coefficients of variation (CVs) were as follows: total testosterone, 5.6%; A4, 3.8%; DHEAS, 4.5%; DHT, 14.8%; and E1, 3%. The manufacturer interassay CVs were as follows: total testosterone, 9.5%; A4, 5.2%; DHEAS, 5.5%; DHT, 13.6%; and E1, 14.7%. Free testosterone was determined by the concentrations of total testosterone, SHBG, and albumin. The intra- and interassay CVs for free testosterone were 10.3% and 11.7%, respectively.
Serum measurements of insulin, LH, FSH, and E2 by electrochemiluminescence; glucose by a hexokinase method; and fasting lipids by spectrophotometry were performed at the University of California, Los Angeles, Center for Pathology Research Services. The laboratory intra-assay CVs were as follows: insulin, 0.6%; LH, 1.0%; FSH, 2.1%; E2, 7.0%; glucose, 0.8%; total cholesterol, 0.7%; LDL, 0.5%; HDL, 0.6%; and TG, 0.6%. The laboratory interassay CVs were as follows: insulin, 2.6%; LH, 2.3%; FSH, 2.8%; E2, 10.7%; glucose, 0.9%; total cholesterol, 1.0%; LDL, 1.2%; HDL, 0.9%; and TG, 0.7%
Serum FFA levels were measured by quantitative spectrophotometry (ARUP Laboratories, Salt Lake City, UT). The intra- and interassay CVs for FFAs were 1.9% and 1.7%, respectively. Serum determinations of HMW adiponectin by ELISA and of leptin by RIA were measured at the Endocrine Technologies Support Core Laboratory, Oregon National Primate Research Center. The intra-assay CVs for HMW adiponectin and leptin were 2.9% and 15%, respectively; the interassay CVs for HMW adiponectin and leptin were 11.1% and 20%, respectively.
SC abdominal adipocyte size
An SC abdominal fat biopsy was performed during the follicular phase in eight women with PCOS and 15 control subjects, as previously described (5), with approximately 100 mg of adipose tissue immediately transferred into liquid nitrogen and stored at −80°C until further use. Frozen tissue was embedded in optimal cutting-temperature medium, cut into 10- to 20-μm sections, and stained with hematoxylin and eosin. Images were digitally scanned using Aperio ScanScope (Leica Biosystems, Vista, CA) at ×20 magnification. Four sections per sample were sliced with ∼250 cells per section analyzed via manual cell circling. Adipocyte area was determined using Aperio ImageScope Software. Analysis of adipocyte size and cell distribution was determined as previously described (5).
Isolation and culture of SC abdominal ASCs
Approximately 0.5 to 1.0 g of freshly isolated adipose tissue was obtained from biopsy specimens of SC abdominal fat from four women in the PCOS group and four age- and BMI-matched control subjects a subset of the eight women from the PCOS group and 15 control subjects described in the previous paragraphs); the tissue was washed and digested at 37°C in DMEM containing 0.075% collagenase for 45 to 60 minutes on a shaker. Adipocytes were separated from pellets by centrifugation (800g for 10 minutes). Pellets containing stromal-vascular fraction were resuspended in DMEM/10% fetal calf serum (FCS), filtered through 150-mm mesh and washed with DMEM/10% FCS. Cells were plated in 60-mm dishes containing DMEM/10% FCS, 0.05 U/mL penicillin, 0.05 mg/mL streptomycin, and 1.25 mg/mL fungizone, and cultured at 37°C until cells reached confluency. First- and second-generation ASCs from each subject were frozen and kept in liquid nitrogen.
RNA isolation and gene expression analysis
Total cellular RNA was isolated from dishes (2 × 10 cm) of SC abdominal ASCs from each subject using the RNeasy mini kit (QIAGEN, Carlsbad, CA) according to manufacturer’s protocol, and the samples was used for DNA microarray analysis and quantitative reverse transcription polymerase chain reaction (qRT-PCR). DNA microarray gene expression profiling was performed using Affymetrix GeneChip Human Genome U133 Plus 2.0 arrays (Affymetrix, Santa Clara, CA). The criterion for selecting differentially expressed genes for additional analysis was set at 1.5-fold difference in either direction. Functional groups, canonical pathways, and gene networks were generated through QIAGEN’s Ingenuity Pathway Analysis (Redwood City, CA).
First-strand cDNA was synthesized using a High-Capacity cDNA Reverse Transcription Kit and amplified using gene-specific TaqMan gene expression assays and gene expression master mix, before being run on an ABI 7300 using standard temperature cycling conditions (all from Applied Biosystems, Foster City, CA). Glyceraldehyde-3-phosphate dehydrogenase (GAPDH) and β-actin (ACTB) were used as internal controls (Applied Biosystems, Foster City, CA). The relative expression of target genes was measured using the comparative critical threshold (Ct) method and results were expressed as fold changes (PCOS vs control). qRT-PCR was subjected to at least four independent experiments performed in triplicate.
Statistical analysis
Student t test was used to compare circulating hormone and metabolite levels; adipose-IR; measures of insulin resistance; body fat and its distribution; Si, Sg, AIRg, and DI; percentage of small adipocytes; and SC abdominal ASC gene expression between the PCOS and control groups. As a sensitivity analysis, the difference in adipose-IR between the groups also was compared, using the Wilcoxon test. Measures with skewed distributions from outlying values (e.g., LH, TG, AIRg) were log transformed before analysis (30).
Fisher exact test was performed for statistical analysis of microarray data for differentially expressed SC abdominal ASC gene expression (as performed automatically by the software, P < 0.05). Pearson correlation coefficients were computed to assess associations of adipose-IR and SC abdominal ASC gene expression by qRT-PCR with relevant clinical outcome variables. Partial correlation coefficients (adjusted for serum total testosterone and free testosterone levels based on associations in univariate analysis) were also computed to determine if any associations with adipose-IR remained significant after adjustment for serum androgen levels.
Adipocyte size was transformed by natural log transformation, with a log value <7.0 used to identify a subpopulation of small adipocytes, as previously described (5). A receiver operating characteristic curve for PCOS status was constructed to assess the discrimination ability and to find a threshold of adipose-IR. Statistical analyses were conducted using SPSS, version 25 (IBM, Armonk, NY) and P < 0.05 was considered statistically significant.
Results
Circulating hormone and metabolic characteristics
Age, BMI, and waist and hip measurements were similar between the PCOS and control groups (Table 1). Serum log LH, total testosterone, free testosterone, and serum A4 concentrations were significantly greater in the PCOS group than in the control group, whereas serum DHT and DHEAS levels were comparable between the two groups. Adipose-IR was significantly greater in the PCOS group (P = 0.007 for both t test and Wilcoxon test) than in the control group, due to concomitant trends toward increased fasting circulating insulin and total FFA levels in the former (Table 1; Fig. 1A). Moreover, an adipose-IR value of 29 pmol/L × mmol/L provided a specificity of 94% (95% CI, 84% to 100%) and sensitivity of 80% (95% CI, 55% to 100%) in discriminating between control subjects and subjects with PCOS (area under the curve, 0.81; 95% CI, 0.61 to 1.00; P < 0.001; Fig. 1B).
Characteristics of Normal-Weight Control Subjects vs Women With PCOS
| Control (n = 18) | PCOS (n = 10) | P Value | |
|---|---|---|---|
| Age, y | 27.2 ± 1.2 | 26.0 ± 1.6 | 0.560 |
| BMI, kg/m2 | 21.6 ± 0.4 | 22.4 ± 0.6 | 0.273 |
| Waist, cm | 75.7 ± 1.0 | 76.2 ± 1.7 | 0.782 |
| Hip, cm | 89.4 ± 1.3 | 88.0 ± 1.8 | 0.541 |
| Log LH, mIU/mL | 0.87 ± 0.05 | 1.11 ± 0.08 | 0.016a |
| Total testosterone, ng/dL | 29.5 ± 2.0 | 63.4 ± 5.2 | <0.001a |
| Free testosterone, pg/mL | 2.3 ± 0.3 | 6.0 ± 0.5 | <0.001a |
| A4, ng/dL | 111.3 ± 8.4 | 201.4 ± 27.5 | 0.010a |
| DHT, ng/dL | 9.8 ± 0.6 | 12.7 ± 2.1 | 0.217 |
| DHEAS, μg/dL | 190.8 ± 23.0 | 224.0 ± 20.1 | 0.341 |
| Adipose-IR, pmol/L × mmol/L | 18.3 ± 1.6 | 31.9 ± 3.8 | 0.007a |
| Fasting insulin, μU/mL | 4.7 ± 0.5 | 6.1 ± 0.7 | 0.094 |
| Total FFAs, mmol/L | 0.59 ± 0.06 | 0.74 ± 0.07 | 0.111 |
| HOMA-IR | 1.0 ± 0.1 | 1.3 ± 0.2 | 0.143 |
| Lipid accumulation product | 10.7 ± 1.2 | 20.4 ± 7.7 | 0.242 |
| Visceral adiposity index | 0.7 ± 0.1 | 1.5 ± 0.7 | 0.242 |
| Triglyceride index | 3.3 ± 0.1 | 3.5 ± 0.1 | 0.095 |
| Log of triglycerides, mg/dL | 1.71 ± 0.03 | 1.87 ± 0.08 | 0.088 |
| Total cholesterol, mg/dL | 156.2 ± 7.2 | 153.4 ± 10.8 | 0.828 |
| HDL-cholesterol, mg/dL | 65.4 ± 2.8 | 60.3 ± 4.4 | 0.308 |
| LDL-cholesterol, mg/dL | 79.2 ± 5.9 | 74.7 ± 9.3 | 0.671 |
| Non–HDL-cholesterol, mg/dL | 89.7 ± 6.3 | 93.0 ± 10.0 | 0.774 |
| SHBG, nmol/L | 68.2 ± 8.1 | 49.1 ± 5.6 | 0.064 |
| Fasting glucose, mg/dL | 85.0 ± 1.5 | 85.4 ± 1.4 | 0.866 |
| HMW adiponectin, ng/mL | 3330 ± 407 | 3084 ± 778 | 0.759 |
| Leptin, ng/mL | 25.2 ± 3.2 | 24.5 ± 3.2 | 0.882 |
| Si (×10−4/min/μU/mL | 6.2 ± 1.2 | 4.8 ± 0.8 | 0.351 |
| Log AIRg, μU/mL | 2.43 ± 0.04 | 2.56 ± 0.06 | 0.071 |
| DI [(Si × AIRg/100] | 20.4 ± 3.6 | 17.4 ± 2.6 | 0.516 |
| Sg (×10/min | 0.02 ± 0.00 | 0.02 ± 0.01 | 0.504 |
| (n = 16) | (n = 9) | ||
| Total body mass, kg | 61.9 ± 1.9 | 61.7 ± 2.8 | 0.945 |
| Lean body mass, kg | 39.8 ± 1.2 | 40.4 ± 1.8 | 0.790 |
| Total body fat mass, kg | 19.7 ± 0.8 | 19.8 ± 1.3 | 0.984 |
| Percent body fat | 31.8 ± 0.7 | 32.0 ± 1.4 | 0.898 |
| Percent android fat | 5.6 ± 0.2 | 6.6 ± 0.4 | 0.063 |
| Percent gynoid fat | 21.5 ± 0.4 | 20.7 ± 0.3 | 0.152 |
| (n = 15) | (n = 8) | ||
| Small adipocytes, mean ± SEM, % | 10.7 ± 1.3 | 18.2 ± 2.4 | 0.006a |
Conversions to SI units: LH, ×1.0 IU/L; testosterone, ×0.0347 nmol/L; free testosterone, ×3.47 pmol/L; A4, ×0.0349 nmol/L; DHT, ×0.0344 nmol/L; DHEAS, ×0.0271 μmol/L; insulin, ×7.175 pmol/L; TG, ×0.0113 mmol/L; total cholesterol, HDL-cholesterol, LDL-cholesterol, non–HDL-cholesterol, ×0.0259 mmol/L; glucose, ×0.0555 mmol/L; HMW adiponectin, ×0.001 μg/L; leptin, ×1.0 μg/L.
Statistically significant at P < 0.05.
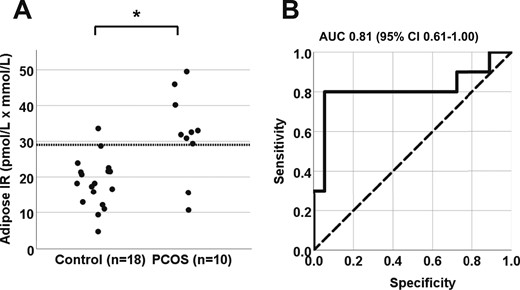
(A) Differences in adipose-IR between normal-weight women with PCOS (n = 10) and control subjects (n = 18; P = 0.007). Adipose-IR is defined as the product of fasting circulating insulin (pmol/L) and total fatty acid (mmol/L) levels. (B) Receiver operating curve for adipose-IR. An adipose-IR value of 29 pmol/L × mmol/L provided 95% specificity and 80% sensitivity in discriminating between women with PCOS and control subjects (P < 0.001). AUC, area under the curve.
HOMA-IR, LAP and VAI values (on an absolute, but nonsignificant level) were higher in women with PCOS than controls. Meanwhile the TG index trended to be greater in the PCOS vs control group due to a concomitant and similar trend in elevated log triglyceride levels of the women with PCOS. (Table 1). Fasting serum total cholesterol, HDL-cholesterol, LDL-cholesterol, and non–HDL-cholesterol levels were comparable between groups, whereas serum SHBG levels tended to be lower in the group with PCOS than in the control group. There were no differences between groups in circulating levels of fasting glucose, HMW adiponectin, and leptin (Table 1), or FSH, E1, and E2 (data not shown).
Insulin sensitivity in women with PCOS was reduced to within the lower-normal range, accompanied by a trend for increased log AIRg. The DI and Sg index values were similar between groups.
Abdominal adipose tissue characteristics
Dual-energy x-ray absorptiometry confirmed similar amounts of total body mass, lean body mass, total body fat mass, and percentage total body fat between groups (Table 1). The percentage of android fat relative to total body fat tended to be greater in women with PCOS than in control subjects, whereas the percentage of gynoid fat relative to total body fat was comparable between the two groups. Analysis of SC abdominal adipocyte size distribution revealed a significant increase in the percentage of small SC abdominal adipocytes in women with PCOS compared with the control group.
Significant clinical correlations
In all women combined, adipose-IR positively correlated with HOMA-IR (R = 0.64; P < 0.001), LAP (R = 0.45; P = 0.017), VAI (R = 0.41; P = 0.032), and TG index (R = 0.60; P = 0.001). Adipose-IR also positively correlated with serum total testosterone, free testosterone, and serum A4 concentrations (Fig. 2A–2C), as well as with the percentage of small SC abdominal adipocytes (Fig. 2D). Adipose-IR negatively correlated with Si (R = −0.48; P = 0.011), positively correlated with log AIRg (R = 0.42; P = 0.027) values (Fig. 3A and 3B), and was equal to HOMA-IR (R = −0.49; P = 0.008), and better than LAP (R = −0.26; P = 0.185), VAI (R = −0.22; P = 0.264), or TG index (R = −0.033; P = 0.087) in predicting Si.
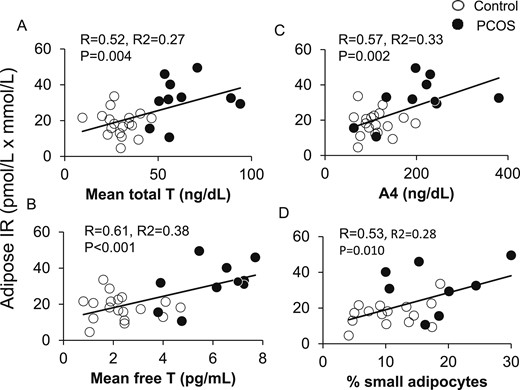
Positive correlations of adipose-IR with serum (A) total T, (B) free T, and (C) A4 levels in normal-weight women with PCOS (n = 10) and control subjects (n = 18) combined. (D) Positive correlation of adipose-IR and percentage of small SC abdominal adipocytes in these same normal-weight women with PCOS (n = 8) and control subjects (n = 15) combined. Adipose-IR is defined as the product of fasting circulating insulin (pmol/L) and total fatty acid (mmol/L) levels. A4, androstenedione; T, testosterone.
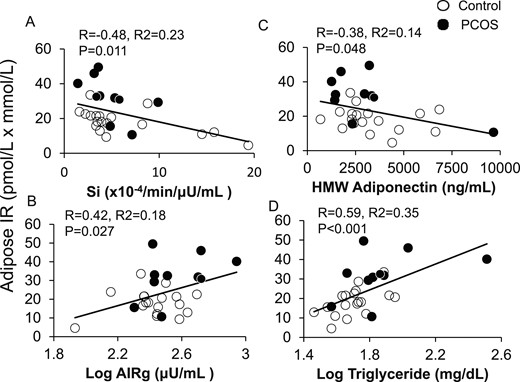
Positive and negative correlations of adipose-IR with (A) whole-body Si, (B) log AIRg, (C) serum HMW adiponectin levels, and (D) log fasting plasma TG levels in normal-weight women with PCOS (n = 10) and control subjects (n = 18) combined. Adipose-IR is defined as the product of fasting circulating insulin (pmol/L) and total fatty acid (mmol/L) levels.
Adipose-IR negatively correlated with HMW adiponectin levels and positively correlated with fasting serum log TG levels (Fig. 3C and 3D), and tended to positively correlate with percentage of android fat relative to total body fat (R = 0.36; P = 0.079). Adipose-IR was unrelated to total body mass, total body fat mass, or percentage of body fat (data not shown).
Serum total testosterone and free testosterone levels were included as partial correlation coefficients because of their significant associations with adipose-IR as univariate correlation coefficients. Adjusting for serum total testosterone or free testosterone levels, respectively, adipose-IR remained negatively correlated with Si values (R = −0.50; P = 0.008; R = −0.39, P = 0.042). Adjusting for serum total testosterone or free testosterone levels, respectively, adipose-IR also remained positively correlated with HOMA-IR (R = 0.63, P < 0.001; R = 0.53, P = 0.005), TG index (R = 0.59, P = 0.001; R = 0.53, P = 0.005), and log TG (R = 0.57, P = 0.002; R = 0.52, P = 0.006) levels, albeit to lesser degrees with LAP (R = 0.41, P = 0.034; R = 0.34, P = 0.079) and VAI (R = 0.39, P = 0.047; R = 0.31, P = 0.121). In contrast, the inverse relationship of adipose-IR with HMW adiponectin levels was influenced more by serum free testosterone levels (adjusting for free testosterone levels: R = −0.32; P = 0.101) than by total testosterone levels (adjusting for total testosterone levels: R = −0.39; P = 0.044). The relationships of adipose-IR with log AIRg, percentage of small SC abdominal adipocytes, and percentage of android fat relative to total body fat were essentially driven by androgens, because they were not significant, adjusting for serum androgen levels.
SC abdominal ASC gene expression
Differential expression of at least a 1.5-fold change (P < 0.05) was observed in 120 genes (48 up- and 72 downregulated genes) of SC abdominal ASCs from women with PCOS compared with control subjects (31). Differentially expressed genes by microarray analysis primarily involved androgen receptor (AR) function (2 up- and 5 downregulated genes); adipogenesis and lipid metabolism (26 up- and 23 downregulated genes); extracellular matrix (ECM; 10 up- and 20 downregulated genes); and angiogenesis and cardiovascular development (7 up- and 14 downregulated genes) (Table 2).
Gene Ontology Analysis of Up- and Downregulated Genes in SC Abdominal ASCs in Study Subjects
| Gene Symbol | |
|---|---|
| Androgen receptor | |
| Upregulated | FDXR, CXCL2 |
| Downregulated | ST3GAL5, IGFBP7, SERPINE2, JAG1, ANKRD1 |
| Adipogenesis and lipid metabolism | |
| Upregulated | CHI3L1, TNC, WARS2, CXCL5, ITGB1BP1, CYP26B1, CYP4V2, TAC1, THBD, SOX4, FGF18, TBX3, SCD, GPX3, CXCL2, CDKN1C, BNC1, APOC1, LAMA4, FADS1 /// MIR1908, CD52, ENO2, HOXB8, PLTP, HOXB6, HES1 |
| Downregulated | TGFB2, BDNF, ST3GAL5, CAP2, FMN2, GREM1, CTSB, IGFBP7, AHR, APOLD1, ARID5B, SEMA3A, JAG1, OSBPL11, WISP1, WNT5A, SERTAD4, IL7R, RGS7, MYOCD, PTGER4, LRRC17, HHIP |
| ECM | |
| Upregulated | CHI3L1, CRISPLD2, TNC, CACNA1A ///LOC100507353, ITGB1BP1, F11R, PRPH2, CXCL2, LAMA4, HES1 |
| Downregulated | TGFB2, LMO7, ST3GAL5, ITGA6, CTSB, IGFBP7, SERPINE2, JAG1, PRSS12, PCDHB3, WISP1, MYO10, WNT5A, NLGN1, TNFRSF11B, EDIL3, COL11A1, ACAN, NTN4, EPHA5 |
| Angiogenesis and cardiovascular development | |
| Upregulated | CHI3L1, TNC, CXCL5, ITGB1BP1, F11R, EDNRB, CXCL2 |
| Downregulated | TGFB2, ST3GAL5, CTSB, IGFBP7, ARID5B, SERPINE2, SEMA3A, WISP1, WNT5A, RGS4, TNFRSF11B, ANKRD1, NTN4, EPHA5 |
Data shown with 1.5-fold changes and P < 0.05; categorized into functions.
Significant functional group categories by gene ontology analysis via Ingenuity Pathway Analysis involved the following: development disorder, embryonic development, cellular movement, cell death and survival, hematological development, inflammatory response, cellular growth and proliferation, cell morphology, cell cycle, and cell signaling (P < 5.0 × 10⁻⁴ for all values; Fig. 4A). Canonical pathways with the most significant genetic changes were LXR/RXR activation, Notch signaling, oleate biosynthesis II, CDK5 signaling, epithelial-mesenchymal transition, VDR/RXR activation, production of nitric oxide and reactive oxygen species in macrophages, tight junction signaling, Wnt/β catenin signaling, and clathrin-mediated endocytosis signaling (P < 3.16 × 10⁻² for all values; Fig. 4B).
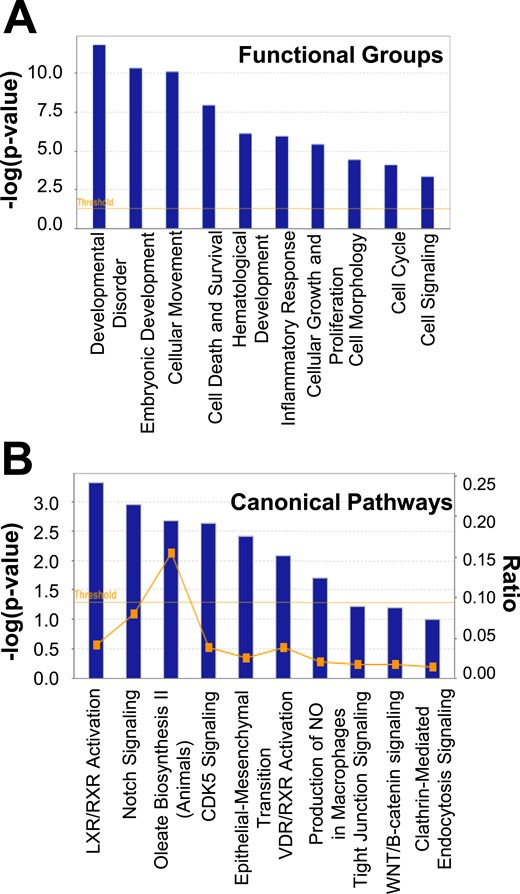
(A) Functional group categories and (B) canonical pathways generated by Ingenuity Pathway Analysis based on differentially expressed genes between SC abdominal ASCs of normal-weight women with PCOS and control subjects. NO, nitric oxide.
TGFβ1 was identified as the master upstream regulatory gene (P < 0.01), which modulated genes involved in AR function (FDXR, CXCL2, ST3GAL5, IGFB7, SERPINE2, ANKRD1, JAG1); adipogenesis and lipid metabolism (CH13L1, TNC, THBD, TBX3, SCD, CXCL2, TBX3, CDKN1C, WNT5A, ITGA6, BDNF, HES1, TGFB2, ST3GAL5, GREM1, CTSB, IGFB7, AHR, ARID5B, SEMA3A, SEMA3A, WISP1, JAG1, WISP1, WNT5A, SOX4, MYOCD, PTGER4); ECM formation (CH13L1, TNC, CXCL2, HES1, TGFB2, ST3GAL5, ITGA6, CTSB, IGFB7, WISP1, MYO10, WNT5A, SERPINE2, JAG1, TNFRSF11B, COL11A1, ACAN); and angiogenesis and cardiovascular development function (CHI3L1, TNC, EDNRB, CXCL2, TGFB2, ST3GAL5, CTSB, IGFBP7, ARID5B, SERPINE2, SEMA3A, WISP1, WNT5A, TNFRSF11B, ANKRD1) (Fig. 5).
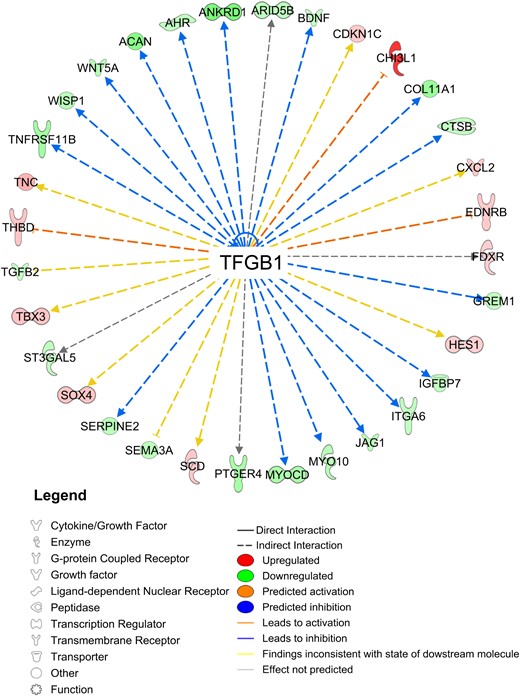
TGF-β1 as an upstream regulator of differentially expressed genes by study group.
Network function analysis indicated 12 differentially expressed genes involving lipid synthesis alone (four upregulated: TAC1, EDNRB, FADS1, FDXR; eight downregulated: BDNF, ST3GAL5, ITGA6, IGFBP7, AHR, SERPINE2, SEMA3A, SLC6A6); two genes involving lipid accumulation (downregulated: GULP1, RGS4); and five genes involving lipid synthesis and accumulation (four upregulated: SCD, APOC1, NR0B1, PLTP; one downregulated: UGCG) (Fig. 6).
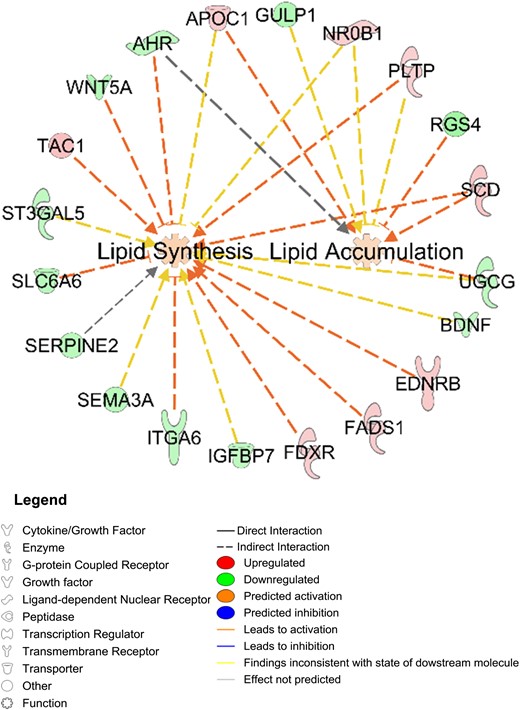
Differentially expressed SC abdominal ASC genes between women with PCOS (n = 4) and control subjects (n = 4) that involve lipid synthesis and/or accumulation.
Microarray data (fold change) were confirmed by qRT-PCR for specific genes related to AR function (ANKRD1: −2.0; P = 0.03); adipogenesis/lipid metabolism (HHIP: −2.2, P = 0.04; CYP26B1: 4.6, P < 0.01; TNC: 2.4, P < 0.01; CHI3L1: 7.9, P < 0.01; and MYOCD: −5.6, P < 0.01); ECM (ACAN: −4.0, P < 0.05; F11R: 1.8, P = 0.03; NTN4: −3.5, P = 0.01); and angiogenesis and cardiovascular development (EPHA5: −10.7, P < 0.01; Fig. 7A). Importantly, qRT-PCR results were reproducible in SC abdominal ASCs from both groups through up to five cell passages in vitro (data not shown).
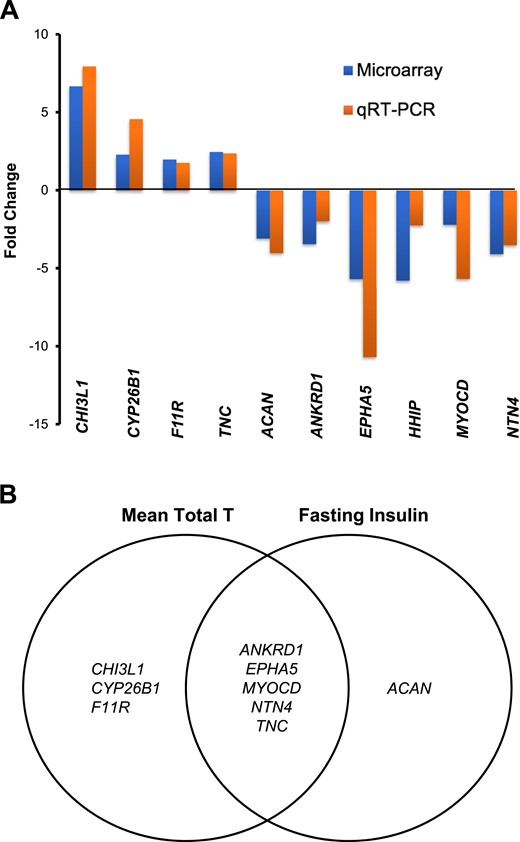
qRT-PCR validated microarray data of differentially expressed SC abdominal ASC genes between women with PCOS (n = 4) and control subjects (n = 4) that (A) involve lipid metabolism, ECM, and cardiovascular development (as fold change between PCOS vs control groups); and (B) correlate with serum T and/or fasting insulin levels in all women combined (n = 8). Genes related to AR function (ANKRD1), adipogenesis and lipid metabolism (CHI3L1, TNC, CYP26B1, and MYOCD), ECM (CHI3L1, TNC, F11R, ACAN, NTN4, and EPHA5), and angiogenesis and cardiovascular development (CHI3L1, TNC, F11R, ANKRD1, NTN4, and EPHA5) are listed. T, testosterone.
Eight differentially expressed genes of SC abdominal ASCs by group by qRT-PCR significantly correlated with serum total testosterone levels: CHI3L1, CYP26B1, F11R, and TNC were positively correlated, and ANKRD1, EPHA5, MYOCD, and NTN4 were negatively correlated (P < 0.05 for all). Furthermore, differential SC abdominal ASC gene expression of TNC was positively correlated, whereas ANKRD1, EPHA5, MYOCD, NTN4, and ACAN were negatively correlated, with fasting serum insulin levels (P < 0.05 for all values; Fig. 7B).
Discussion
IR in PCOS results from impaired insulin action in various target tissues (1). Besides IR in liver and skeletal muscle, impaired insulin action in adipose tissue also has been implicated in PCOS-related IR (3, 23). Using adipose-IR to measure adipose responsiveness to insulin in vivo, the current study shows adipose-IR was significantly greater in normal-weight women with PCOS than in age- and BMI-matched control subjects, with eight of 10 women in the group with PCOS having an adipose-IR value >29 pmol/L × mmol/L.
Adipose-IR positively correlated with serum androgen levels and percentage of small SC abdominal adipocytes in all women combined, implying an androgen effect on adipocyte function in vivo. This positive correlation of adipose-IR with percentage of small SC abdominal adipocytes was no longer significant after adjusting for serum total or free testosterone levels, which agrees with a positive relationship between serum androgen levels and percentage of small SC abdominal adipocytes in these subjects (5). The greater proportion of small SC abdominal adipocytes in normal-weight women with PCOS likely represents enhanced adipocyte hyperplasia in an attempt to maintain glucose-insulin homeostasis, as seen in other individuals (32–34). Moreover, a higher proliferation rate of SC abdominal ASCs in humans with obesity and without metabolic syndrome compared with those with metabolic syndrome implies that SC adipose tissue in the former individuals is better able to provide new adipocytes through hyperplasia during adipose expansion (35). In support of this, we have previously shown in normal-weight women with PCOS that exaggerated SC abdominal ASC commitment to preadipocytes during maturation in vitro negatively correlates with fasting plasma glucose levels as a possible mechanism to promote adipocyte hyperplasia for adipose expansion within an abnormal in vivo endocrine environment (18).
The negative relationship of adipose-IR with serum HMW adiponectin levels was affected more by serum free testosterone than by total testosterone levels, suggesting that androgen action on adipose-IR might also be influenced by hepatic SHBG through serum free testosterone levels. In this regard, adiponectin as an insulin-sensitizing adipokine stimulates hepatic SHBG secretion (36), whereas androgen inhibits adiponectin secretion in cultured 3T3-L1 adipocytes (37).
In contrast, adipose-IR remained negatively related to Si values, adjusting for serum total and free testosterone levels, implying a mechanism other than hyperandrogenemia contributes to low-normal insulin sensitivity in normal-weight women with PCOS. Adjusting for circulating testosterone levels, adipose-IR also remained positively correlated with HOMA-IR, TG index, log TG levels, LAP, and VAI as other, often abnormal, measures of IR in women with PCOS, regardless of BMI (27, 28, 38). Circulating FFAs in obese adolescents with PCOS are a greater determinant of IR than hyperandrogenism per se (23). Therefore, excess fatty acid influx into skeletal muscle and liver could promote diacylglycerol production, which, in turn, impairs insulin signaling via increased serine phosphorylation of insulin receptor substrate (21) and disrupts mitochondrial oxidative phosphorylation through lipotoxicity. Of interest, an adipose-IR value <29 pmol/L × mmol/L occurred in two normal-weight women with PCOS with the lowest fasting serum insulin levels within the PCOS group, perhaps reflecting sufficient lipid storage to meet the demands of their caloric intake vs energy expenditure (19, 20, 25, 28, 39).
Adipocyte number is set by early adulthood and remains stable thereafter through continuous adipocyte turnover in adult humans (34). Therefore, SC fat storage capacity may be developmentally programmed (40), as evidenced by an increased proportion of small SC abdominal adipocytes in the women with PCOS (5) and in PCOS-like adult rhesus monkeys with increased visceral adiposity that were treated prenatally with testosterone (41, 42) and in sheep with IR that were treated prenatally with testosterone (43). SC abdominal ASC gene expression of ANKRD1, a transcriptional repressor of the AR (44), was decreased in the women with PCOS and negatively correlated with serum total testosterone and fasting insulin levels in all women combined. Thus, ANKRD1 suppression in PCOS ASCs from androgen or insulin excess in vivo may permanently alter AR function in these cells and underlie the exaggerated lipid accumulation observed in these PCOS ASCs when cultured without extant androgen (18).
Furthermore, CYP26B1, a gene involved with breakdown of retinoic acid as an inhibitor of SC abdominal adipocyte differentiation in humans (45), was upregulated in PCOS SC abdominal ASCs and positively correlated with serum total testosterone levels in all subjects, as was CHI3L1, a gene implicated in mammalian visceral adipose accumulation, metabolic dysfunction, transforming growth factor-β (TGF-β)1 elaboration, ECM remodeling, and angiogenesis (46, 47). Conversely, MYOCD, encoding for myocardin proteins, was downregulated in these same PCOS ASCs and negatively correlated with serum testosterone and insulin levels, predicting enhanced adipocyte differentiation through suppression of MKL1, a myocardin-related murine mesenchymal stem cell transcriptional factor, that then would induce PPARγ (48). This gene expression profile of SC abdominal ASCs from normal-weight women with PCOS agrees with an exaggerated lipid accumulation in these cells when matured in vitro (18) and an altered gene expression favoring lipid metabolism in SC abdominal adipose tissue of nonobese women with PCOS (49).
Finally, TGF-β signaling is crucial during adipocyte differentiation (50–52), and TGF-β1 was an upstream regulator of 32 of 120 differentially expressed PCOS SC abdominal ASC genes. Among them were genes affecting ECM (ACAN, NTN4, EPHA5) and adipogenesis and angiogenesis (TNC), all of which were variably related to serum testosterone and/or fasting insulin levels. In women with PCOS, dysregulated TGF-β signaling has been linked with genetic variations of fibrillin 3, a component of microfibrils that interacts with latent TGF-β binding protein to regulate ECM bioactivity (53). In PCOS-like, prenatally androgenized female rhesus monkeys, similar disruption of TGF-β signaling accompanies altered DNA methylation patterns of visceral fat, implying an androgen-related developmental origin in PCOS for abdominal fat accumulation (54).
Important strengths of this study include the use of healthy, normal-weight women with PCOS by NIH criteria who were recruited from the general population to study a mild PCOS phenotype (55) and who also were matched for age and BMI with control subjects to eliminate these known confounder effects of age and obesity on adipose-IR (25, 26). Recruitment of non-Hispanic white subjects further eliminated ethnic differences in body fat composition and distribution (1), while recognizing the relevance of ethnicity and obesity on altered insulin sensitivity (56, 57). Consequently, differences in adipose-IR between the PCOS and control groups could be examined within a normal range of Si values and correlated with hormonal and metabolic variables, while eliminating glucose intolerance as another determinant of adipose-IR (26). In addition, ASCs isolated from minute amounts of SC abdominal adipose tissue (≤0.5 g) allowed us to investigate adipose development in normal-weight women with PCOS vs age- and BMI-matched control subjects, and show reproducible PCOS-related gene abnormalities in these ASCs over several cell passages in vitro, supporting constitutive cellular dysfunction.
Limitations of our study include its small number of women with PCOS, which diminished statistical power to examine interactions between adipose-IR and body fat distribution, and its inability to apply to individuals of different ethnicity or PCOS phenotype. Physical activity, diet, and sleep as factors affecting insulin action (23–25, 39) were not assessed and could influence the ability of adipose-IR to serve as an epidemiological tool in screening for PCOS. Also, androgen production within adipose tissue, regulated in part by insulin through intracellular aldo-ketoreductase type 3 1C3 (AKR1C3) activity (58), was not assessed; hyperinsulinemia euglycemic clamp studies, although essential for sophisticated mechanistic studies of adipose tissue insulin action, were beyond the scope of the current study. Finally, our in vitro studies examined SC abdominal ASC gene, rather than protein, expression as an indirect measure of potential ASC differentiation.
In conclusion, our data show that normal-weight women with PCOS have increased adipose-IR and altered SC abdominal ASC gene expression that are related to hyperandrogenism and insulin resistance. Although it is too soon to draw definitive clinical conclusions from this small pilot study, these correlations of adipogenic dysfunction in PCOS with hyperandrogenism and hyperinsulinemia introduce the possibility that SC abdominal adipose expandability through generation of new small adipocytes is programmed in early life and subsequently becomes insufficient to meet the metabolic demands of most normal-weight women with PCOS.
Abbreviations:
- A4
androstenedione
- adipose-IR
adipose tissue insulin resistance
- AIRg
acute response to glucose
- AR
androgen receptor
- ASC
adipose stem cell
- BMI
body mass index
- CV
coefficient of variation
- DHEAS
dehydroepiandrosterone sulfate
- E1
estrone
- E2
estradiol
- ECM
extracellular matrix
- FCS
fetal calf serum
- FFA
free fatty acid
- HDL
high-density lipoprotein
- HMW
high molecular weight
- HOMA-IR
homeostatic model assessment of insulin resistance
- IR
insulin resistance
- LAP
lipid accumulation product
- LDL
low-density lipoprotein
- NIH
National Institutes of Health
- qRT-PCR
quantitative reverse transcription polymerase chain reaction
- SC
subcutaneous
- Sg
glucose effectiveness
- Si
insulin sensitivity
- TG
triglyceride
- TGF-β
transforming growth factor-β
- VAI
visceral adiposity index
- WC
waist circumference
Acknowledgments
We thank Vanessa K. Madrigal, Samantha C. Fisch, and Nathaniel J. Phillips for their contributions in the cellular and microarray qRT-PCR studies; and Karla Largaespada and Dr. Rajanigandha Naik for subject recruitment strategies and administrative responsibilities that were crucial for the success of these studies.
Financial Support: This study was funded by a grant from the Eunice Kennedy Shriver National Institute of Child Health and Human Development, National Institutes of Health (NIH; Grants P50HD071836 to D.A.D. and P51 ODO11092 for the Endocrine Technologies Support Core through the Oregon National Primate Research Center); NIH National Center for Advancing Translational Science (University of California, Los Angeles Clinical and Translational Science Institute Grant UL1TR001881); and a grant to D.A.D. from the Santa Monica Bay Woman’s Club. The content is solely the responsibility of the authors and does not necessarily represent the official views of the NIH.
Disclosure Summary: The authors have nothing to disclose.
