


Abstract
To investigate the importance of dietary selenium (Se) for hyperthyroidism.
We performed a more in-depth analysis of a large cross-sectional study of 6152 participants from two counties within the Shaanxi Province, China. These counties are characterized by different habitual Se intake. We investigated the effects of a different dietary Se supply (0.02, 0.18, 0.6, or 2.0 ppm Se) on disease development in a mouse model of Graves disease (GD).
The cross-sectional study revealed a comparable prevalence of hyperthyroidism, irrespective of Se intake, in both counties. However, an unexpected sex-specific difference was noted, and Se deficiency might constitute a risk factor for hyperthyroidism, especially in males. In a mouse model, pathological thyroid morphology was affected, and greater Se intake exerted some protecting effects on the pathological distortion. Circulating thyroid hormone levels, malondialdehyde concentrations, total antioxidant capacity, and the titer of GD-causing TSH receptor autoantibodies were not affected by Se. Expression analysis of the transcripts in the spleen indicated regulatory effects on genes implicated in the immune response, erythropoiesis, and oxygen status. However, the humoral immune response, including the CD4/CD8 or T-helper 1/T-helper 2 cell ratio and the concentration of regulatory T cells, was similar between the experimental groups, despite the difference in Se intake.
Our data have highlighted a sexual dimorphism for the interaction of Se and thyroid disease risk in humans, with indications of a local protective effects of Se on thyroid gland integrity, which appears not to be reflected in the circulating biomarkers tested.
Two autoimmune thyroid diseases (AITDs) with very distinct etiopathological characteristics are highly prevalent [i.e., chronic lymphocytic thyroiditis, leading to hypothyroidism and thyroid gland destruction, and Graves disease (GD), causing an overactive thyroid gland with hyperthyroidism]. In general, AITDs develop more frequently in women than in men. In contrast, older men are at a greater risk of thyroid cancer (1). In GD, hyperthyroidism is caused by stimulating autoantibodies with a peak incidence at 40 to 60 years of age and affecting ~0.5% to 2% of women (2, 3). The susceptibility to GD is determined by both the personal genotype and the environment, of which smoking appears to be an important and preventable risk factor (4). The trace elements iodine and selenium (Se) are among the other modifiable factors potentially affecting GD risk on a given genetic background (5, 6). Se becomes inserted into selenoproteins as the 21st proteinogenic amino acid selenocysteine (7). Selenoproteins catalyze redox reactions (e.g., glutathione peroxidases, thioredoxin reductases) and iodothyronine deiodinases (7). Iodothyronine deiodinase isoenzymes are capable of either activation or inactivation of thyroid hormone (8, 9). The thyroid gland is characterized by a very high Se content and a wide spectrum of selenoproteins (10, 11), potentially implicated in thyroid hormone biosynthesis, protection from reactive oxygen species, and control of intracellular redox-sensitive pathways (8, 12).
A low habitual intake of Se has been associated with the risk of an increased thyroid volume and goiter (13), development of thyroid nodules (14), and hypothyroidism (15). Accordingly, several intervention studies have reported on the positive effects of supplemental Se on the quality of life, thyroid gland echostructure, and laboratory parameters in patients with chronic lymphocytic thyroiditis (15–17). However, not all trials have reported positive health effects, and currently no consensus has been reached regarding the criteria to identify those patients who will likely respond favorably to an Se-containing supplement (12, 18, 19). Despite this ambiguity, Se supplements have become actively prescribed by many endocrinologists (20).
Only a few studies have reported on the importance of Se for hyperthyroidism and GD. A cross-sectional study in the Danish population indicated that patients with newly diagnosed GD had lower serum Se concentrations compared with random controls (21). In a retrospective analysis, patients with GD with disease remission had greater serum Se levels (>120 µg/L) than those experiencing disease relapse (22). Supplemental Se might contribute to faster and more efficient normalization of thyroid parameters during treatment (23, 24) and improve the rate of remission in patients with GD (25). Patients with Graves orbitopathy (GO) display lower serum Se concentrations than those of patients with GD (26). However, neither the activity nor severity of GO appear to be related to the Se level (26, 27). Nevertheless, Se supplementation was reported to elicit positive effects on quality of life and disease symptoms in patients with mild GO (28). Two recently completed randomized clinical trials investigating supplemental Se in the short-term control of GD did not report positive health effects (29, 30). The reasons for these contradictory results are unclear but might reflect the complex and dynamically changing interaction of nutritional Se and selenoproteins in the immune system and thyroid gland (31–33). To gain more insight into these interactions, we performed an in-depth analysis of Se in relation to the incidence of hyperthyroidism in a large population study previously reported (34) and conducted an intervention study in a mouse model of GD by varying the dietary Se supply.
Methods
Cross-sectional population study
The design of the present cross-sectional population study has been previously reported (34). In brief, the prevalence of hyperthyroidism, disease symptoms, and Se status were compared in 6152 subjects from two counties with different soil Se concentrations [i.e., from Shaanxi province, Ziyang (n = 3038 subjects; adequate soil Se) and Ningshan county (n = 3114 subjects; low soil Se)]. The serum concentrations of TSH, total T4 (TT4), T3, and Se were measured as previously reported (34). The Medical Ethics Committee of Xi’an Jiaotong University approved the research protocol, and all participants provided written informed consent.
Animal study
Female Balb/c mice were purchased at the age of 3 weeks (Laboratory Animal Center of Jiaotong University School of Medicine, Xi’an, China) and maintained at ambient temperature with 12-hour light–dark cycles. They received specific diets containing different amounts of Se in relation to the recommended dietary allowance (RDA): 0.02 (low), 0.18 (~1 × RDA), 0.6 (~4 × RDA), or 2.0 (~10 × RDA) parts per million (ppm) of Se in the form of Se-enriched yeast (Research Diets; Mudanjiang Lingtai Pharmaceutical Co, China). After 5 weeks (i.e., at the age of 8 weeks), the mice (n = 10 in the GD groups and n = 5 in the control groups) were injected intramuscularly with 108 virus particles expressing the extracellular fragment of the TSH receptor (TSHR) adenovirus (Ad)-TSHR289 or control viruses expressing enhanced green fluorescent protein (Ad-enhanced green fluorescent protein) according to the method established by Nagayama et al. (35) and Chen et al. (36). The injection was repeated twice at 3-week intervals (i.e., at 8 weeks and 11 weeks after the start of the experiment). Serum samples were prepared from blood collected by retrobulbar venous plexus puncture at two time points during the experiment (Fig. 1a). To ensure that the high Se diet was not inducing toxicity, the mice were monitored for indicators of general health, including food consumption, body weight, coat appearance, and general grooming. In addition, liver tissue sections were analyzed after necropsy for histological features of toxicity. All animal care and treatments were in accordance with the Guide for the Care and Use of Laboratory Animals and had been approved by the local authorities at Jiaotong University School of Medicine, Xi’an, China.
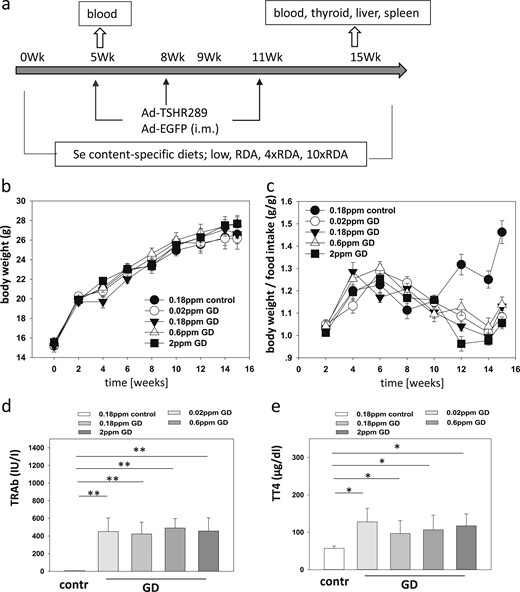
GD mouse model, Se supply, disease induction, and effects on thyroid parameters. (a) Eight groups of mice were raised using four different chows containing no (0.02 ppm), RDA (0.18 ppm), 4 times RDA (0.6 ppm), or 10 times RDA (2 ppm) supplemental Se in form of Se-enriched yeast. After 5, 8, and 11 wk, the mice were injected with solvent or Ad-TSHR289 to induce GD. Blood was taken after 5 wk and 15 wk at termination. (b) The age-dependent increase in body weight was not different among the five mouse groups. (c) When relating body weight to food intake, the control group showed the greatest weight gain per ingested calories compared with the hyperthyroid mice. (d) Increased TRAb concentrations in the serum of mice from the GD groups verified successful GD induction. Se supply did not affect the resulting TRAb levels. Double asterisks signify P < 0.01. (e) Hyperthyroidism was detected in the GD groups but not in the control group. The Se supply was without an effect on serum TT4. The single asterisk signifies P < 0.05.
Selenium analysis
The serum and liver Se concentrations were determined using dual channel hydride generation atomic fluorescence photometry (AFS-2202E; Beijing Haiguang Instrument Co., Beijing, China) using potassium borohydride as the reducing agent. The Se calibration curve covered a range from 0 to 150 μg/L. A certified reference material (ERM-DA120a; LGC, Teddington, United Kingdom) was used to validate the accuracy of the method. ERM-DA120a has a certified Se concentration of 64.1 μg/kg (95% CI, 61.1 to 67.1 μg/kg). With a serum density of 1.024 kg/L, this concentration corresponds to a Se concentration of 65.6 μg/kg (95% CI, 62.6 to 68.7 μg/L). Repeated measurements of this reference material indicated that the intra-assay and interassay coefficients of variation were <20% during the analyses.
Serum thyroid hormones
TT4 in mouse sera was measured at several time points using a competitive RIA method and commercial kits, in accordance with the manufacturer’s recommendations (Beijing North Institute of Biological Technology, Beijing, China). In brief, a fixed amount of 125I-labeled T4 competes with the T4 in the sample or in the calibrator for a fixed amount of anti-T4 antibody sites, which are bound to the goat anti-mouse antibodies immobilized to the wall of a polystyrene tube. After 1 hour of incubation at room temperature, an aspiration step terminated the competition reaction. The tubes were then washed with 2 mL of wash solution and aspirated again. A calibration curve was recorded, and the T4 concentrations of the samples were determined by interpolation from the calibration curve. The sensitivity for TT4 was 5 ng/mL, and the coefficients of the intra-assay and interassay variations were <10%.
Quantification of murine TSHR autoantibodies
Histological examination of thyroid glands
Dissected murine thyroid glands were fixed in 10% buffered formalin (pH 7.4), dehydrated, and embedded into paraffin. Sections (5 µm) were stained with hematoxylin and eosin. Analysis was performed using the Olympus Cue-2 image analysis system connected to an Olympus compound microscope. Hematoxylin and eosin–stained sections were photographed with a 20× objective, and the areas were calculated using Image Pro Plus software (Media Cybernetics, Rockville, MD). Thyroid samples were prepared from both hyperthyroid and euthyroid mice, and the follicle areas in five random fields were evaluated from each section.
Flow cytometric analysis
Spleen lymphocytes were suspended in flow cytometry staining buffer (eBiosciences, San Diego, CA) at a final concentration of 5 × 10⁶ cells/mL. Foxp3 expression in CD4+CD25+ T cells was detected using the mouse regulatory T cell staining kit (eBiosciences) according to the manufacturer’s protocol. The CD4+IL-4+ and CD4+ interferon-γ+ cells were detected by stimulation and then cultured for 6 hours with phorbol myristate acetate plus ionomycin (at 50 and 1 ng/mL, respectively; Sigma-Aldrich St. Louis, MO) at 37°C. These cells were then stained with fluorescein isothiocyanate–CD4 and Percp5.5-CD8 antibody (eBiosciences), fixed, and permeabilized. Next, the cells were incubated with anti-mouse IL-4 phycoerythrin and interferon-γ APC antibody (eBiosciences) for 30 minutes at 4°C in the dark. Four-color flow cytometric analyses were performed using flow cytometry (FACSAria; BD Biosciences, San Jose, CA). The data were analyzed using Cell Quest Software (BD Biosciences).
Determination of malondialdehyde and total antioxidant capacity
The experimental procedures for determining malondialdehyde (MDA) concentrations and total antioxidant capacity (T-AOC) were based on the protocols provided by the manufacturer (Beyotime Institute of Biotechnology, Haimen, China). Liver tissue homogenates were prepared using cell lysis buffer and clarified by centrifugation at 12,000g for 10 minutes at 4°C. T-AOC was measured by reduction of the ferric Fe3+–tripyridyltriazine complex to the ferrous form Fe2+– tripyridyltriazine. One unit of T-AOC was defined as the amount of antioxidant capacity that increased the absorbance at 593 nm by 0.01 at 37°C. The MDA concentration was determined after mixing the sample with thiobarbituric acid working solution and then measuring its absorbance at 532 nm, as recommended by the manufacturer (Beyotime Institute of Biotechnology).
Gene expression analysis
RNA was isolated from spleen and quantified using NanoDrop ND-1000 (Thermo Fisher Scientific, Carlsbad, CA). RNA integrity was assessed using standard denaturing agarose gel electrophoresis. Whole mouse genome oligo microarrays (Agilent Technologies, Santa Clara, CA) were used for gene expression analyses and offer a broad view of all known genes and transcripts in the mouse genome. Sample labeling and array hybridization were performed according to the Agilent One-Color Microarray-Based Gene Expression Analysis protocol (Agilent Technologies). Agilent Feature Extraction software, version 11.0.1.1, was used to analyze the acquired array images. Quantile normalization and subsequent data processing were performed using the GeneSpring GX, version 12.1, software package (Agilent Technologies). Differentially expressed genes between two samples were identified using fold change filtering. Hierarchical clustering was performed using the R scripts. Gene ontology and pathway analyses were performed using the standard enrichment computation method. Raw files were uploaded to the National Center for Biotechnology Information database (available at: https://www.ncbi.nlm.nih.gov/geo/query/acc.cgi?acc=GSE115152; approval accession number, GSE115152).
Statistical analysis
χ2 Tests were used to indicate the actual Se concentrations of the hyperthyroid subjects in relation to the average of the county. The Mann-Whitney U test was used to compare median serum Se concentrations between hyperthyroid and control subjects from the two counties. Data are presented as the mean ± SD (when normally distributed) or as the median and interquartile range otherwise. Statistically significant differences between the responses of the two experimental groups were determined using Mann-Whitney rank sum tests or, when normally distributed, the independent samples t test. Multiple comparisons were performed using an ANOVA or multivariate ANOVA, followed by a Bonferroni post hoc test. Serial measurements were compared using repeated measures ANOVA. SPSS, version 18.0, statistical software (IBM Corp., Armonk, NY) was used, and statistical significance was defined as P < 0.05 (two-tailed analysis).
Results
Prevalence of hyperthyroidism in relation to Se status in human subjects
The coexistance of Ziyang (adequate soil Se) and Ningshan (low soil Se) within an ~500-km distance in Shaanxi province provided the opportunity to compare populations with high genetic, environmental, and lifestyle similarities and comparable iodine status, but profoundly different Se intake (34). The baseline characteristics of the participants, the details of the demographic and lifestyle characteristics and serum Se in the two counties were reported previously (34). The median serum Se concentrations differed almost twofold between the two populations (103.6 vs 57.4 μg/L; P < 0.05). Despite this difference, the prevalence of hyperthyroidism was similar (1.3% vs 1.7%; P = 0.254), and the serum Se level did not differ between the males and females in the two counties (Table 1). A statistically significant and sex-specific difference was revealed in a cross-table analysis comparing the number of hyperthyroid subjects in Ziyang and Ningshan according to sex. The prevalence of hyperthyroidism in male subjects was significantly lower in the area with the greater Se supply (0.4% in Ziyang vs 1.2% in Ningshan; P = 0.045; Table 2). The prevalence of hyperthyroidism in the female subjects was not different between Ziyang and Ningshan (1.7% vs 1.9%; P = 0.544; Table 2).
Serum Se Concentrations in Ziyang and Ningshan Stratified by Sex
| Sex | Serum Se, μg/L (Median; IQR) | ||
|---|---|---|---|
| All (n = 6152) | Ziyang (n = 3038) | Ningshan (n = 3114) | |
| Male | 80.5 (52.7, 112.2) | 106.0 (81.1, 136.9) | 58.5 (41.1, 82.7) |
| Female | 80.3 (52.0, 111.9) | 102.6 (78.6, 135.2) | 56.8 (38.2, 81.9) |
| P value | 0.704 | 0.163 | 0.190 |
IQR, interquartile range.
No. of Hyperthyroid Patients in Ziyang and Ningshan Stratified by Sex
| Sex | Ziyang | Ningshan | P Value |
|---|---|---|---|
| Male, n | 0.045a | ||
| Hyperthyroidism | 4 | 13 | |
| Local control | 973 | 1058 | |
| Female, n | 0.544 | ||
| Hyperthyroidism | 37 | 42 | |
| Local control | 2168 | 2151 |
| Sex | Ziyang | Ningshan | P Value |
|---|---|---|---|
| Male, n | 0.045a | ||
| Hyperthyroidism | 4 | 13 | |
| Local control | 973 | 1058 | |
| Female, n | 0.544 | ||
| Hyperthyroidism | 37 | 42 | |
| Local control | 2168 | 2151 |
Statistically significant.
Establishment of a mouse model for GD and effects of Se supply on the phenotype
To test the general importance of Se status in GD development, we established a mouse model of GD and fed the mice diets with strongly different and well-defined Se contents during the experiment. The Se supply ranged from marginal (0.02 ppm Se) to a pharmacological supply (2 ppm Se). Four groups of female mice (GD) were injected at 3-week intervals with virus expressing the extracellular fragment of the TSHR Ad-TSHR289 or virus expressing an enhanced green fluorescent protein (control) variant (Fig. 1a). The body weights increased with similar dynamics and to a similar degree in all five groups of mice, irrespective of GD induction or the Se supply (Fig. 1b). As expected, the body weight gain per food intake was significantly greater in the control group than in the GD groups (Fig. 1c). The Se supply of the mice in the GD groups had no effect on the decreasing body weight gain per food intake. Successful induction of GD was verified by measuring the TRAbs. All four groups of GD mice had elevated TRAb concentrations; however, the control mice were negative for TRAbs (Fig. 1d). The final TRAb concentrations in the different groups of GD mice were not related to the Se supply during the experiment. The TT4 concentrations were elevated in all groups of GD mice compared with those in the control mice (Fig. 1e). Again, no detectable effect was found from the different Se supplies on the final TT4 concentrations in the hyperthyroid mice.
Relationship of Se intake with biomarkers of Se status and oxidative stress
The dietary Se concentrations in the present study were chosen to reflect the levels of an insufficient Se supply (0.02 ppm Se), intake according to the RDA (0.18 ppm Se), and a rather high (0.6 ppm) or even pharmacological (2 ppm Se) dose. Before the experiment, we confirmed that feeding the diets for 5 weeks to control mice would lead to strongly different Se status (data not shown). This result was verified in both the groups of control and the groups of GD mice. The serum and liver Se concentrations differed markedly at the end of the experiment (week 15) in relation to the Se supply (Fig. 2a and 2b). No substantial differences in the resulting Se status were observed when comparing the matched groups of control and GD mice receiving the same diets, neither in the serum nor in the liver (Fig. 2a and 2b). The effects of Se intake on antioxidant stress were determined by analyzing the T-AOC and MDA levels in all mice at the end of the experiment (week 15). Despite the various Se intakes and status, no substantial differences were found in these parameters in the control or GD mice (Fig. 2c and 2d).
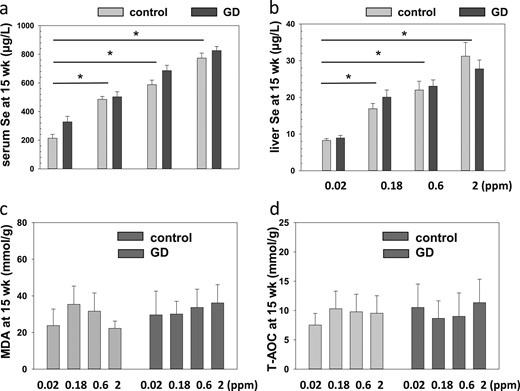
Se status in relation to food supply. (a) Serum Se and (b) liver Se concentrations differed between groups according to the Se supply in the chow at the end of the experiment (week). The single asterisk signifies P < 0.05. (c) Liver tissue MDA concentrations and (d) T-AOC were not different between the groups.
Effects of Se intake and GD induction on thyroid gland morphology
Compared with the control mice, the thyroid glands of the GD mice showed marked hypertrophy and exhibited thyrocyte hypercellularity, with intrusion into the follicular lumen indicating the presence of hyperactive cells (Fig. 3a). The thyroid follicles displayed a disease- and Se-dependent increase in size from an average of 33.4 ± 3.9 µm2 at 0.18 ppm Se in the control mice to 97.1 ± 15.3 µm2 in the GD mice receiving a low Se supply (Fig. 3b). A greater Se supply was inversely associated with follicle size in the GD mice, and the thyroid glands were visibly enlarged in the low Se supply conditions (Fig. 3c). Infiltrating lymphocytes were not observed in any of the glands analyzed.
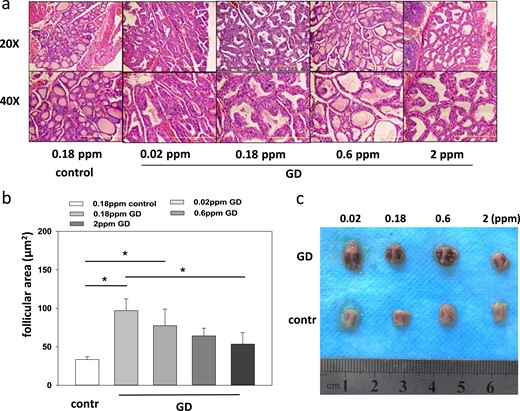
Se supply, disease induction, and effects on thyroid glands. (a) Thyroid histological examination revealed a more regular gland appearance with similar-size well-differentiated thyroid follicles in the control group compared with the GD groups. (b) Average follicle size differed between the groups and was similar to the control group in the group receiving the greatest Se supply. The single asterisk signifies P < 0.05. (c) Thyroid gland size differences stratified by GD and Se supply. The thyroid glands were prepared from both the GD and control mice on the different Se supplies. Representative organs are shown highlighting the tissue enlargement from GD and a mitigating effect of a high Se supply on thyroid hyperplasia.
Effects of Se supply on the pattern of immune cells in GD and control mice
In the present study, several GD-related cellular immune indexes were analyzed. No substantial differences were found in the concentrations of CD4+ cells, CD8+ cells, or CD4+/CD8+ cell ratio (Fig. 4a). Similarly, neither the concentrations of T helper (Th)1 or Th2 cells nor the Th1/Th2 cell ratio were significantly different between the groups of control and GD mice or between the four groups of GD mice receiving a different Se supply (Fig. 4b). Regulatory T cells are a subset of CD4+ lymphocytes expressing the surface marker CD25 and the transcription factor Foxp3. The ratio of CD4+CD25+ or CD4+CD25+Foxp3+ cells compared with the total number of CD4+ lymphocytes was similar in all the different groups of control and GD mice, with the notable exception of the control mice receiving the lowest Se supply (multivariate ANOVA, P = 0.013; Fig. 4c).
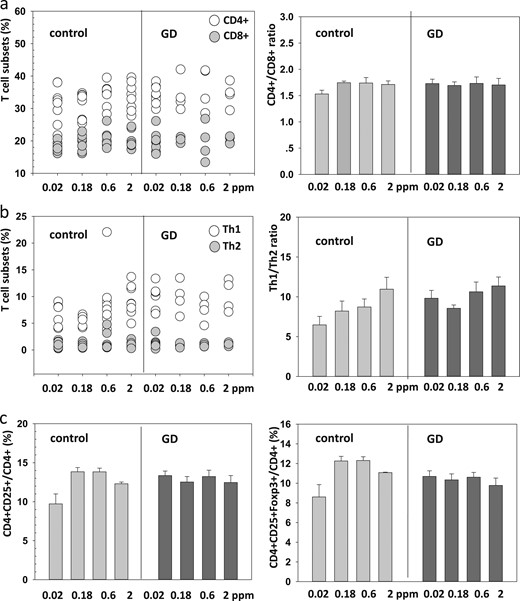
Immune status in relation to GD and Se supply. (a) The fraction of CD4+ or CD8+ cells among all T lymphocytes did not differ in relation to Se supply or between control and GD mice. The same applied to their relative ratio. (b) Similarly, the Se supply was not associated with the relative fraction of Th1 or Th2 cells nor their ratio. (c) The relative number of CD4+CD25+ cells in relation to all CD4+ cells was similar in mice from the different groups, with exception of the control mice receiving the lowest Se supply.
Effects of GD and Se on gene expression profiles in spleen
To evaluate the effects of the Se supply and GD on gene expression in the immune system, mRNA expression profiles were generated from spleen to compare the Se-deficient (0.02 ppm) and RDA-supplied (0.18 ppm) groups of mice with GD. The heat map indicates the genes particularly differently expressed between the groups (Fig. 5a). Several of these genes were selected for evaluation using quantitative reverse transcription PCR to test the reliability of the array results. All the genes chosen displayed significantly different levels of expression when comparing the spleen RNA from the Se-deficient and RDA-supplied mice (Fig. 5b and 5c).
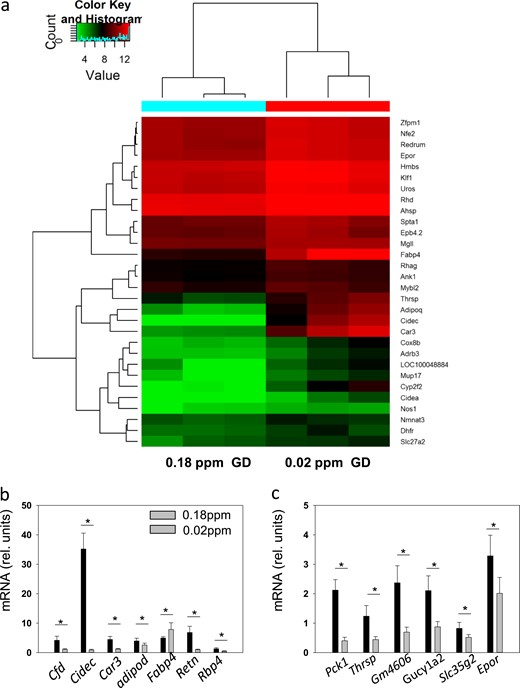
Effects of Se supply on gene expression in the spleen. (a) Heat map presentation of the differences between the Se-deficient and RDA-fed groups of GD mice. Red indicates increased and blue decreased expression levels. The genes associated with erythrocyte and oxidative stress are clustered. (b and c) Some regulated genes were validated using quantitative reverse transcription PCR. The single asterisk signifies P < 0.05.
Among the top 10 most obvious changes in the GO biological processes were genes operative in pathways related to drug, porphyrin, and fat metabolism (Fig. 6a). The KEGG pathway information provided additional insights, because several erythrocyte-related processes were among the top 10 most significantly affected pathways, including erythrocyte development, differentiation, and homeostasis (Fig. 6b). The core genes were identified from protein–protein interaction network analysis (Fig. 6c). The results indicated that Se status has a regulatory effect on the transcriptional expression patterns in splenocytes, thereby potentially affecting metabolism, erythropoiesis, oxygen transport, and oxygen status in GD.
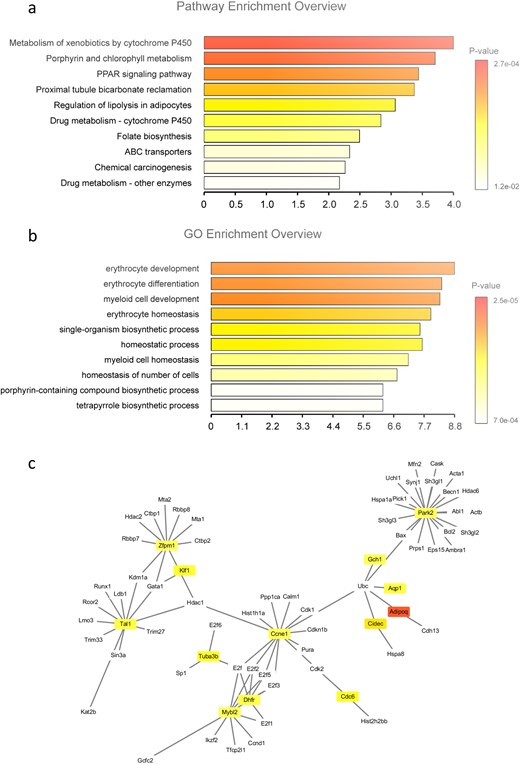
Differences in the expression of genes in GD mice. (a) Differences in the expression of genes centrally involved in certain biochemical pathways are observed when comparing groups of GD mice raised with a Se-deficient vs an RDA chow. (a) The 10 most substantially upregulated processes according to GO classification. (b) Presentation of the 10 most substantially upregulated biological pathways. The processes controlling the development of immune and red blood cells and the enzymes involved in porphyrin metabolism and homeostatic processes were affected by the Se-deficient vs RDA diet. (c) Presentation of the core gene networks affected, as identified by protein–protein interaction network analysis.
Discussion
The importance of the trace elements iodine and Se for thyroid hormone biosynthesis and feedback regulation is well established (6, 8). In particular, the devastating effects of a combined deficiency in both micronutrients on central nervous system development and growth have highlighted their essentiality for the thyroid axis (37). Although an iodine deficiency alone will be sufficient to cause a visible enlargement of the gland, an isolated Se deficiency will not cause an obvious phenotype and its relevance for thyroid pathology is not well understood. In the present study, we reanalyzed the data on thyroid disease prevalence and Se status from a large cross-sectional study comparing two highly similar populations with profoundly different Se intake. We reported previously that subclinical and manifest hypothyroidism, an enlarged thyroid, and autoimmune thyroiditis were more prevalent with low Se intake (34). This result was in agreement with data from some observational European studies, in which the Se concentrations were in a similar range and in which a low serum Se was associated with an increased risk of an enlarged thyroid, nodular goiter, and hypothyroidism (13, 14, 38).
Although a Se deficit should thus be considered a relevant and established risk factor for hypothyroidism and chronic lymphocytic thyroiditis, only a few studies have reported on the importance of Se for GD. Our present analysis revealed no substantial association between overall hyperthyroidism prevalence and Se status in women. In men, however, greater Se intake seemed to confer some protection from hyperthyroidism. This result points to an as yet unrecognized sexual dimorphism in relationship to Se supply and thyroid disease risk. The null findings in women, however, seem to contradict the results from former studies on the positive effects of supplemental Se on GD, in which faster restoration of euthyroidism receiving treatment (24), declining TRAb concentrations (25), or an improved quality of life and diminished eye symptoms in mild GO were observed (28). However, disease risk and treatment effects are different aspects of the Se and thyroid interaction. Moreover, the positive health effects of supplemental Se in patients with GD were not observed in all studies reported to date or are still waiting to be replicated. In particular, two recent reports from well-controlled supplementation trials reported null effects of supplemental Se in treatment groups consisting primarily of female subjects (30, 39). The results from independent cross-sectional analyses and large randomized intervention trials of both males and females are therefore eagerly awaited to better decide whether a Se deficit constitutes an important and potentially sex-specific risk factor for thyroid diseases and whether male and female patients with thyroid disorders will benefit from Se supplementation to a similar degree (18, 20). Good reasons exist to assume that at least those subjects with a proven Se deficiency will show some positive effects from supplemental Se intake and that this refers not only to the thyroid gland.
Because of the unexpected lack of an association between Se intake and the prevalence of hyperthyroidism in the female populations, we decided to study the interaction in a murine model of GD under well-controlled and more strongly varying Se intake [i.e., from a marginal (0.02 ppm) to an RDA (0.18 ppm) to a high (0.6 ppm), and even a pharmacologically increased Se intake (2 ppm)]. Female mice were chosen as the GD model because the disease is far more prevalent in women than in men, and we wanted to study the more relevant sex. As expected, circulating Se in serum and tissue Se in liver varied strongly in accordance with the diet. The induction of GD was achieved by adenoviral expression of the human thyrotropin receptor A-subunit, as described previously (40, 41). The total body weight gain was similar between the groups, indicating no overt toxicity in relation to the Se supply. The weight gain per calorie decreased in the experimental GD groups in agreement with the manifestation of hyperthyroidism (42). However, this effect was again without an obvious relationship to the Se intake. The TRAb and TT4 concentrations were elevated in the GD groups. Also these manifestations of GD were unrelated to the Se supply, in agreement with a recent report on a missing Se effect on TRAb in a transgenic mouse model developing thyroid autoantibodies (43). These results indicate that the expression of TRAb and degree of GD-related hyperthyroidism might be independent of Se concentrations in female mice, at least when assessed by biomarkers from the serum.
In the thyroid of GD mice, we observed hypertrophy and hypercellularity of follicular epithelia with occasional protrusions into the follicle, similar to former studies using this mouse model (35). In contrast to the parameters in serum, this GD-specific characteristic appeared dependent on Se, and the morphological alterations were strongest in the GD mice with the lowest Se supply (Fig. 3). This result indicates some mitigating effects of high Se supply within the thyroid tissue and could likely become of pathophysiological importance in the chronic stages (i.e., after longer periods of constant TRAb stimulation). In contrast, an insufficiently low Se supply could aggravate thyroid damage in GD, causing a faster and more pronounced enlargement of the gland. This notion would be compatible with the clinical findings of increased gland sizes with low Se status (13, 14), and the improved thyroid ultrasound features found with supplemental Se in AITDs (16, 44). Whether these therapeutic effects of Se can be replicated and studied in molecular detail in a respective mouse model remain to be determined.
In addition to the thyroid gland, we also assessed the Se-dependent effects on the immune system from both serum and spleen. The patterns of immune cells, including the autoimmune-relevant fraction of regulatory T cells, were similar in all groups of mice analyzed, irrespective of the Se supply. This result is in agreement with a recent report from mice spontaneously developing autoantibodies to thyroglobulin and thyroid peroxidase (43). Despite this lack of effects on circulating lymphocytes, the gene expression profiles in the spleen of GD mice receiving a Se-deficient (0.02 ppm) and normal (0.18 ppm) supply were significantly different. The female GD mice receiving a low Se supply showed increased expression of the genes involved in erythrocyte development, differentiation, and homeostasis. This result concurs with the reported anemic and hypoxic effects elicited by Se deficiency in mice and cell cultures (45). In addition, erythropoiesis and the expression of genes involved in the metabolism of xenobiotics, drugs, lipids, and porphyrin was significantly altered, in line with similar results from pigs, in which the Se supply affected these pathways in liver and muscle (46).
Collectively, the data from the mouse model indicated that there are molecular effects of different Se supplies on thyrocytes and splenocytes (i.e., intracellularly), albeit without notable effects on the serum biomarkers of GD, including the thyroid hormones, TRAb concentrations, and pattern of circulating immune cells. This finding might help to better understand why circulating biomarkers do not always respond linearly to the Se supply, despite ongoing health-relevant effects within diseased tissues or reports of improving quality of life with supplemental Se intake. Our results highlight again the importance of sex-specific analyses in relation to the importance of the Se supply and supplemental intake for human health. This applies to both the planning of clinical studies and the interpretation of the results.
The important limitations of our study were the cross-sectional design of the human study, which, moreover, was of a single sample per subject and could not provide causal or longitudinal insights. Moreover, the mouse model relied on an adenoviral infection and thus did not fully replicate the development of hyperthyroidism in humans. Also, we analyzed female mice only, because women have a greater risk of GD, and female mice respond more efficiently to the viral induction of GD. We also learned during our study that Se intake might be of particular importance for GD development in males (47, 48). Finally, our mouse model did not develop GO; thus, our data do not challenge the clinical studies describing the beneficial effects of supplemental Se for patients with mild GO. We studied a constantly different Se status but not the treatment effects, an important limitation that should be addressed in future animal experiments to better understand the potential mechanisms and potency of Se as an adjuvant treatment option in thyroid diseases.
Abbreviations:
- Ad
adenovirus
- AITD
autoimmune thyroid disease
- GD
Graves disease
- GO
Graves orbitopathy
- MDA
malondialdehyde
- RDA
recommended dietary allowance
- Se
selenium
- TBI
TSH-binding inhibition
- Th
T helper
- TRAb
TSHR autoantibody
- TSHR
TSH receptor
- TT4
total T4
- T-AOC
total antioxidant capacity
Acknowledgments
We thank Drs. Basil Rapoport and Chunrong Chen (University of California, Los Angeles, CA) for providing us the plasmid expressing human TSHR289 (psv2-neo-ECE).
Financial Support: The present study was supported by the National Natural Science Foundation of China (grants 81500690 and 81471005), Deutsche Forschungsgemeinschaft (DFG Research Unit 2558 TraceAge, grant Scho 849/6-1), Key Research and Development Program of Shaanxi province (grant 2016MSZD-S-4-1), Natural Science Foundation of Shaanxi Province (grant 2018JM70990), Key Science and Technology Program of Shaanxi Province (grant 2016SF-276), and the Fundamental Research Funds for the Central Universities (grant 1191329875).
Author Contributions: Y.W., L.S., and B.S. designed the project. Y.W., E.R., B.S., and L.S. wrote the manuscript. Y.W., F.Z., and L.W. performed the animal study. F.Z. and P.C. performed the TSHR antibody TBI assay. S.H. and M.Z. performed sample collection. Q.W. performed the population study analysis. Y.L. performed the microarray data analysis. E.R. performed the statistical analysis. All the authors discussed the results and commented on the manuscript.
Disclosure Summary: L.S. holds shares in selenOmed GmbH, a company involved in Se status assessment and supplementation. The remaining authors have nothing to disclose.
