


Abstract
Classical apparent mineralocorticoid excess (AME) is a rare recessive disorder, caused by severe 11β-hydroxysteroid dehydrogenase type 2 enzyme (11β-HSD2) deficiency. AME manifests as low-renin pediatric hypertension, hypokalemia and high cortisol/cortisone (F/E) ratio.
To evaluate nonclassic AME (NC-AME) due to partial 11β-HSD2 insufficiency and its association with hypertension, mineralocorticoid receptor (MR) activation, and inflammatory parameters.
Cross-sectional study.
Primary care cohort.
We recruited 127 adolescents and adults. Subjects with secondary hypertension were excluded. We measured clinical, biochemical, renal, vascular, and inflammatory variables. Sequencing of HSD11B2 gene was performed in all subjects.
NC-AME.
Serum F/E ratio was positively associated with systolic blood pressure (BP), microalbuminuria, and high-sensitivity C-reactive protein (hs-CRP). Serum cortisone correlated with MR activation parameters even when adjusted for age, body mass index, and sex: lower cortisone with higher potassium excretion (partial r = −0.29, P = 0.002) and with lower plasma renin activity (PRA) (partial r = 0.29, P = 0.001). Consistently, we identified 9 in 127 subjects (7.1%) with high F/E ratios (first quartile) and low cortisone (last quartile), suggestive of NC-AME. These subjects had higher systolic BP, 141.4 ± 25.7 mm Hg vs 127.3 ± 18.1 mm Hg, P = 0.03; lower PRA, 0.36 ± 0.19 ng/L*s vs 0.64 ± 0.47 ng/L*s, P < 0.0001; and greater potassium excretion, microalbuminuria, hs-CRP, and plasminogen activator inhibitor. We only found in 2 out of 9 subjects with NC-AME heterozygous mutations in the HSD11B2 gene.
These findings suggest a spectrum of partial 11β-HSD2 insufficiency in a primary care cohort without the classic phenotype and genotype of AME. NC-AME may represent a phenotype of MR activation and cardiovascular risk, suggesting that these subjects could be treated with MR antagonists.
The 11β-hydroxysteroid dehydrogenase type 2 enzyme (11β-HSD2) has a key role in the regulation of sodium homeostasis and blood pressure (BP), acting as a gatekeeper that inactivates cortisol to cortisone to protect the nonselective activation of the mineralocorticoid receptor (MR). When 11β-HSD2 activity is impaired in target tissues such as the kidney and blood vessels, cortisol, which has the same affinity for the MR as aldosterone but circulates in orders of greater magnitude (1000 to 2000 times higher than aldosterone), leads to sodium and water retention, elevated BP, and higher urinary potassium excretion (1, 2).
Congenital severe deficiency of 11β-HSD2 causes the apparent mineralocorticoid excess (AME) syndrome. We and others have described cases of classic AME as an infrequent autosomal recessive disorder characterized by childhood onset of hypertension, hypokalemic alkalosis, and low plasma renin, but unlike primary aldosteronism (PA) it has low aldosterone levels (3) in the presence of high serum or urinary cortisol/cortisone (F/E) ratio (4, 5).
In the past, we have learned that MR activation, either in PA or due to 11β-HSD2 enzyme deficiency, not only increases BP and urinary potassium wasting but also induces cardiac and renal damage, endothelial dysfunction, and subclinical inflammation (4, 6). Moreover, in recent years several studies have shown that MR activation has a clinical spectrum ranging from severe hypertension with hypokalemia (such as classic PA and classic AME) to subclinical MR activation characterized by mild hypertension or even normotension, with normokalemia but higher urinary potassium excretion and lower renin activity (7–10). Thus, because one-third of hypertensive subjects have a low-renin phenotype, we believe that exploring whether serum F/E ratio or cortisone levels predict MR activation is an imperative clinical question (11).
The aforementioned mild MR activation syndromes may be caused by subclinical PA (8) but also by subclinical 11β-HSD2 insufficiency, resulting in a nonclassic apparent mineralocorticoid excess (NC-AME) (12). Recent studies from our group have shown that up to 15% of patients classified as essential hypertensives had a high F/E ratio. However, these patients did not have a classic clinical phenotype of AME, suggesting only partial 11β-HSD2 activity (13). Furthermore, we have described that serum F/E ratio increases with age, but cortisone levels are reduced, suggesting a decrease in 11β-HSD2 activity with aging (14). Of note, NC-AME may be explained by less severe mutations or heterozygosity, allowing some preserved activity of 11β-HSD2, by epigenetic mechanisms, or by exogenous or endogenous inhibitors such as licorice, grapefruit, and glycyrrhetinic acid–like factors (4, 15)
The aim of the current study was to investigate whether a milder phenotype of AME exists, also called NC-AME, in a Chilean primary care cohort, based on determination of serum F/E ratio and cortisone and to determine their association with BP, subclinical MR activation parameters (i.e., renin activity and potassium excretion), endothelial and renal damage biomarkers, and inflammatory parameters.
Subjects and Methods
Subjects
We performed a cross-sectional study in subjects invited from primary care centers in Santiago, Chile. To avoid a selection bias, all subjects with severe hypertension or previously diagnosed secondary causes of hypertension such as PA, classic AME, hypercortisolism, and renovascular disease were not included in this study. All subjects have a similar socioeconomic status and ethnicity, and they declared had not ingested licorice. A total of 127 Chilean adolescents and adults between 11 and 66 years old, of both sexes, were invited to participate. Subjects with prepubertal stage (Tanner stage <2), renal disease, uncontrolled diabetes mellitus, hepatic failure, and cardiac insufficiency were also excluded.
For the known effect on plasma adrenal hormone measurement, subjects using glucocorticoids, oral contraceptives, or spironolactone were also excluded. Patients with probable PA [aldosterone/renin ratio >25 and plasma renin activity (PRA) <1 ng/mL*hr] or potential hypercortisolism [urinary free cortisol greater than reference interval for assay (16)] were also excluded for further analyses. A genetic test for chimeric CYP11B1/CYP11B2 gene was also performed to exclude patients with glucocorticoid-remediable aldosteronism (GRA) in suspected patients. Patients who were using antihypertensive drugs that affect the renin-angiotensin system, such as β-blockers, angiotensin-converting enzyme (ACE) inhibitors, angiotensin II receptor blockers, and diuretics were placed on amlodipine or doxazosin for ≥4 weeks for BP control due to the neutral effect on the renin-angiotensin system (6).
The protocol followed in this study was in accordance with the guidelines of the Declaration of Helsinki and was approved by the Ethical Committee of the Faculty of Medicine, Pontificia Universidad Católica de Chile (CEC-MEDUC#14–268). All of the parents signed informed consent forms, and subjects who were >11 years old provided their consent before entering the study.
Clinical characteristics
All subjects underwent a complete physical examination performed by trained endocrinologists. Subject height was measured with a wall-mounted Harpenden stadiometer (Holtain). Three BP measurements were obtained from the right arm at consecutive 5-minute intervals via an oscillometric method (Dinamap CARESCAPE V100, GE Healthcare, Medical Systems Information Technologies, Milwaukee, WI) in a seated position. This measurement was performed with a cuff and bladder that were size-adjusted to the subject’s upper-arm girth according to published recommendations. Hypertension was considered to be at least two different measurements of BP >130/80 mm Hg in adults (17) and in adolescents (≥13 years old) (18). Hypertension in children (≤13 years old) was defined as average systolic or diastolic BP that is ≥95th percentile for sex, age, and height on at least three occasions. We calculated the BP index so that we could compare children from different sex, age, and stature percentiles. The BP index was determined according to the observed BP/50th percentile BP level for sex, age, and stature with the normal values reported (19). The patients were classified as hypertensive according to the Fourth Report of Task Force (19).
Biochemical assays
After an overnight fast, basal blood samples were obtained before 9:00 am. Serum aldosterone (SA) and PRA were measured by radioimmunoassay with a commercial kit (Coat-ACount Kit; Siemens, Los Angeles, CA and DiaSorin, Stillwater, MN, respectively). SA was expressed in nanograms per deciliter (ng/dL), and for PRA, we used nanograms per milliliter per hour (ng/mL*h). At the same time, 24-hour urine (between 7:00 am and 7:00 am, next day) samples were collected.
Serum and urinary cortisol and cortisone were quantified with liquid chromatography–tandem mass spectrometry, validated according to the parameters suggested by the U.S. Food and Drug Administration and Clinical and Laboratory Standards Institute. Additionally, our group has published previously that serum F/E ratio determined in the early morning close to endogenous ACTH peak (standardized before 09:00 am) has better correlation than urinary F/E for BP outcomes and partial insufficiency of 11β-HSD2 (10–12, 14, 20–22). Based on these data, we identified a group of subjects with a potential NC-AME when they showed both a serum cortisone lower than the first quartile (Q1) [cortisone lower the 25th percentile (P < 25th; E ≤ 2.1 μg/dL)] and F/E ratio greater than Q3 [F/E ratio on the 75th percentile (P > 75th; F/E ≥ 4.43)]. This approach involves a statistical and clinical decision because we have previously described that parents of classic AME cases that are heterozygous for known severe mutations display biochemical abnormalities with high F/E and invariably with low serum cortisone in Q1 (10).
Renal damage was evaluated with 24-hour urine microalbuminuria (MAC) measured by a turbidimetric immunoassay (Albumin; Roche, Germany) and a Hitachi Automatic Analyzer 7600 (Hitachi, Kobe, Japan). Endothelial damage was evaluated by surrogate markers such as plasminogen activator inhibitor (PAI-1), metalloproteinase 9 (MMP9), and MMP2 activities. PAI-1 was determined by ELISA (HYPHEN BioMed, Neuville sur Oise, France) and MMP9/MMP2 activities by zymography as previously described (23).
The inflammatory status was evaluated by measuring high-sensitivity C-reactive protein (hs-CRP) with a nephelometric assay (BN ProSpec Systems; Siemens Healthcare Diagnostics Products, Marburg, Germany), IL-6 by an ELISA with commercial reagents and standards (Bender Med Systems, Vienna, Austria), and TNF-α with ELISA kits (eBioscience, Vienna, Austria) according to the manufacturer’s protocols.
Urine creatinine was measured with a colorimetric assay (Roche, Indianapolis, IN) and a Hitachi Automatic Analyzer 7600 (Roche/Hitachi, Kobe, Japan). The sodium and potassium 24-hour excretion in urine samples were evaluated with methods previously described (24). All serum, plasma, and urine samples were stored at −80°C until analysis.
Genetic analysis
Genomic DNA of all 127 subjects was isolated from peripheral leukocytes with the Lahiri method (25). All subjects were screened for the HSD11B2 mutation by PCR and sequencing in both the promoter and coding region of the gene. PCR amplification of the promoter region and coding region (exons 2 to 5) of HSD11B2 gene was performed in all recruited subjects in the RotorGene 6000 instrument (Corbett Research, Sydney, Australia). The oligonucleotides for PCR were designed with the free online Oligoanalyzer (Supplemental Table 1). The PCR analysis was performed as described previously (26). All samples were sequenced by Sanger methodology in Macrogen (Seoul, Korea) and analyzed with Clustal-W software.
Data analysis
Data are presented as means with the SD of the means for continuous variables and percentages for categorical variables. Normality was assessed via Kolmogorov-Smirnov test. In situations where a variable was not normally distributed (e.g., PRA and aldosterone), a bootstrapping procedure with 1000 iterations was performed. Nonnormally distributed variables are reported as medians and interquartile ranges (Q1 to Q3). Pearson correlation and adjusted linear regression for age, sex, and body mass index (BMI) were used to evaluate the association between F/E, serum cortisol, and serum cortisone, with primary outcomes such as BP, PRA, and urinary potassium excretion. We evaluated the differences between subjects with and without suggestive NC-AME by t test with bootstrapping in nonnormal variables. A two-sided P value of <0.05 was considered statistically significant. Analyses were performed in SPSS 20 and GraphPad Prism version 5.0 software.
Results
Serum F/E ratio, cortisone, and cortisol and their association with BP and MR activation parameters
Baseline characteristics of the 127 study participants are shown in Table 1. We investigated the association of F/E ratio, cortisone, and cortisol, with our primary outcomes such as BP and MR activation parameters characterized mainly by lower renin and higher urinary potassium excretion rate [fractional excretion of potassium (FEK+) 24% and transtubular potassium gradient] (8, 9) in all selected subjects. The serum F/E ratio was positively associated with clinical and biochemical parameters: systolic BP (Fig. 1), diastolic BP, BMI, and FEK+, as observed in Table 2. Of note, no significant correlation was observed for F/E with PRA. We also observed that F/E ratio was positively associated with renal damage and inflammatory parameters such as MAC, hs-CRP, and TNF-α (Table 2). Partial correlation analyses showed that the association between F/E and the main primary outcome (systolic BP) persists after known modulators of BP such as age, BMI, and sex are controlled for (partial r = 0.27, P = 0.005).
Clinical and Biochemical Characteristics of the Participants
| Characteristics | Value | Reference Value |
|---|---|---|
| n | 127 | N/A |
| Age | 32.4 ± 17.1 | N/A |
| Male sex, % | 44.1% (n = 56) | N/A |
| Hypertensives, % | 52.8% | N/A |
| Normotensive | 47.2% | N/A |
| BMI, kg/m2 | 26.60 ± 5.1 | 18.5–24.9 |
| Systolic BP, mm Hg | 128.3 ± 18.9 | <130 |
| Diastolic BP, mm Hg | 81.5 ± 13.7 | <80 |
| Serum cortisol, μg/dL | 10.4 ± 4.1 | 4.2–21.2 |
| (nmol/L) | (286.9 ± 113.1) | (120–580) |
| Serum cortisone, μg/dL | 2.5 ± 0.6 | 1.38–3.33 |
| (nmol/L) | (69.3 ± 16.6) | (40–90) |
| Serum F/E ratio | 4.1 ± 1.4 | 2.58–7.8 |
| SA, ng/dL | 9.3 ± 5.5 | 1.8–23.2 |
| (nmol/L) | (0.25 ± 0.15) | 0.05–0.64 |
| PRA, ng/mL*h | 2.1 ± 1.7 | 1.3–40.0 |
| (ng/L*s) | (0.58 ± 0.47) | (0.36–1.1) |
| Aldosterone/renin ratio | 6.6 ± 5.0 | <25 |
| Serum sodium, mEq/L | 140.2 ± 1.6 | 135–145 |
| Serum potassium, mEq/L | 4.3 ± 0.4 | 3.5–5.0 |
| Urinary sodium, mEq/24 h | 148.3 ± 64.8 | 40–220 |
| Urinary potassium, mEq/24 h | 49.2 ± 20.8 | 25–150 |
| FEK, 24 h | 7.1 ± 2.8 | a |
Reference values are defined as the range between the 2.5 and 97.5 percentiles. Data are presented as mean ± SD for continuous variables and frequencies (%) for categorical variables.
Abbreviation: N/A, not applicable.
Depends on patient’s hydration and electrolyte status.
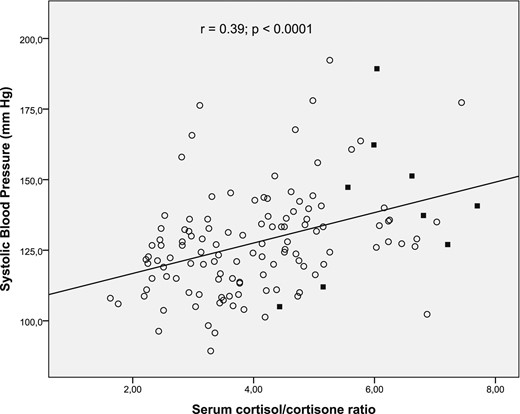
Association between systolic BP (mm Hg) and serum F/E ratio. The Pearson correlation coefficient (r) and P value are shown at the top. Subjects with NC-AME are indicated with black squares.
Pearson Correlation Between Clinical and Biochemical Variables With Serum F/E Ratio, Serum Cortisone, and Serum Cortisol in All of the Subjects Studied
| Serum F/E Ratio | Serum Cortisone | Serum Cortisol | ||||
|---|---|---|---|---|---|---|
| Characteristics | r | P | r | P | r | P |
| Age | 0.12 | 0.16 | −0.30 | 0.0006a | −0.05 | 0.58 |
| BMI, kg/m2 | 0.34 | 0.0001a | −0.24 | 0.007a | 0.16 | 0.08 |
| Systolic BP, mm Hg | 0.39 | 0.0001a | −0.10 | 0.31 | 0.26 | 0.003a |
| Diastolic BP, mm Hg | 0.25 | 0.005a | −0.18 | 0.04a | 0.14 | 0.11 |
| SA, ng/dL | 0.03 | 0.67 | 0.16 | 0.08 | 0.11 | 0.22 |
| PRA, ng/mL*h | −0.03 | 0.71 | 0.41 | 0.0001a | 0.16 | 0.06 |
| Serum potassium, mEq/L | −0.24 | 0.007a | 0.15 | 0.08 | −0.14 | 0.12 |
| MAC, mg/24 h | 0.23 | 0.01a | −0.07 | 0.44 | 0.10 | 0.29 |
| FEK 24 h, % | 0.29 | 0.001a | −0.25 | 0.005a | −0.10 | 0.29 |
| hs-CRP, mg/L | 0.24 | 0.008a | −0.15 | 0.09 | 0.10 | 0.29 |
| PAI-1, µg/L | 0.08 | 0.40 | −0.08 | 0.38 | 0.03 | 0.75 |
| TNF-α, ng/L | 0.26 | 0.004a | −0.18 | 0.05 | 0.08 | 0.38 |
| IL-6, ng/L | −0.19 | 0.07 | 0.01 | 0.88 | −0.14 | 0.17 |
| MMP9 activity, fold change | 0.08 | 0.39 | 0.04 | 0.69 | 0.10 | 0.34 |
| MMP2 activity, fold change | 0.01 | 0.90 | 0.03 | 0.71 | 0.001 | 0.99 |
Correlation was considered significant at the 0.05 level.
Regarding serum cortisone, we observed a negative correlation with diastolic BP, BMI, age, and FEK+ (Table 2). Remarkably, we observed that serum cortisone has a moderate correlation but strong significance with PRA (r = 0.41; P = 0.0001) (Fig. 2); thus, lower cortisone predicted lower PRA levels. The association between cortisone and MR activation parameters persisted after adjustment for known modulators of MR such as age, BMI, and sex: cortisone and urinary potassium excretion (partial r = −0.25, P = 0.002) and cortisone with PRA (partial r = 0.29, P = 0.001). Collectively, these findings indicate that serum cortisone, rather than F/E alone, is the best predictor of MR activation.
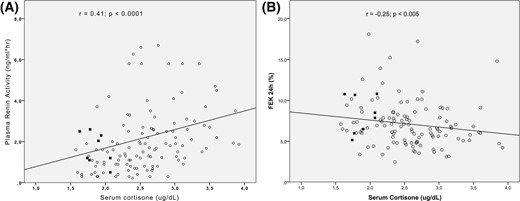
Association between serum cortisone (ug/dL) and (A) plasma renin activity and (B) fractional excretion potassium (FEK+). The Pearson correlation coefficient (r) and P are shown. Subjects with NC-AME are indicated with black squares.
In relation to cortisol, we observed a positive association only between serum cortisol and systolic BP (r = 0.26; P = 0.003) but not with other biochemical parameters.
Evaluation of suggestive NC-AME
Of the 127 studied subjects, we identified 9/127 subjects (7.1%) who fulfilled our criteria with high F/E ratio (>75th percentile) and low cortisone (<25th percentile), predefined as suggestive NC-AME.
Furthermore, we found that subjects with NC-AME compared with subjects without NC-AME had significantly higher systolic BP (141.4 ± 25.7 mm Hg vs 127.3 ± 18.1 mm Hg, P = 0.03), FEK+ (8.6 ± 1.9 vs 6.8 ± 2.8, P = 0.01), and a lower PRA (0.36 ± 0.19 ng/L*s vs 0.64 ± 0.47 ng/L*s, P = 0.01). In the same subject groups, we analyzed renal injury markers, endothelial dysfunction, and inflammation parameters. We observed that subjects with NC-AME had higher MAC (49.2 ± 62.1 mg/day vs 11.0 ± 11.9 mg/day, P < 0.0001), higher PAI-1 (23.1 ± 11.8 µg/L vs 15.6 ± 8.7 µg/L, P = 0.02), higher hs-CRP (6.9 ± 12.0 mg/L vs 1.8 ± 2.2 mg/L, P < 0.0001), and higher TNF-α (1113 + 1470 ng/L vs 354.4 + 759.0 ng/L; P = 0.02). Notably, both groups were comparable in terms of age, sex, sodium intake, and especially known MR activators such as aldosterone and cortisol (both plasma and urine). These results are shown in Table 3.
Clinical and Biochemical Characteristics of Subjects With NC-AME and Without NC-AME
| Characteristics | Subjects With NC-AME | Subjects Without NC-AME | Reference Value | P |
|---|---|---|---|---|
| n | 9 | 118 | N/A | – |
| Age | 32.1 ± 19.9 | 32.4 ± 16.9 | N/A | 0.96 |
| Male sex, % | 33% | 45% | N/A | 0.73 |
| Hypertension, % | 66.7% | 51.7% | N/A | 0.38 |
| BMI, kg/m2 | 29.3 ± 2.4 | 26.2 ± 4.5 | 18.5–24.9 | 0.06 |
| Systolic BP, mm Hg | 141.4 ± 25.7 | 127.3 ± 18.1 | <130 | 0.03a |
| Diastolic BP, mm Hg | 80.1 ± 14.2 | 81.6 ± 13.7 | <80 | 0.85 |
| SA, ng/dLb | 6.5 ± 2.8 | 9.4 ± 5.5 | 1.8–23.2 | 0.17 |
| (nmol/L) | (0.18 ± 0.08) | (0.26 ± 0.15) | (0.05–0.64) | |
| PRA, ng/mL*hb | 1.3 ± 0.7 | 2.3 ± 1.7 | 1.3–4 0.0 | 0.01a |
| (ng/L*s) | (0.36 ± 0.19) | (0.64 ± 0.47) | (0.36–1.1) | |
| Serum sodium, mEq/L | 139.7 ± 1.1 | 140.2 ± 1.6 | 135–145 | 0.33 |
| Serum potassium, mEq/L | 4.1 ± 0.3 | 4.3 ± 0.4 | 3.5–5.0 | 0.12 |
| MAC, mg/day | 49.2 ± 62.1 | 11.0 ± 11.9 | 30–300 | <0.0001a |
| Urinary sodium, mEq/24 h | 176.8 ± 72.5 | 146.4 ± 64.2 | 40–220 | 0.20 |
| Urinary potassium, mEq/24 hb | 55.6 ± 11.1 | 47.1 ± 19.9 | 25–150 | 0.06 |
| FEK, 24 hb | 8.6 ± 1.9 | 6.8 ± 2.8 | c | 0.01a |
| hs-CRP, mg/L | 6.9 ± 12.0 | 1.8 ± 2.2 | <5 | <0.0001a |
| PAI-1, µg/L | 23.1 ± 11.8 | 15.6 ± 8.7 | 11.9–25.5 | 0.02a |
| TNF-α, ng/Lb | 1113 ± 1470 | 354 ± 759 | 16.1–58.0 | 0.02a |
| IL-6, ng/L | 5.6 ± 3.3 | 5.8 ± 4.4 | 2.4–3.1 | 0.90 |
| MMP9 activity, fold change | 1.8 ± 0.8 | 1.9 ± 0.8 | 0.98–2.9 | 0.75 |
| MMP2 activity, fold change | 1.4 ± 0.5 | 1.5 ± 0.4 | 0.9–2.3 | 0.74 |
| Serum cortisol, μg/dL | 11.6 ± 2.1 | 10.3 ± 4.2 | 4.2–21.2 | 0.35 |
| (nmol/L) | (319.9 ± 57.9) | (284.1 ± 115.9) | (120–580) | |
| Serum cortisone, μg/dL | 1.9 ± 0.2 | 2.6 ± 0.6 | 1.38–3.33 | <0.0006a |
| (nmol/L) | (52.4 ± 5.5) | (71.7 ± 16.6) | (40–90) | |
| Serum F/E ratio | 6.2 ± 1.0 | 3.9 ± 1.2 | 2.58–7.8 | <0.0001a |
| Urinary cortisol, μg/g creatinine | 17.7 ± 10.6 | 24.3 ± 30.4 | 6.1–64.1 | 0.62 |
| Urinary cortisone, μg/g creatinine | 34.6 ± 8.2 | 52.4 ± 56.8 | 13.9–88.2 | 0.03a |
| Urinary F/E ratio | 0.5 ± 0.2 | 0.4 ± 0.2 | 0.24–0.73 | 0.32 |
| THF, ng/mL | 25.3 ± 23.8 | 18.4 ± 11.1 | 1.8–26.6 | 0.9 |
| THE, ng/mL | 34.9 ± 23.9 | 30.6 ± 32.1 | 2.85–30.9 | 0.4 |
| THF/THE ratio | 0.68 ± 0.3 | 0.76 ± 0.3 | 0.43–1.23 | 0.5 |
Reference values are defined as the range between the 2.5 and 97.5 percentiles. Values correspond to mean ± SD.
Abbreviations: N/A, not applicable; THE, tetrahydrocortisone; THF, tetrahydrocortisol.
P < 0.05.
Boostrapped.
Depends on patient’s hydration and electrolyte status.
Finally, we found a heterozygous mutation in the HSD11B2 gene [c.637C>T (p.Arg213Cys)] (10, 27, 28), in two subjects with NC-AME. It should be noted that we did not find significant differences in the biochemical variables analyzed between the NC-AME subjects with mutation or without mutation. In other 3 of 9 subjects with NC-AME and in 21 of 118 of the control group we detected two single nucleotide polymorphisms in HSD11B2 gene [rs5479 (c.468C>A; p.Thr156Thr) and rs45483293 (c.534G>A; p.Glu178Glu)].
Discussion
In this study, we support the existence of a milder form of AME, suggesting that a clinical and biochemical spectrum of 11β-HSD2 deficiency may be prevalent in a primary care cohort. The differential diagnosis and spectrum of AME, severe and milder, are showed in Supplemental Table 2. This phenotype of NC-AME, characterized by an increased F/E ratio and low serum cortisone, was associated with higher BP and MR activation (detected by lower renin and higher urinary potassium excretion rate). Furthermore, this phenotype of NC-AME is characterized by increased biomarkers of renal and endothelial damage such as microalbuminuria and PAI-1 and higher inflammatory parameters such as TNF-α and C-reactive protein without severe homozygous mutations in HSD11B2 gene, as occurs in classic AME. These findings have notable implications because up to one-third of hypertensive patients have a low-renin phenotype (29, 30). Some of these low-renin hypertensive patients may have mild primary aldosteronism but were carefully excluded in this study. Consequently, our findings suggest that another subset of subjects may have insufficient 11β-HSD2 activity, resulting in a cortisol and MR-mediated arterial hypertension. Collectively, our findings indicate that MR-mediated hypertension and cardiovascular disease may be more prevalent than currently recognized and that the biochemical recognition of these milder phenotypes should be addressed by targeted treatment. Williams et al. (31) in the PATHWAY-2 trial observed that the MR antagonist spironolactone reduced BP substantially more than conventional antihypertensive drugs in patients with resistant hypertension, suggesting that a subgroup of subjects with undiagnosed PA and NC-AME are natural candidates for this type of treatment (12).
Recently, we and others have described that MR activation in PA has a phenotypical spectrum and that milder cases, even in normotension with normokalemia, are as common and warrant high clinical suspicion (8, 9, 32). The fact that up to one-third of hypertensive patients displays low-renin hypertension suggestive of a systemic volume expansion, which responds to a natriuretic effect, suggests that etiologies other than PA can be detected or at least suspected. In this setting, the results of our study showing that low serum cortisone predicts low renin is clinically relevant (Fig. 2) (33, 34). Supporting these findings, Adlin et al. (35) described in a Framingham-based sample that subjects with low-renin hypertension had a bimodal aldosterone distribution, suggesting two different pathophysiological phenotypes, one aldosterone dependent (such as PA) and, interestingly, one non–aldosterone dependent, where NC-AME and other etiologies with MR activation by different ligands, such as cortisol or deoxycorticosterone, would be included.
When exploring the correlation of F/E ratio and serum cortisone on BP and MR activation, we realized that the diagnosis of NC-AME should use the combination of both high F/E ratio and low serum cortisone. Remarkably, cortisone was the best predictor of MR activation, assessed by renin activity and potassium excretion (Table 2), and this correlation was observed even when adjusted by known modulators of renin, especially age. In our previous studies, we considered only serum F/E ratio without considering low serum cortisone values as a proxy for partial 11β-HSD2 insufficiency, which could have given false positives by elevation of cortisol with normal cortisone (as described in female patients using estrogen), which is not enough to detect MR activation, which is a cornerstone of AME diagnosis (14). This new definition for NC-AME, more accurate but less sensitive, may explain the lower frequency compared with our previous publications.
Earlier, our group showed that cortisol and the F/E ratio increased with age in normotensive subjects, suggesting a decrease in 11β-HSD2 activity (14). In contrast, in this study we did not observe a correlation between F/E ratio and age. However, these differences may be present mainly because the technologies used in both works are different (radioimmunoassay and not liquid chromatography–tandem mass spectrometry). Also, the previous study was carried out only in normotensive subjects, and when performing the association analysis considering only normotensive subjects of this study we again observed a positive association between age and the F/E ratio (data not shown). Interestingly, in this study we observed that serum cortisone has a negative association with age, which highlights the importance of using both F/E ratio and cortisone to identify subjects with NC-AME, even normotensive subjects, which could evolve arterial hypertension associated with 11β-HSD2 deficiency in adulthood, supporting the late onset of arterial hypertension in those subjects.
Notably our results also showed higher inflammatory parameters associated with a higher F/E ratio, as a continuous variable, and consistently higher TNF-α and hs-CRP in subjects with NC-AME. Although the role of aldosterone in inflammation has been widely described (36, 37), the finding that MR activation can directly increase hs-CRP is even more interesting when we observe that spironolactone can abolish MR-induced hs-CRP expression (38). This finding is consistent with an inflammatory profile that is mediated by MR activation but not necessarily by aldosterone. Deuchar et al. (39) found that loss of function of 11β-HSD2 leads to striking atherogenesis and vascular damage associated with a proinflammatory process in Apoe−/−/11β-HSD2−/− double-knockout (E/b2) mice, with an important protective effect when eplerenone is used.
Interestingly, the recent kidney-specific Hsd11b2 knockout mice display high-volume, low-renin hypertension and renal dysfunction, and this phenotype was reversed by spironolactone (40). Also, in an animal model of MR activation such as Dahl salt-sensitive rats, a specific MR antagonist such as eplerenone decreases proteinuria and PAI-1 (41). From a clinical perspective, a new MR antagonist, finerenone, has recently been shown in a randomized trial of subjects with diabetic nephropathy to decrease albuminuria, supporting our findings (42).
In relation to our genetic analyses, to date few studies have performed sequencing analysis of the promoter and coding region of the HSD11B2 gene in subjects not displaying the typical phenotype of classic AME. Our study identified nine subjects with suggestive NC-AME, of whom two have a previously described heterozygous pathogenic variant R213C (p.Arg213Cys), which impairs the activity and stability of 11β-HSD2 (10, 27, 28). The R213C mutation in its recessive form is considered severe because it disrupts critical hydrogen bonds in the central β-sheet of the structure, which changes the protein folding and the catalytic activity of 11β-HSD2 (43, 44). Single nucleotide polymorphisms rs5479 (c.468C>A; p.Thr156Thr) and rs45483293 (c.534G>A; p.Glu178Glu), though related to hypertension (45), are synonymous variants of uncertain significance.
In this way, heterozygous genetic variations in the HSD11B2 gene are not a sine qua non condition for having NC-AME. Collectively, NC-AME differs from classic AME syndrome because it has a milder phenotype, occurring even in normotensive subjects, is not associated with severe homozygous gene mutations, and may require a second hit or other environmental factors to impair cortisol metabolism.
Our study has strengths due to the complete biochemical and genetic analysis performed in all subjects. In addition, determinations of cortisol and cortisone were carried out with HPLC/MSMS technology, which constitutes the gold standard for this type of measurement (3, 12, 13). Nevertheless, this cross-sectional study has some limitations, because there is no gold standard for defining NC-AME, we proposed arbitrary cutoff points to infer activity of the 11β-HSD2 through the combination of variables of F/E ratio and serum cortisone levels, which is defined from both a statistical and a clinical perspective (10). Another limitation is that current study design did not include a longitudinal follow-up to assess whether patients with NC-AME had a higher incidence of cardiovascular and renal outcomes. On the other hand, treatment with an MR antagonist was not routinely performed in this diagnostic study, which it would be interesting to include in a future study. Moreover, future intervention studies should use controlled modulators of renin such as a sodium diet to improve assessment of the effect of F/E ratio in MR activation.
In summary, we observed a correlation between surrogate markers for impaired 11β-HSD2 activity (F/E ratio and low cortisone levels) and higher BP, lower renin activity, and greater urinary potassium excretion. Collectively our findings suggest that there is a spectrum of nonclassic or subclinical 11β-HSD2 insufficiency that results in an MR activation that is associated with adverse vascular and inflammatory profiles. Our results suggest that NC-AME may represent an important modifiable phenotype of low-renin hypertension, which could be treated with MR antagonists.
Abbreviations:
- 11β-HSD2
11β-hydroxysteroid dehydrogenase type 2 enzyme
- ACE
angiotensin-converting enzyme
- AME
apparent mineralocorticoid excess
- BMI
body mass index
- BP
blood pressure
- F/E
cortisol/cortisone ratio
- GRA
glucocorticoid-remediable aldosteronism
- hs-CRP
high-sensitivity C-reactive protein
- FEK+
fractional excretion of potassium
- MAC
microalbuminuria
- MMP
metalloproteinase
- MR
mineralocorticoid receptor
- NC-AME
nonclassic apparent mineralocorticoid excess
- PA
primary aldosteronism
- PAI-1
plasminogen activator inhibitor
- PRA
plasma renin activity
- Q
quartile
- SA
serum aldosterone
Acknowledgments
Financial Support: This work was supported by Fondo Nacional de Desarrollo Científico y Tecnológico grants 1150437 (to C.A.C.), 1160695 (to C.E.F.), and 1160836 (to A.M.-A.); Fondo de Equipamiento Científico y Tecnológico grant EQM150023 (to C.A.C.), Millennium Institute of Immunology and Immunotherapy grant P09/16-F; and CETREN-UC (to C.E.F.).
Disclosure Summary: The authors have nothing to disclose.
References
Author notes
A.T.-C. and R.B. contributed equally to this work.
