


Abstract
To assesses microvascular complications in renal transplant recipients with posttransplant diabetes mellitus (PTDM).
In this observational study, patients with ≥5 years of PTDM were included from a cohort of 895 kidney recipients transplanted from 2000 through 2011. Diabetic retinopathy was evaluated by fundus photographs and optical coherence tomography (OCT). Diabetes kidney disease was evaluated by protein to creatinine ratio (PCR) and estimated glomerular filtration rate (eGFR). Distal polyneuropathy was assessed by Michigan Protocol and 10 g-monofilament feet examinations. The Ewing protocol identified cardiovascular autonomic neuropathy. Renal transplant recipients without PTDM diagnosis (NPTDM) were considered controls.
After 144.5 months of follow-up, 135 (15%) patients developed PTDM, and 64 had a PTDM duration ≥5 years. None of the patients with PTDM presented diabetic retinopathy at fundus photographs, but thinning of inner retinal layers was observed with OCT. More than 60% of patients with PTDM had distal polyneuropathy (OR, 1.55; 95% CI, 1.26 to 1.91; P < 0.001). Cardiovascular reflex tests abnormalities were similar between patients with PTDM and NPTDM (P = 0.26). During the first year and 8.5 ± 3.0 years after renal transplantation, eGFR and PCR did not differ significantly between patients with PTDM or NPTDM.
This longitudinal study assesses microvascular complications in renal transplant patients with PTDM. A lower than expected prevalence as well as a different clinical course of the complications was observed. PTDM seems to be a unique type of diabetes, and its consequences may be milder than expected in type 1 and type 2 diabetes.
Hyperglycemia is a well-documented event occurring after organ transplantation and may be transient or persistent. Since 2014 (1), posttransplant diabetes mellitus (PTDM) is the recommended denomination for persistent posttransplant hyperglycemia. As grafts and recipients survival rates have increased in recent decades because of a better understanding and management of posttransplant immunological and infection complications, the incidence of PTDM has also increased (2), leading to the need for a better understating of disease clinical course in the long term. The PTDM prevalence increases in proportion to the number of transplantations performed, varying from 10% to 74% in a series of kidney transplants (3). Some of the risk factors for PTDM are the same as for type 2 DM, such as obesity and older age, but others are specific of the posttransplant period such as calcineurin inhibitors and corticosteroids use (4, 5).
Although there is a good knowledge of PTDM pathogenesis (6), there is still uncertainness about proper long-term management of this disease (7). Retinopathy, diabetic kidney disease (DKD), and neuropathy are microvascular complications frequently seen in type 1 and 2 DM. Diabetic retinopathy is the leading cause of blindness among working aged adults around the world (8, 9). DKD is responsible for most cases of end-stage renal disease worldwide (9). Diabetic neuropathy encompasses a broad spectrum of manifestations, with autonomic neuropathy and distal symmetrical peripheral polyneuropathy being the most common. Both are related to debilitating complications such as foot ulcers, lower extremity amputations, and chronic pain (10, 11). For these reasons, screening for microvascular complications is recommended at the time of type 2 DM diagnosis and, for type 1 DM, after 5 years of diagnosis and annually thereafter (9). However, few data are available regarding these complications in patients with PTDM (12). It remains unclear if the progression of chronic diabetic complications in transplant recipients is similar to that of patients with other types of diabetes (13); therefore, the aim of the current study was to evaluate the clinical course of diabetic microvascular complications in kidney transplant recipients with >5 years of PTDM diagnosis.
Research Design and Methods
Study design and population selection
A retrospective cohort study was conducted with kidney transplant recipients from a tertiary hospital in south of Brazil. All patients transplanted from January 1, 2000, to December 28, 2011, had their charts reviewed. Patients with the following criteria were included in the study: age >18 years, no history of DM before transplant, and with at least 5 years of PTDM. PTDM was diagnosed according to American Diabetes Association criteria as suggested by Sharif (14). Glucose samples available in the first 45 days after transplant were not considered. Episodes of transient hyperglycemia related to the high doses of corticosteroid and/or tacrolimus early after transplantation were not considered as having PTDM as well. Patients starting insulin and/or antihyperglycemic medication while in the kidney transplant hospital stay and who have maintained it after discharge were also considered to have PTDM. Subjects receiving a kidney transplant in the same period as the cases, but with no PTDM diagnosis (NPTDM), were consecutively selected as a control group from a list of patients in regular follow-up at the nephrology unit. Exclusion criteria were kidney graft loss, death, or loss of follow-up.
The ethical committee from the research board of Hospital de Clínicas de Porto Alegre approved this study. All participants provided written, informed consent and this study complies with the Declaration of Helsinki and the principles of Good Clinical Practice.
Clinical and laboratory evaluation
Demographic, anthropometric, and graft-related data were obtained by patient interviews as well as by reviewing transplant charts and electronic medical records. Pretransplant and posttransplant information were recorded. A blood sample was collected to measure fasting plasma glucose (glucose-peroxidase colorimetric enzymatic method, Biodiagnóstica), glycated hemoglobin A1c [GHb; HPLC system; normal range 4% to 6% (20 to 42 mmol/mol); Merck-Hitachi 9100], total cholesterol, high-density lipoprotein cholesterol, and triglycerides (colorimetric method). Serum creatinine (Jaffé method, traceable), spot urinary creatinine (Jaffé colorimetric method), and protein (turbidimetric method) were periodically measured as part of the routine kidney transplant clinical care. In addition, all GHb results available in laboratory registry were recorded. Around 20 GHb measurements per patient were obtained.
Diabetic microvascular complications assessment
Diabetic retinopathy
All patients with at least one eye without refractive media opacities were included for fundus photographs. Pupils were dilated and color fundus photographs were captured digitally in both eyes. Images were graded by a trained endocrinologist and an ophthalmologist according to the International Clinical Diabetic Retinopathy and Diabetic Macular Edema Disease Severity Scales, published in 2003, based on the Early Treatment Diabetic Retinopathy Study (14). Swept-source optical coherence tomography (SS-OCT) was also performed. SS-OCT is an imaging modality that enables the documentation of tissue structure in real time and in situ. The equipment’s software automatically provides simultaneous measures of peripapillary retinal nerve fiber layer (RNFL), macular full-thickness, and inner macular layer thickness (ganglion cell layer and inner plexiform layer) (15), as shown in Fig. 1. All patients submitted to the fundus photograph were evaluated through SS-OCT (Triton SS-OCT, Topcon, Tokyo, Japan) by an experienced ophthalmologist. The inner macular parameters included were RNFL thickness, ganglion cell layer (GCL) plus inner plexiform layer thickness (GCL+), and RFNL plus GCL+ thickness (GCL++). These measurements were compared between groups with and without PTDM.
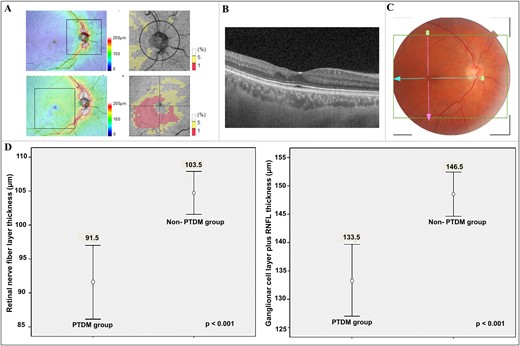
SS-OCT examination and observed difference between thickness of inner retinal layers in kidney transplant recipients with and without PTDM of >5 years. (A) SS-OCT thickness maps of RNFL and GCL++ according to Early Treatment Diabetic Retinopathy Study. (B) Retinal layers by high-resolution SS-OCT shows inner retina thinning. (C) Color fundus photograph shows no clinical sign of diabetic retinopathy. (D) Thinning of RNFL and GCL++ in patients with PTDM, respectively.
DKD
Presence of DKD was evaluated by means of serum creatinine and by protein to creatinine ratio (PCR). Estimated glomerular filtration rate (eGFR) was assessed by Chronic Kidney Disease Epidemiology Collaboration equation (16). DKD was evaluated at two different periods: (i) in the first year of transplantation, by serum creatinine and PCR recorded at months 3, 6, and 12 after transplantation; and (ii) after at least 5 years of PTDM diagnosis (current), in the same year of the other microvascular complication evaluations, through a mean of three serum creatinine and PCR dosages, with interval of at least 3 months between them. Because it was not feasible to perform kidney biopsy to diagnose DKD, we compared the eGFR and the PCR variation (Δ) between the two evaluated periods as well as the mean values between patients with and without PTDM as indicators of renal damage, according to previous studies (17).
Distal symmetric polyneuropathy
Distal symmetric polyneuropathy was assessed through Michigan Neuropathy Screening Instrument (MSNI) and 10-g Semmes-Weinstein monofilament examination (SWME) (18, 19). This test consists of 15 questions on foot sensation, with 2 questions to record possible vascular symptoms and a brief clinical examination of both feet to check for deformities and ulceration, grading of ankle reflexes, and determining the vibratory perception threshold at the lateral malleolus with a 128-Hz tuning fork. The maximum score for the questionnaire is 15 points and 8 for clinical examination. The cutoff points suggested for positive screening are 7 and 2 points, respectively. The higher the scores, the greater the neuropathy. SWME tests feet sensitivity in 10 locations with the patient's eyes closed. Insensitivity is defined as <8 correct responses; it is an independent predictor of amputation and ulceration in patients with diabetes (19).
Cardiovascular autonomic neuropathy
We performed the Ewing protocol for cardiovascular reflex tests (deep breath, Valsalva, and orthostatic) as recommended by the American Diabetes Association and the American Academy of Neurology, based on its good reproducibility (9, 20). We also performed the orthostatic hypotension test (20, 21). Although the interference of some medications on cardiovascular reflex test results might occur, we considered a wash-out of continuous-use medication not feasible in the context of posttransplant patients. This same strategy was used in the Hoorn Study, which assessed cardiovascular autonomic neuropathy (CAN) in patients with diabetes and cardiovascular disease (22). Antihypertensive drugs and another potential cofounding factors were recorded. CAN testing was performed with Poly-Spectrum-8/E software (Neurosoft Inc., Ivanovo, Russia). Established CAN diagnosis requires at least two of the four Ewing tests to be altered (20, 21).
Statistical Analysis
Patient’s baseline characteristics are described using means (± SDs) or median (interquartile interval) for continuous variables and as absolute number (proportions) for categorical data. Shapiro-Wilk test assessed normality. For normally distributed continuous variables, comparisons between groups were done with Student 2-tailed t test. For variables that did not follow Gaussian distribution, a Mann-Whitney U test was used. The categorical variables were compared with the χ2 test. Odds ratio and their 95% CIs were calculated. Variables investigated as risk factors for PTDM or microvascular complications development were examined with univariate and bivariate analyses. Variables that reached statistical significance (P < 0.25) in bivariate analysis were included in a multivariable modeling technique. Differences in retinal layers thickness between patients with PTDM and NPTDM were compared by generalized estimating equations to adjust for the inclusion of both eyes of each patient. Generalized estimating equations were also used to examine the influence of sex and age on SS-OCT measurements. Associations were considered significant if the P value was <0.05. Statistical calculations were done with PASW 20.0 Software (SPSS Inc., Chicago, IL).
We considered that the minimum clinically relevant difference in eGFR between patients with NPTM and PTDM would be 15 mL/min. Using an eGFR standard deviation of 20 mL/min (23), we reached a sample size of at least 28 patients in each group. Based on the expected diabetic retinopathy prevalence of 6% in patients with type 1 DM after 4 years of diagnosis (Wisconsin Diabetes Registry Study) (24) and considering the 64 patients with PTDM >5 years in our cohort, we calculated a sample size (with correction for small populations) of 37 patients, plus 10% for losses and refusals, to detect diabetic retinopathy. We also estimated the sample size needed to evaluate diabetic neuropathy according to a study that evaluated the prevalence of peripheral neuropathy in patients with chronic kidney disease with or without diabetes (25). A sample size of 92 patients was calculated to detect an OR of 3.3 between patients with PTDM and NPTDM. We chose to use the largest sample size. Calculations were made through OpenEpi software (version 3.01, Emory University, Rollins School of Public Health, Altanta, GA), at 80% power and 95% CI.
Results
Cohort characteristics
From January 2000 to December 2011, 895 patients received a kidney transplant at our institution. Most of recipients were male (n = 512, 57%) and white (n = 644, 72%). The majority of patients received organs from deceased donors (n = 655, 73%); recipients’ mean age was 43.7 ± 12.8 years. During the 578 weeks of follow-up (144.5 months), 135 (15%) patients developed PTDM. Of those, 64 had PTDM for >5 years and were eligible for study entry. Forty patients with PTDM (62.5%) and 51 patients without PTDM agreed to participate in the study. The study flowchart is presented in Fig. 2.
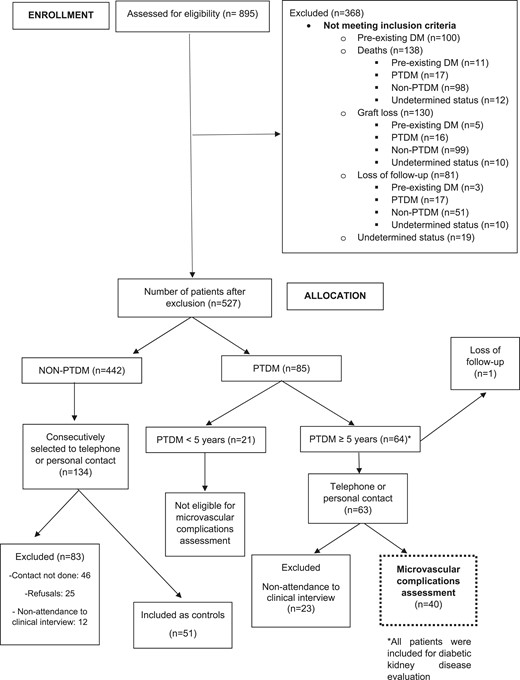
Study flowchart.
Participant characteristics
The characteristics of patients with and without PTDM are described in Table 1. Patients in the PTDM group were age 49.6 ± 10.5 years upon DM diagnosis, which occurred 68 days (median) after transplantation. In 75% (n = 31) of patients with PTDM, DM development occurred before 110 days of kidney transplantation. At the time of DM detection, the main immunosuppressive regimen was prednisone (93.3%), tacrolimus (68.4%) or cyclosporine (20.5%), and mycophenolate mofetil (64.3%). The mean serum value of tacrolimus was 10.8 ± 6.1 ng/dL; the mean daily prednisone dosage was 14.4 ± 5.5 mg. At the end of follow-up, mean diabetes duration was 7.93 ± 2.9 years. Forty-five percent of patients with PTDM reported insulin use (≥1 doses/d) and 17.5% used ≥2 antihyperglycemic medications. To ensure representativeness of our sample, we compared the characteristics of the included patients with PTDM (n = 40) with those that did not agree to participate (n = 24). Diabetes duration (7.93 vs 8.29 years, P = 0.47) and GHb [median 7.0% (53 mmol/mol) in both groups, P = 0.63] were similar. Other main variables were equally distributed among these groups and are presented in Table 2.
Demographic and Clinical Characteristics of the Cohort Stratified Between Patients With NPTDM and PTDM
| PTDM (n = 40) | NPTDM (n = 51) | P | |
|---|---|---|---|
| Female, n (%) | 24 (60) | 15 (29.4) | 0.017 |
| Age, y, mean (± SD) | |||
| At transplantation | 49 (10.9) | 40 (11.8) | 0.001 |
| Current | 58 (10.6) | 50 (11.1) | 0.002 |
| Transplantation time, y, mean (± SD) | 8.5 (3.05) | 8.94 (3.44) | 0.525 |
| Weight, kg, mean (± SD) | |||
| At transplantation | 75.2 (13.4) | 66.3 (14.2) | 0.005 |
| Current | 75.09 (13.7) | 74.54 (10.8) | 0.834 |
| BMI, kg/m2 (± SD) | |||
| At transplantation | 28.1 (4.3) | 24.2 (4.9) | 0.001 |
| Current | 28.38 (4.81) | 27.08 (4.06) | 0.222 |
| Caucasian, n (%) | 32 (80) | 40 (78.4) | 1.00 |
| Polycystic kidney disease, n (%) | 11 (27.5) | 4 (7.8) | 0.026 |
| Hypertension | 19 (47.5) | 19 (37.2) | 0.442 |
| Preoperative history, n (%) | |||
| Current smoking, n (%) | 4 (10) | 6 (11.7) | 1.00 |
| Parental DM, n (%) | 16 (40) | 22 (43.2) | 0.931 |
| Pretransplant dialysis, n (%) | 39 (97.5) | 48 (94.2) | 0.628 |
| Dialysis time, mo, median (IQR) | 35 (53) | 23 (47) | 0.162 |
| Positive HCV status, n (%) | 4 (10) | 6 (12) | 1.00 |
| Deceased donor, n (%) | 31 (77) | 35 (66.5) | 0.367 |
| Donor age, y, mean (± SD) | 37.11 (13.84) | 41.33 (13.54) | 0.173 |
| Donor sex, male, n (%) | 18 (45) | 23 (51.1) | 0.730 |
| Cold ischemic time, min, median (IQR) | 1095 (1399) | 840 (1260) | 0.138 |
| Delayed graft function, n (%)a | 24 (29) | 14 (20.7) | 0.122 |
| Acute rejection, n (%)b | 8 (9.6) | 12 (14.5) | 0.559 |
| Current use of antihypertensive drug, n (%) | 33 (82.5) | 39 (76.5) | 0.658 |
| Number of antihypertensive, median (IQR) | 2 (2) | 1 (2) | 0.148 |
| ACEI use, n (%) | 11 (27.5) | 15 (29.4) | 1.000 |
| ARB use, n (%) | 5 (12.5) | 3 (5.9) | 0.463 |
| Blood pressure, mm Hg | |||
| Systolic | 134.4 (15.2) | 138.6 (18.8) | 0.389 |
| Diastolic | 85.7 (17.5) | 82.2 (10.3) | 0.397 |
| Current immunosuppressants, n (%) | |||
| Tacrolimus | 26 (65) | 29 (56.8) | 0.567 |
| Cyclosporine | 8 (20) | 16 (31.3) | 0.326 |
| Prednisone | 39 (97.5) | 51 (100) | 0.440 |
| Mycophenolate mofetil | 27 (67.5) | 44 (86.3) | 0.059 |
| Azathioprine | 2 (5) | 2 (3.9) | 1.00 |
| Sirolimus | 4 (10) | 5 (9.8) | 1.00 |
| Tacrolimus, serum level, mg/dL mean (± SD) | |||
| Day 10 after transplant | 10.9 (3.5) | 11.5 (4.5) | 0.630 |
| Day 30 after transplant | 11.8 (4.6) | 10.6 (3.6) | 0.284 |
| Higher (first 90 d) | 20.4 (5.4) | 22.2 (5.8) | 0.269 |
| Current | 6.09 (2.6) | ||
| Fasting plasma glucose, mg/dL, median (IQR) | |||
| At transplantation | 91.5 (27) | 89 (11) | 0.123 |
| Current | 118 (41) | 92 (20) | <0.001 |
| GHb (%) | |||
| Current, median (IQR) | 7.0 (1.7) | 5.60 (0.6) | <0.001 |
| All available, mean (± SD) | 7.4 (1.3) | 5.47 (0.6) | <0.001 |
| Total cholesterol, mg/dL, mean (± SD) | |||
| At transplantation | 202.1 (50.8) | 181.6 (38.1) | 0.085 |
| Current | 193.4 (43.4) | 192.2 (49.1) | 0.905 |
| Triglycerides, mg/dL, median (IQR) | |||
| At transplantation | 177 (101) | 151 (128) | 0.089 |
| Current | 166 (136) | 140.5 (68) | 0.114 |
Significant P values appear in in bold-face type.
Abbreviations: ACE, angiotensin-converting enzyme inhibitor; BMI, body mass index; HCV, hepatitis C virus.
n = 82.
n = 83.
Main Characteristics of Included and Excluded Patients With Posttransplant Diabetes Mellitus >5 Years
| Participant (n = 40) | Nonparticipant (n = 24) | P | |
|---|---|---|---|
| Female, n (%) | 24 (60) | 10 (47.6) | 0.513 |
| Age, y, mean (± SD) | |||
| At transplantation | 49 (10.9) | 43 (10.9) | 0.044 |
| Current | 58 (10.6) | 53 (11.8) | 0.101 |
| Transplantation time, y, mean (± SD) | 8.5 (3.05) | 9.3 (3.02) | 0.341 |
| Weight, kg, mean (± SD) | 75.1 (13.7) | 72.5 (17.9) | 0.575 |
| Caucasian, n (%) | 32 (80) | 16 (76) | 0.453 |
| Diabetes duration, y, mean (± SD) | 7.93 (2.9) | 8.29 (2.9) | 0.474 |
| Deceased donor, n (%) | 31 (77) | 14 (66.7) | 0.543 |
| Tacrolimus serum, mean (± SD) | 6.42 (2.4) | 5.63 (1.6) | 0.261 |
| Fasting plasma glucose, mg/dL, mean (± SD) | 118 (41) | 117 (43) | 0.412 |
| GHb (%), median (IQR) | 7.00 (1.72) | 7.0 (2) | 0.632 |
| Insulin use, n (%) | 22 (55) | 12 (75)a | 0.28 |
| Oral hypoglycemic agents use, n (%) | 20 (50) | 9 (53)b | 1.00 |
Significant P values appear in in bold-face type.
n = 16.
n = 17.
Fifty-one patients with NPTDM, transplanted in the same period as the patients with PTDM (8.9 ± 3.4 vs 8.5 ± 3.0 years of transplantation, P = 0.52), were consecutively included as controls. Compared with the NPTDM group, patients with PTDM are older, more likely to be female, and had polycystic chronic disease as the main cause of kidney failure (Table 1). Patients with PTDM had a higher body mass index and weight at transplantation, but these differences were attenuated during follow-up. Groups did not differ significantly regarding ethnicity, family history of type 2 DM, and parameters related to the donor and the transplant processes. We also assessed sex and age distribution among all patients with PTDM (n = 135) and NPTDM (n = 442) from the original cohort of patients. Older age at the time of transplantation persisted as a characteristic of patients with PTDM (48 ± 11.5 vs 42 ± 12.8 years, P < 0.001). The frequency of women among the patients with PTDM was numerically higher than in patients with NPTDM (53% vs 44%, P = 0.09), but the difference did not reach statistical significance. This finding was different from the sex distribution in the study cohort and was considered in the subsequent statistical analysis
Diabetic microvascular complications assessment
Diabetic retinopathy
There were 176 eyes from 88 transplanted patients (40 patients with PTDM and 48 patients with NPTDM) included for fundus photographs. In three patients, retinopathy evaluation was not performed because of corneal opacity (n = 2) and refusals (n = 1). Although patients with PTDM had an average diabetes duration of ∼8 years, none presented findings of diabetic retinopathy at fundus photograph, according to the International Clinical Diabetic Retinopathy and Diabetic Macular Edema Disease Severity Scales. Eighty-five patients (36 with PTDM and 46 with NPTDM; 5 refusals) were evaluated through SS-OCT. Compared with the NPTDM group, patients with PTDM had thinning of all segments in full macular thickness, RNFL, and GCL++ (Fig. 1). After adjustment for age and sex, PTDM diagnosis remained as an independent predictor of thinning in RNFL and GCL++, as depicted in Table 3. Furthermore, an inverse relationship was observed between GHb and thickness of retinal layers (Table 4).
Variables Predicting Thickness of Inner Retinal Layers by Generalized Estimating Equations
| β | CI | P | |
|---|---|---|---|
| Macular full thickness | |||
| PTDM | −8.97 | −18.5 to 0.57 | 0.06 |
| Age | −0.04 | −0.41 to 0.32 | 0.81 |
| Male | 17.1 | 6.70 to 27.5 | 0.001 |
| RNFL | |||
| PTDM | −11.9 | −19.4 to -4.43 | 0.002 |
| Age | −0.02 | −0.29 to 0.25 | 0.88 |
| Male | 6.01 | −1.30 to 13.3 | 0.11 |
| GCL+ | |||
| PTDM | −0.44 | −4.43 to 3.55 | 0.83 |
| Age | 0.02 | −0.12 to 0.18 | 0.85 |
| Male | 7.62 | 3.35 to 11.9 | <0.001 |
| GCL++ | |||
| PTDM | −13.1 | −22.2 to -3.96 | 0.005 |
| Age | 0.34 | −0.27 to 0.34 | 0.83 |
| Male | 8.99 | 0.01 to 17.9 | 0.05 |
Significant P values appear in in bold-face type.
Relationship Between Glycated Hemoglobin and Retinal Layer Thickness
| Layer | β | CI | P |
|---|---|---|---|
| Full retina | −5.03 | −8.82 to -1.25 | 0.009 |
| RNFL | −5.20 | −8.01 to -2.39 | <0.001 |
| GCL++ | −6.18 | −9.58 to -2.78 | <0.001 |
| GCL+ | −2.52 | −4.05 to -0.98 | 0.001 |
| Layer | β | CI | P |
|---|---|---|---|
| Full retina | −5.03 | −8.82 to -1.25 | 0.009 |
| RNFL | −5.20 | −8.01 to -2.39 | <0.001 |
| GCL++ | −6.18 | −9.58 to -2.78 | <0.001 |
| GCL+ | −2.52 | −4.05 to -0.98 | 0.001 |
Significant P values appear in in bold-face type.
Distal symmetric polyneuropathy
The MSNI questionnaire median scores and results of the MSNI clinical examination were significantly different between patients with PTDM and NPTM (Table 5). Besides PTDM (OR, 1.55; CI, 1.26 to 1.91; P < 0.001), positive screening on MSNI was also associated with age (OR, 1.02; CI, 1.01 to 1.03; P < 0.001); GHb (OR, 1.12; CI, 1.03 to 1.22; P = 0.008), and dialysis duration (OR, 1.005; CI, 1.001 to 1.008; P = 0.005). No association was observed with sex, cholesterol and triglyceride values, smoking habit, eGFR, or tacrolimus serum levels in univariate logistic regression. In multivariate analysis, PTDM (OR, 6.11; CI, 1.68 to 22.3; P = 0.006), age (OR, 1.09; CI, 1.02 to 1.17; P = 0.01), and dialysis duration (OR, 1.02; CI, 1.01 to 1.04; P = 0.04) remained associated with positive MSNI. In a separate model in which PTDM was replaced by GHb, a 1-point increase in GHb doubled the OR for positive polyneuropathy screening (OR, 2.08; CI, 1.03 to 4.23; P = 0.04). Patients with PTDM also had cumulative higher number of errors in the SWME (P = 0.04).
Screening Tests for Distal Symmetric Polyneuropathy in Patients With NPTDM and PTDM
| PTDM | NPTM | P | |
|---|---|---|---|
| MSNI | |||
| Questionnaire score, median (IQR) | 3 (5) | 1 (3) | 0.02 |
| Positive screening, proportion, n (%)a | 6 (16.7) | 4 (8.5) | 0.32 |
| Clinical examination score, median (IQR) | 2 (2) | 0 (1) | 0.04 |
| Positive screening, proportion, n (%)b | 23 (64) | 7 (20) | <0.001 |
Significant P values appear in in bold-face type.
83 patients, 15 items, positive ≥7.
71 patients, 8 tests, positive ≥2.
Cardiovascular autonomic neuropathy
The results of cardiovascular reflex tests were similar in patients with and without PTDM. Resting heart rate (P = 0.81) and proportion of abnormal results of respiratory index (P = 0.42), 30:15 index (P = 0.78), Valsalva index (P = 0.21), and orthostatic hypotension test (P = 0.67) were not different between groups. Forty-six percent of patients with PTDM had at least two altered cardiovascular reflex tests compared with 65% of patients with NPTDM (P = 0.26). In logistic regression, PTDM diagnosis (P = 0.19), beta-blocker use (P = 0.23), number of antihypertensive drugs (P = 0.53), sex (P = 0.24), and age (P = 0.37) were not associated with CAN diagnosis.
DKD
There were no substantial differences between PCR, eGFR, and Δ eGFR measurements, as presented in Table 6. Use of angiotensin-converting-enzyme inhibitor or angiotensin receptor blockers (ARBs) was the same between patients with PTDM and NPTDM (17.6% vs 18.7%, P = 0.66) and did not influence eGFR (P = 0.55) or protein/creatinine ratio (P = 0.20). Mean systolic (137 ± 21.6 vs 132 ± 19.9mm Hg, P = 0.32) and diastolic (82.1 ± 19.9 vs 83.6 ± 12.5mm Hg, P = 0.57) blood pressure levels were similar between patients with and without diabetes.
Posttransplant Renal Function in Patients With PTDM and NPTDM
| PTDM | NPTM | P | |
|---|---|---|---|
| eGFR, mL/min, mean (± SD) | |||
| 3 mo | 52.3 (22.1) | 49.4 (16.9) | 0.443 |
| 6 mo | 52.6 (20.2) | 48.2 (16.4) | 0.210 |
| 12 mo | 56.9 (22.2) | 54.3 (17.6) | 0.513 |
| Current | 57.8 (26.8) | 53.1 (20.9) | 0.301 |
| Δ eGFR, median (IQR) | |||
| 3 moa | 8.05 (27.8) | 6.83 (23.4) | 0.757 |
| First year after transplantationb | 10.4 (54.1) | 5.18 (24.7) | 0.605 |
| PCR, median (IQR) | |||
| 3 mo | 0.20 (0.19) | 0.10 (0.11) | 0.260 |
| 6 mo | 0.20 (0.36) | 0.09 (0.13) | 0.209 |
| 12 mo | 0.25 (0.37) | 0.11 (0.09) | 0.489 |
| Current | 0.16 (0.87) | 0.15 (0.36) | 0.960 |
Difference between current eGFR and at 3 months after transplantation.
Difference between current eGFR and mean eGFR in the first year after transplantation.
Discussion
In the current study of kidney transplant recipients with PTDM for at least 5 years, we observed a lower than expected prevalence of classical diabetic microvascular complications. With a mean diabetes duration of 8 years and a mean GHb of 7.4% (57 mmol/mol), none of the evaluated patients had clinical diabetic retinopathy, and renal function was comparable to nondiabetic recipients with similar time elapsed from transplant. Regarding diabetic neuropathy, >50% of patients with PTDM had positive screening for distal symmetric polyneuropathy, which was higher than that observed in patients with NPTDM, but cardiovascular autonomic neuropathy parameters were similar in both groups. Interestingly, a higher frequency of retinal layer thinning through SS-OCT examination was observed in patients with PTDM.
Burroughs et al. (12), in a population database study from United States Renal Data System, evaluated the incidence of chronic diabetic complications in patients with PTDM. Fifty-eight percent of patients with PTDM developed at least 1 diabetic complication over a 3-year follow-up period, suggesting a more accelerated development of complications in transplant patients than in the general population with DM. Reasons for disagreement between these findings and ours include the period of the mentioned study (1995 through 2001), when immunosuppressive regimens used higher doses of corticosteroids and calcineurin inhibitors (26); the lack of uniformity in the PTDM definition; and, most important, the diagnosis of complications based on International Classification of Diseases (ninth edition) codes instead of the evaluation by specific clinical and laboratory evaluation. Most of the well-conducted studies evaluating PTDM addresses complications directly related to transplantation, such as graft failure.
The absence of diabetic retinopathy in our sample of patients with PTDM was unexpected. Compared with the retinopathy prevalence in patients with type 1 DM in the Wisconsin Diabetes Registry Study (24), we expected an occurrence of 6% to 23% of clinical retinopathy, after 4 and 7 years of DM diagnosis, respectively. Similar retinopathy frequency would be expected considering recently published data from the Diabetes Control and Complications Trial Research Group (27) in type 1 DM and the Romero-Aroca et al. (28) study, which found an annual retinopathy incidence of 15% in type 1 and of 8% in patients with type 2 DM. We are aware that both conditions are not ideal comparison models for PTDM. Although type 1 DM has a clear onset, it probably also has a worse glycemic control than that observed in PTDM. In the case of type 2 DM, the glycemic control might be closer to that observed in our cohort, but the diabetes duration is uncertain. Notably, despite the absence of conventional vascular retinopathy, PTDM was associated with thinning of inner retinal layers. Considering the better glycemic control exhibited by our patients in relation to those of the previously mentioned studies and the evidence of retinal neuronal damage evaluated by SS-OCT, we speculate that inner retinal layers thinning is an earlier manifestation of diabetic retinopathy, which has recently been named retinal neuropathy (29).
Diabetic retinopathy is considered a form of vasculopathy and classically manifests with microaneurysms, small hemorrhages, or lipoprotein exudates. Over the past decade, a pathophysiological model has become accepted that emphasizes that neurodegeneration is an important and early component of retinopathy. Retinal neuropathy is observed structurally, with neural apoptosis, ganglion cell loss, reactive gliosis, and thinning of the inner retina, and is perceived functionally, both in complementary diagnostics examinations (e.g., electroretinogram) and clinically (e.g., as deficits in dark adaptation and color vision) (29–32). In this sense, diabetic retinopathy seems to be a neurovascular rather than a solely microvascular disease (31). Perhaps diagnosis and intervention at the stage of retinal neuropathy would minimize the progression to severe retinal vascular complications.
The finding of similar renal function between patients with PTDM and NPTDM is corroborated by other recent studies. Sheu et al. (33) compared outcomes 12 months after kidney transplantation between patients with PTDM, NPTDM, and pretransplant diabetes. As well as our results, at 1-year posttransplant, all patients had chronic kidney disease stage 3 with comparable eGFR (45 ± 18 mL/min/1.73 m2). A study of 37,448 subjects from the Organ Procurement and Transplant Network/United Network for Organ Sharing database (34) also assessed the effect of PTDM on posttransplant outcomes. Creatinine category and creatinine (≥2, 1.5 to 2, and ≤1.5 mg/dL) at 12 months after transplantation were equivalent between pretransplant diabetes, patients with PTDM and NPTDM without a history of acute rejection. In a cohort of two distinct transplant periods (1990 to 1995 and 1996 to 2011), Choi and Kwon (35) also observed that renal function was not different among patients who were pre-DM and had PTDM or among patients without DM and PTDM regardless the period of follow-up. These results together with ours corroborate to reject the previous hypothesis that PTDM had a marked negative effect on the long-term kidney graft function.
We expected distal symmetric polyneuropathy and autonomic cardiovascular neuropathy to be present in both recipients with PTDM and NPTDM because the relationship between chronic kidney disease and neuropathies is well documented (36, 37). Interestingly, in our sample, PTDM and glycemic control measured by GHb remained predictors of polyneuropathy occurrence. Whether peripheral neurologic complications would be prevented by strict glycemic control is an object of future randomized clinical trials. We are very cautious in interpreting the cardiovascular autonomic neuropathy assessment because of various interferences, such as chronic kidney disease itself (38) and use of antihypertensive drugs. However, the substantial prevalence of altered tests suggests that further studies are needed to properly evaluate the effect of autonomic neuropathy on cardiovascular morbimortality in posttransplant population.
Our study has some limitations. The DKD evaluation should ideally be detected with histopathological diagnosis by renal biopsy, but this procedure was not feasible because of ethical considerations. Instead, we used laboratory tests that were suitable to biases: PCR may be influenced by residual diuresis of native kidney and ARB/angiotensin-converting enzyme inhibitor use, and renal function assessed by eGFR and serum creatinine may fluctuate according to serum levels of immunosuppressant medications and intercurrent infections.
Results from our study point to a paradigm shift on the significance of PTDM for kidney transplant patients. Studies published up to the first decade of the 2000s demonstrated a marked detrimental effect of PTDM on posttransplantation outcomes and suggested the possibility of a more aggressive DM than types 1 and 2 (12, 39). However, an attenuated effect of PTDM on early posttransplant mortality and graft loss was observed in two recent cohorts (40, 41), which, as ours, reflect current practice in terms of immunosuppression rationalization and management of diabetes. Despite almost 8 years of diabetes duration, patients enrolled in our cohort had a good glycemic control [median GHb 7% (53 mmol/mol)]. In addition, patients had frequent medical appointments, a factor that is known to improve diabetes management (9). All these particular characteristics may be reasons to justify the low occurrence of microvascular complications in our cohort, but we also believe that PTDM is a unique type of diabetes, less insulinopenic than type 1 and less inflammatory than type 2, and with milder target organ repercussions, at least in terms of microvascular complications.
This longitudinal study evaluates diabetic microvascular complications in kidney transplant recipients with PTDM. Our results have important practical implications. Peripheral diabetic neuropathy may affect most patients with PTDM after 5 years of diagnosis. Despite the absence of long-term studies assessing foot ulcers and amputations in this population, screening with previously validated methods for type 1 and 2 DM, via MSNI and SWME, may be useful in the prevention of such outcomes. Thereafter, screening for peripheral neuropathy should be incorporated in PTDM management guidelines. Nonetheless, no conventional vascular retinopathy, autonomic cardiovascular neuropathy, or kidney disease was demonstrated in this sample of patients with PTDM, an indication that aggressive screening for these conditions may not be justified. Most important, we have added evidence regarding possible early manifestations of diabetic retinopathy, retinal neuropathy, which can only be identified through OCT and may be a window of opportunity for prevention of more severe forms of retinopathy. Our results point to the need for long-term studies to determine the retinal thinning related to DM clinical course and its possible relation with hard outcomes, such as vision loss and lower limb amputations.
In conclusion, our findings contribute to a better understanding of PTDM. The initiation of microvascular complications does not seem to be accelerated as previously supposed. Nonetheless, screening for distal peripheral polyneuropathy may be recommended in patients with PTDM of at least 5 years’ duration. Longer prospective studies might elucidate the clinical course of PTDM complications, in particular, retinal neuropathy.
- Abbreviations
ARB, angiotensin receptor blocker
- CAN
cardiovascular autonomic neuropathy
- DKD
diabetic kidney disease
- eGFR
estimated glomerular filtration rate
- GCL
ganglion cell layer
- GCL+
ganglion cell layer plus inner plexiform layer thickness
- GCL++
retinal nerve fiber layer plus ganglion cell layer plus thickness
- GHb
glycated hemoglobin A1c
- MSNI
Michigan Neuropathy Screening Instrument
- NPTDM
non-posttransplant diabetes mellitus
- OCT
optical coherence tomography
- PCR
protein to creatinine ratio
- PTDM
posttransplant diabetes mellitus
- RNFL
retinal nerve fiber layer
- SS-OCT
swept-source optical coherence tomography
- SWME
Semmes-Weinstein monofilament examination
Acknowledgments
Financial Support: This work was funded by FAPERGS (Fundação de Amparo à Pesquisa do Estado do RS), CNPq (Conselho Nacional de Desenvolvimento Científico e Tecnológico) and FIPE/HCPA (Fundo de Incentivo à Pesquisa e Eventos do Hospital de Clínicas de Porto Alegre).
Disclosure Summary: The authors have nothing to disclose.
