


Abstract
Our group recently showed that animal protein was independently associated with nonalcoholic fatty liver disease (NAFLD). We hypothesize that this may be explained by a high diet-dependent acid load [dietary acid load (DAL)].
This cross-sectional study is embedded in a prospective population-based cohort. We estimated DAL proxies via food-frequency questionnaires using potential renal acid load (PRAL; using dietary protein, phosphorus, potassium, calcium, and magnesium intake), net endogenous acid production (NEAP; using protein and potassium intake), and the animal protein–to–potassium ratio (A:P). We defined NAFLD using ultrasound after excluding secondary steatogenic causes. We used logistic regression models—adjusted for sociodemographic, lifestyle, and metabolic traits—on categorized [quartile (Q)1 to 4] and continuous DAL proxies (allowing for nonlinearity) and NAFLD.
We included 3882 participants, of which 1337 had NAFLD. All DAL proxies were higher, meaning more acidic, in individuals with NAFLD (PRAL, −2.9 vs −5.5 mEq/d; NEAP, 37.0 vs 35.1 mEq/d; and A:P, 13.3 vs 12.4; all P < 0.001). The highest Q of DAL proxies was associated with NAFLD independent of sociodemographic and lifestyle confounders, but significance dissipated after correction for metabolic confounders and multiple testing. However, the P value for nonlinearity was significant in all DAL proxies (P < 0.001). Natural cubic splines performed better with than without DAL proxies in the fully adjusted model (all P ≤ 0.038). The highest probability of NAFLD was found for an acidic diet.
This study showed an independent nonlinear association between an acidic diet and NAFLD. Further studies with acid-base biomarkers are needed, but our findings might provide a mechanistic explanation for the harmful association between an animal protein–rich diet and NAFLD.
Nonalcoholic fatty liver disease (NAFLD) is the most common liver disease worldwide with an estimated prevalence of 25% in the adult population (1). Its occurrence closely parallels the obesity epidemic. Obesity and insulin resistance are therefore reckoned as novel risk factors for liver disease in the absence of the traditional risk factors, that is, alcohol misuse or viral hepatitis (2). NAFLD can progress to more severe liver disease, with hepatic fibrosis or cirrhosis potentially leading to the need for transplantation or even to liver-related death (3). Additionally, NAFLD is a major risk factor for the incidence of cardiovascular disease (4), and indeed the most common cause of death in NAFLD is related to cardiovascular events (5). Given the above, it is of great public health interest to unravel NAFLD pathophysiology to improve the understanding and treatment thereof.
Adhering to a healthy lifestyle, in terms of implementing a well-balanced diet and effectuating adequate physical activity, is the cornerstone of treatment of NAFLD across the entire spectrum of the disease (6, 7). Our contemporary Western diet, alternatively, is related to an increased risk of NAFLD development (8). This Western diet typically consists of a high intake of animal-based food products and sugar-containing beverages, and by a low intake of fruit, vegetables, and whole grains (9). Our group recently showed that animal protein was the only (subtype of) macronutrient that was independently associated with a higher prevalence of NAFLD in an elderly population–based cohort (10). Interestingly, others have found that red meat intake was associated with increased overall mortality, and in particular with liver-related mortality (11). However, the underlying mechanisms that contribute to this association remain elusive.
It has been previously postulated that a Western diet may cause low-grade metabolic acidosis, which may subsequently lead to metabolic disturbances such as type 2 diabetes (12) and cardiovascular diseases (13). The rationale for this hypothesis is that this diet is rich in food items that supply acid precursors (i.e., noncarbonic acids such as sulfuric acid from meat and fish) and low in food items that supply base precursors (i.e., alkali salts from organic acids such as citrate and bicarbonate from vegetables and fruits), leading to a disturbance in acid–base balance (14, 15). Two preceding studies have suggested an association between diet-dependent acid load [dietary acid load (DAL)] and NAFLD, independent of body mass index (BMI) (16, 17). Among them, Krupp et al. (17) showed that potential renal acid load (PRAL; a proxy of DAL) was associated with alanine aminotransferase (ALT) and steatosis, as defined by a surrogate diagnostic algorithm, in a small study of healthy adolescents. Moreover, Chan et al. (16) demonstrated that net endogenous acid production (NEAP; another proxy of DAL), but not PRAL, was associated with MRI-diagnosed NAFLD in a Chinese population (n = 793). Additionally, two recent Japanese studies have shown an association between low urine pH (indicator of metabolic acidosis) and incident NAFLD (18, 19).
To date, however, there has been no large-scale study on the association of diet-dependent acid load and NAFLD in Western adults. We therefore aimed to evaluate whether DAL [as assessed by PRAL, NEAP, and animal protein–to–potassium ratio (A:P)] was independently associated with ultrasound-defined NAFLD in an elderly Western population.
Subjects and Methods
Study population
This study is embedded in the Rotterdam Study (RS), a prospective cohort study that was initiated in the mid-1980s to study our aging population in more detail (20). The design and rationale behind the RS have been described in more detail previously (10, 20) and is also described in an online repository (21). In short, all participants of the RS reside in Ommoord, a suburb of Rotterdam, Netherlands, and all participants were aged 45 or 55 years or above at time of first enrollment. The RS consists of three different cohorts (RS I, RS II, and RS III) that each visited the research center multiple times. From 2009 onward the hepatology department joined this research initiative by expanding the extensive physical workup with liver imaging (this comprises cohorts RS I-5, RS II-3, and RS III-2). The RS has been approved by the Institutional Review Board (Medical Ethics Committee) of the Erasmus MC University Medical Center Rotterdam and by the review board of the Netherlands Ministry of Health, Welfare, and Sports. Written informed consent was obtained from all participants.
Dietary data and diet-dependent acid load
We requested all participants to complete an externally validated, semiquantitative, 389-item food frequency questionnaire (FFQ) that was developed for Dutch adults (22, 23). Habitual dietary intake was assessed by means of detailed questions on food item consumption during the last month that addressed not only type of food, but also quantity, portion size, and preparation methods. Servings were estimated in grams or in milligrams per day using standardized household measures (24). We extracted macronutrient intake from the questionnaires using the Dutch Food Composition Table (NEVO v2011) that contains information on nutrient content per gram or serving per product. DAL was calculated using three previously defined algorithms, which we will refer to as DAL proxies from this point forward. The DAL proxies included: (i) potential renal acid load (PRAL) (25), (ii) net endogenous acid production (NEAP) (15), and (iii) A:P (26).
Remer and Manz (25) developed PRAL to proxy the renal net acid excretion using nutrient intake data. PRAL was validated against urine pH in 24-hour urine samples from 63 healthy volunteers (25): PRAL (mEq/d) (25) = [0.4888 × protein (g/d)] + [0.0366 × phosphorus (mg/d)] − [0.0205 × potassium (mg/d)] − [0.0125 × calcium (mg/d)] − [0.0263 × magnesium (mg/d)].
Shortly after, Frassetto et al. (15) developed a simplified algorithm (NEAP) using dietary protein as acid precursor and potassium only, as base precursor from organic anions. This algorithm was validated in 141 healthy men and women consuming 20 different diets, and NEAP accounted for >70% of the variation in renal net acid excretion: NEAP (mEq/d) (15) = [54.5 × protein (g/d)/potassium (mEq/d)] − 10.2.
Finally, Zwart et al. (26) suggested the use of the ratio between animal protein intake and potassium intake instead of total dietary protein, as animal protein is considered to be the main contributor to diet-dependent acid load (27): A:P (26) = animal protein (g/d)/potassium (g/d).
We assessed adherence to the Dutch Dietary Guidelines 2015, using a predefined index that describes general advice to follow a balanced and healthy dietary pattern (28), to assess dietary quality (DQ). Briefly, this guideline comprises specified recommendations on (i) vegetables (≥200 g/d), (ii) fruit (≥200 g/d), (iii) whole-grain products (≥90 g/d), (iv) legumes (≥135 g/wk), (v) unsalted nuts (≥15 g/d), (vi) fish (≥100 g/wk), (vii) dairy (≥350 g/d), (viii) tea (≥150 mL/d), (ix) whole grains ≥50% of total grains, (x) unsaturated fats and oils ≥50% of total fats, (xi) red and processed meat <300 g/wk, (xii) sugar-containing beverages (≤150 mL/d), (xiii) alcohol (≤10 g/d), and (xiv) salt (≤6 g/d). Incomplete FFQs were excluded as well as FFQs with unreliable energy intake (i.e., <500 calories/d or ≥7500 calories/d).
Assessment of steatosis
Abdominal ultrasound was performed by a certified and experienced technician on a Hitachi HI VISION 900 (Pauline van Wijngaarden). Ultrasound images were stored digitally, so reevaluation by an experienced hepatologist (R.J.d.K.) was possible. All FFQs were filled in prior to liver imaging, so participants were unaware of the ultrasound results when completing the FFQ. Diagnosis of steatosis was determined dichotomously (29), measuring the hyperechogenicity of liver parenchyma. To define NAFLD, we first excluded participants that used steatogenic drugs (i.e., systemic corticosteroids, methotrexate, tamoxifen, or amiodarone). This was identified through linkage with pharmacy data. Second, participants with viral hepatitis were excluded, based on hepatitis B surface antigen and anti–hepatitis C virus serology, which was assessed using an automatic immunoassay (Roche Diagnostics, Mannheim, Germany). Third, we excluded participants with excessive alcohol consumption (>30 g/d for men and >20 g/d for women, based on the FFQ).
Other covariates
We obtained data on demographics, physical activity, and education level by means of an extensive home interview by qualified interviewers. Briefly, physical activity was assessed using the LASA Physical Activity Questionnaire and expressed in metabolic equivalent of task (MET; in h/wk) (30). Blood pressure was measured at a single visit using two successive measurements in a sitting position, and blood samples were collected after overnight fasting. Automatic enzyme procedures were used to measure blood lipids, platelet count, glucose, ALT, aspartate aminotransferase, and γ-glutamyltransferase [GGT (Roche Diagnostics]. An automatic immunoassay was used to determine insulin (Roche Diagnostics). Estimated glomerular filtration rate (GFR; in mL/min/1.73 m2) was based on calibrated creatinine levels using the Chronic Kidney Disease Epidemiology Collaboration creatinine equation (2009). Creatinine levels were calibrated by aligning mean values of serum creatinine from our cohort with those of the Third National Health and Nutrition Examination Survey in different age-and sex-specific categories (31). Anthropometrics were measured by well-trained research assistants. The presence of hypertension was diagnosed when either systolic (≥140 mm Hg) or diastolic (≥90 mm Hg) blood pressure was increased or the participant was on antihypertensive medication. Diabetes was defined as fasting glucose >7.0 mmol/L (≥126 mg/dL) or drug treatment of elevated blood glucose. Metabolic syndrome was diagnosed when three out of five of the following traits were present: (i) high waist circumference (≥102 cm for men and ≥88 cm for women), (ii) high blood pressure (≥130/85 mm Hg), (3) high-density lipoprotein (HDL) <1.0 mmol/L (≤40 mg/dL) in men and <1.3 mmol/L (≤50 mg/dL) in women or the use of lipid-lowering drugs, (iv) triglycerides >1.7 mmol/L (≥150 mg/dL) in both sexes or the use of lipid-lowering drugs, and finally (v) fasting glucose >5.6 mmol/L (≥100 mg/dL) (32). Insulin resistance was calculated using the homeostasis model assessment of insulin resistance (HOMA-IR): [fasting glucose (mmol/L) × fasting insulin (mU/lL)]/22.5 (33).
Statistical analyses
We excluded all participants with missing or unreliable FFQs, as well as participants with >30% missing study variables. Variables were imputed using multiple imputation under the fully conditioned specification to reduced bias due to missing data (34). A more detailed description on the imputation process can be found in an online repository (21).
Population characteristics of both the original and imputed data were described using the mean (SD), median (25th and 75th percentile), or percentage. We carried out ANOVAs to compare means for different strata [NAFLD vs no NAFLD and quartiles (Qs) of DAL] and Kruskal–Wallis tests to compare medians for different strata. To compare categorical variables across strata χ2 tests were used. In addition, we calculated Spearman rank correlation coefficients to give more insight into the correlations of DAL with dietary macronutrients, dietary micronutrients, and DQ. We then used logistic regression models to assess the association between DAL proxy categories and NAFLD for comparability with other DAL studies that used categorical analyses (17) and to facilitate clinical interpretation. Then we assessed linearity, fitting models with splines to allow for nonlinearity using natural cubic splines. Thereafter, we tested the need for the nonlinear terms and optimal degrees of freedom by comparing the spline model against linear models with the Akaike information criterion. Lastly, we tested the relevance of DAL as a predictor for NAFLD by comparing the spline model to a model without DAL using a likelihood ratio test.
We adjusted all analyses for potential confounders using four models. In model 1, we adjusted for potential sociodemographic confounders, that is, age, sex, education level (low/moderate/high), study cohort (RS I/RS II/RS III), and for energy intake (kilocalories). In model 2, we adjusted for lifestyle confounding factors such as alcohol use (in units; 1 U = 10 g), physical activity (MET h/wk), and smoking (current/past or never). In model 3 (the main model), we adjusted for metabolic variables, that is, HDL cholesterol (in mmol/L), triglycerides (in mmol/L), presence of metabolic syndrome, estimated GFR (in mL/min/1.73 m2), presence of diabetes mellitus, and BMI (in kg/m2). Finally, in model 4, we tested the potential confounding effect of DQ on the association between DAL and NAFLD. The selection of covariates was based on previous literature (35). Results were expressed as predicted probability or ORs per Q both with the accompanying 95% CI. Additionally, we tested all models for multicollinearity (variance inflation factor >5.0). Furthermore, to test the robustness of our results we performed several sensitivity analyses. First, to account for potential measurement error in dietary intake and to remove extraneous variation arising from total energy intake, all DAL proxies were adjusted for energy intake using the residual method, that is, that part of the DAL proxies that was not explained by total energy intake (36). Second, to test the robustness of our results, we performed several stratified analyses. We stratified by sex, as sex differences in DAL have been previously suggested (12, 17). We stratified by cohort, as participants from various cohorts differ in terms of age (mean age RS III, 62 years; RS II, 72 years; and RS I, 79 years) and because there was a median time gap of 5.5 years between completing the FFQ and performance of ultrasound in cohort three [RS III; see the online repository (21)]. However, as dietary data are known to be stable over time (37), RS III was included in the main analysis. We also stratified by GFR, using 60 mL/min/1.73 m2 as the cutoff to distinguish between a normal and impaired renal function [as the kidneys play a crucial role in maintaining acid–base balance in the body (38)]. We stratified by age (using 65 years as the cutoff), as DAL associations have been previously observed particularly in young individuals (39). Then, we stratified by BMI at a cut-point of 25 kg/m2, as participants with a normal BMI (lean) could have a different pathophysiological pathway compared with participants who are overweight (12, 40). Third, we replaced presence of diabetes with the continuous proxy for insulin resistance, HOMA-IR, in model 3, to test the hypothesis that the mechanistic explanation behind DAL associations are mediated by insulin resistance (41, 42). Lastly, we alternately excluded Q1 or Q4 from the continuous spline analyses to assess whether it was the alkaline component or the acidic component (respectively), or both, that drives the association between DAL proxies and NAFLD.
To correct for the inflated type I error that arises due to multiple testing, we applied the method proposed by Šidák (43), adapted as described in Galwey et al. (44), using the effective number of tests (n = 1.8) instead of the actual number of tests (n = 3). This adaptation is necessary to take into account that dietary exposures intercorrelate instead of being independent from each other. The resulting corrected significance level for all DAL proxy analyses was P < 0.028. All analyses were performed using R version 3.5.1.
Results
Participant characteristics
In total, 5967 participants were eligible for this study. We excluded unreliable FFQs (n = 98; 1.6%) and missing FFQs (n = 1075; 18%). These participants were significantly younger (68.5 vs 69.6 years of age; P < 0.01), less often of European descent (95% vs 98%; P < 0.01), and had a higher BMI (27.5 vs 26.9 kg/m2; P < 0.01), but there was no difference in steatosis prevalence (37.2% vs 35.5%; P = 0.27) and sex (55.8% vs 57.5%; P = 0.27). Subsequently, we excluded 40 participants (0.8%) that had >30% of missing data on study variables. Lastly, we excluded 872 participants (18.3%) with potential secondary causes for steatosis [n = 123 steatogenic drug use, n = 691 alcohol misuse, n = 31 viral hepatitis, n = 27 combination of the aforementioned factors (21)]. Hence, the total study population consisted of 3882 participants, of which 1337 individuals had NAFLD (34.4%). The median DAL proxies in this population were as follows: PRAL, −4.7 mEq/d (−15.4, 4.4); NEAP, 35.7 mEq/d (29.6 to 42.3); and A:P, 12.7 (10.2 to 15.4). Population characteristics on both original and imputed data are shown in an online repository (21). In short, mean age was 69.7 years (8.8), median BMI was 26.9 (24.5 to 29.7), 58.3% were female, and most were of European descent (97.6%). Population characteristics are shown according to NAFLD stratum in an online repository (21). Median DAL proxies were significantly higher in participants with NAFLD than in participants without NAFLD, that is, for PRAL, −2.9 vs −5.5 mEq/d (P = 4.97 × 10⁻⁶), for NEAP, 37.0 vs 35.1 mEq/d (P = 2.74 × 10⁻⁶), and for A:P, 13.3 vs 12.4 (P = 1.70 × 10⁻¹⁰).
Characteristics of diet-dependent acid load
Population characteristics per PRAL Q are given in Table 1. The median PRAL of Q4 was 11.1 (7.4, 17.6) mEq/d. Additionally, characteristics per NEAP and A:P Qs are depicted in an online repository (21). The median NEAP in the Q4 of NEAP was 47.5 (44.6 to 53.0) mEq/d, and the median A:P in the Q4 of A:P was 17.8 (16.4 to 20.1). Similar characteristics for Q4 in all DAL proxies were found, being a lower proportion of females, lower physical activity, more current or former smokers, higher BMI, and higher GGT. Additionally, there were more comorbidities, in particular higher prevalence of NAFLD and diabetes [Table 1; see online repository (21)].
Characteristics per Quartile PRAL
| PRAL | |||||
|---|---|---|---|---|---|
| Q1 | Q2 | Q3 | Q4 | P Value | |
| DAL | |||||
| PRAL | −24.4 (−33.7, −19.1) | −9.7 (−12.5, −7.2) | −0.33 (−2.3, 1.9) | 11.1 (7.4, 17.6) | n/a |
| NEAP | 25.6 (21.9–28.4) | 32.7 (30.9–34.3) | 38.7 (37.0–40.7) | 47.4 (44.1–52.9) | <0.001 |
| A:P | 9.2 (7.6–10.5) | 11.7 (10.4–13.2) | 13.9 (12.4–15.4) | 17.2 (15.0–19.9) | <0.001 |
| Demographics | |||||
| Age, y | 70.2 (8.8) | 69.8 (8.6) | 69.8 (8.8) | 69.1 (9.2) | 0.057 |
| Female, % | 67.6 | 62.5 | 54.9 | 48.2 | <0.001 |
| White, % | 97.6 | 97.9 | 97.8 | 97.2 | 0.804 |
| Education level, % | |||||
| Low | 48.4 | 49.7 | 47.9 | 47.7 | 0.167 |
| Intermediate | 27.7 | 29.4 | 31.6 | 32.5 | |
| High | 23.9 | 20.9 | 20.5 | 19.8 | |
| Smoking status, % | |||||
| Never | 39.5 | 37.7 | 34.5 | 32.6 | 0.009 |
| Current/former | 60.5 | 62.3 | 65.5 | 67.4 | |
| Alcohol, U/d | 0.45 (0.04–1.16) | 0.49 (0.08–1.22) | 0.45 (0.07–1.22) | 0.43 (0.03–1.17) | 0.203 |
| Physical activity, MET h/wk | 46.4 (18.5–84.5) | 43.0 (17.0–78.8) | 37.0 (14.3–74.5) | 34.6 (13.5–73.2) | <0.001 |
| Energy intake, kcal/d | 2175 (1823–2667) | 1929 (1557–2363) | 1891 (1488–2360) | 2105 (1700–2668) | <0.001 |
| Physical examination | |||||
| BMI, kg/m2 | 26.5 (24.3–29.4) | 26.8 (24.5–29.4) | 27.0 (24.6–29.9) | 27.2 (24.7–30.0) | 0.010 |
| Biochemistry | |||||
| AST, U/L | 24 (21–28) | 24 (21–28) | 24 (21–28) | 25 (21–29) | 0.125 |
| ALT, U/L | 18 (14–24) | 18 (14–23) | 18 (14–24) | 20 (15–25) | <0.001 |
| GGT, U/L | 21 (16–30) | 22 (16–32) | 23 (17–34) | 25 (18–37) | <0.001 |
| Platelets, ×109/L | 269 (232–309) | 263 (224–305) | 259 (220–303) | 257 (218–303) | 0.002 |
| HOMA-IR | 2.4 (1.7–3.7) | 2.5 (1.7–3.9) | 2.6 (1.7–4.2) | 2.9 (1.8–4.6) | <0.001 |
| Total cholesterol, mmol/L | 5.6 (1.1) | 5.5 (1.1) | 5.4 (1.1) | 5.3 (1.1) | <0.001 |
| HDL-C, mmol/L | 1.5 (0.4) | 1.5 (0.4) | 1.5 (0.4) | 1.4 (0.4) | <0.001 |
| Triglycerides, mmol/L | 1.3 (1.0–1.7) | 1.3 (1.0–1.7) | 1.3 (1.0–1.7) | 1.3 (1.0–1.8) | 0.482 |
| GFR | 76 (66–86) | 76 (66–86) | 75 (66–85) | 76 (65–86) | 0.796 |
| Comorbidities | |||||
| Metabolic syndrome | 48.4 | 52.6 | 54.2 | 57.1 | 0.003 |
| Waist circumference | 40.2 | 43.2 | 43.8 | 45.6 | 0.112 |
| Triglycerides | 41.6 | 45.4 | 48.4 | 48.5 | 0.007 |
| HDL-C | 40.1 | 44.7 | 46.5 | 47.2 | 0.007 |
| Blood pressure | 84.6 | 85.0 | 83.7 | 83.7 | 0.794 |
| Fasting glucose | 41.8 | 45.1 | 46.6 | 53.5 | <0.001 |
| Diabetes mellitus, % | 11.1 | 11.6 | 12.5 | 17.3 | <0.001 |
| Hypertension, % | 73.8 | 75.7 | 72.1 | 74.3 | 0.363 |
| NAFLD | 30.9 | 31.8 | 35.2 | 39.9 | <0.001 |
Data are expressed as mean (SD), median (25th and 75th percentile), or percentage. P values are based on ANOVA, a Kruskal–Wallis test, or a χ2 test.
Abbreviations: AST, aspartate aminotransferase; HDL-C, HDL cholesterol; n/a, not applicable.
PRAL, NEAP, and A:P correlations with other dietary parameters are depicted in Table 2. All DAL proxies correlated inversely with DQ, meaning that the higher the DAL proxy the lower the DQ (rs = −0.29 for PRAL, rs = −0.29 for NEAP, and rs = −0.32 for A:P). In particular, fruit intake had a strong inverse correlation with DAL (rs = −0.51 for PRAL, rs = −0.50 for NEAP, and rs = −0.37 for A:P). Also, monosaccharides and disaccharides and fiber intake were inversely correlated (Table 2). As expected, all DAL proxies correlated positively with animal protein (rs = 0.26 for PRAL, rs = 0.32 for NEAP, and rs = 0.51 for A:P).
Correlations Between DAL Proxies and Diet
 |
|
Correlations Between DAL Proxies and Diet
|
|
Categorized diet-dependent acid load and NAFLD
The highest quartile, Q4, of PRAL was associated with higher prevalence of NAFLD (using Q1 as reference) in all models (Table 3). However, after correction for multiple testing, the association between PRAL and NAFLD was no longer significant in model 3 (ORQ4vsQ1, 1.26; 95% CI, 1.01 to 1.58; P = 0.041). A similar association was seen for NEAP, in which the Q4 of NEAP was only significantly associated with NAFLD in models 1 and 2 (model 3: ORQ4vsQ1, 1.24; 95% CI, 0.99 to 1.56; P = 0.058). Lastly, the Q4 of A:P had a more pronounced association with NAFLD than PRAL and NEAP in the first two models, but this association was confounded by metabolic factors—in particular by the metabolic syndrome, BMI, and diabetes mellitus—in model 3 (ORQ4vsQ1, 1.22; 95% CI, 0.97 to 1.52; P = 0.089).
Logistic Regression Analyses of DAL Proxies With NAFLD as Dependent Variable
| Total Population (n = 3882) | |||
|---|---|---|---|
| Q2 | Q3 | Q4 | |
| PRAL, n per quartile | (n = 970) | (n = 971) | (n = 970) |
| NEAP, n per quartile | (n = 970) | (n = 971) | (n = 970) |
| A:P, n per quartile | (n = 970) | (n = 971) | (n = 970) |
| Model 1 (sociodemographic) | |||
| PRAL | 0.99 (0.81–1.20) | 1.14 (0.94–1.38) | 1.42 (1.17–1.72)a |
| NEAP | 1.02 (0.84–1.24) | 1.24 (1.02–1.50) | 1.40 (1.15–1.69)a |
| A:P | 1.14 (0.94–1.39) | 1.36 (1.12–1.65)a | 1.63 (1.35–1.97)a |
| Model 2 (lifestyle) | |||
| PRAL | 0.98 (0.81–1.19) | 1.12 (0.92–1.36) | 1.38 (1.14–1.67)a |
| NEAP | 1.03 (0.85–1.25) | 1.22 (1.01–1.48) | 1.36 (1.12–1.65)a |
| A:P | 1.14 (0.94–1.39) | 1.33 (1.09–1.61)a | 1.58 (1.31–1.92)a |
| Model 3 (metabolic) | |||
| PRAL | 0.97 (0.77–1.21) | 1.09 (0.87–1.36) | 1.26 (1.01–1.58) |
| NEAP | 0.97 (0.78–1.22) | 1.18 (0.94–1.47) | 1.24 (0.99–1.56) |
| A:P | 0.96 (0.77–1.21) | 1.09 (0.87–1.36) | 1.22 (0.97–1.52) |
| Model 4 (metabolic + DQ) | |||
| PRAL | 0.97 (0.77–1.21) | 1.09 (0.87–1.37) | 1.27 (1.01–1.60) |
| NEAP | 0.98 (0.78–1.22) | 1.18 (0.94–1.47) | 1.25 (0.99–1.57) |
| A:P | 0.96 (0.77–1.21) | 1.09 (0.87–1.37) | 1.22 (0.97–1.54) |
Values are ORs with 95% CIs taking Q1 as reference. Bold values indicate P < 0.05. Model 1 (sociodemographic) is adjusted for age, sex, education level, energy intake, and study cohort. Model 2 (lifestyle) is, in addition to the previous model, adjusted for past or current smoking, units of alcohol, and physical activity. Model 3 (metabolic) is, in addition to the previous model, adjusted for HDL-cholesterol, triglycerides, metabolic syndrome, GFR, diabetes mellitus, and BMI. Model 4 (metabolic + DQ) is, in addition to the previous model, adjusted for DQ.
Indicates significant values using P < 0.028 as determined by Šidák.
Continuous diet-dependent acid load and NAFLD
Logistic regression with natural cubic splines for DAL showed a clear nonlinear effect of DAL (P for nonlinearity for PRAL, 6.5 × 10⁻⁴; NEAP, 3.7 × 10⁻⁴; and A:P, 2.7 × 10⁻⁵) . The predicted probability of NAFLD in model 3 (metabolic) was lowest within the alkaline PRAL range of −45 to −4 mEq/d, with a minimum predicted probability of NAFLD that was 29%, whereas the predicted probability of NAFLD increased to 36% for acidic PRAL values (9 to 11 mEq/d; equals Q4; Fig. 1A). A similar shape was seen for NEAP and A:P (Fig 1B and 1C). For NEAP Q1 and Q2, NAFLD probability was low (<33%), but increased for Q4 toward 37% (Fig. 1B). For Q1 and Q2 of A:P, the probability of NAFLD was low (again <33%), and the highest predicted probability of NAFLD (36%) was seen at an A:P of 17 (again equals Q4; Fig. 1C). The shape of the splines for models 1 and 2 were very similar to that of model 3, but generally with higher predicted probabilities of NAFLD and more pronounced differences between high and low DAL (21). All models performed better with DAL in the model than without DAL, and this even remained significant for NEAP and A:P after multiple comparison correction (log-likelihood ratio test: P = 0.038 for PRAL; P = 0.015 for NEAP; P = 0.012 for A:P).
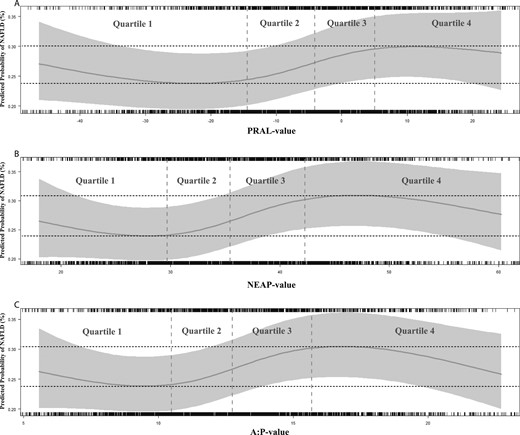
Natural cubic splines for the association of (A) PRAL, (B) NEAP, and (C) A:P with the predicted probability of NAFLD in (metabolic) model 3. (A) Model with PRAL vs model without PRAL (P = 0.038). (B) Model with NEAP vs model without NEAP (P = 0.015). (C) Model with A:P vs model without A:P (P = 0.012). The y-axis represents predicted probability of NAFLD in (metabolic) model 3: NAFLD ∼ DAL proxy + age + sex + education level + energy intake + study cohort + smoking + units of alcohol + physical activity + HDL cholesterol + triglycerides + metabolic syndrome + GFR + diabetes mellitus + BMI. The x-axis represents values of PRAL, NEAP, or A:P. The gray-colored bar represents the 95% CI. The upper and lower 2.5th percentile were excluded from the graphs.
Diet-dependent acid load and potential confounding by DQ
We assessed whether DAL was confounded by DQ in a separate model 4. Categorical analyses of DAL proxies with NAFLD adjusted for DQ are depicted in model 4 of Table 3. Although the results were not statistically significant, the associations hardly attenuated after adjustment of DQ. Hence, DQ could not fully explain the association between DAL and NAFLD. The same effect of DQ was seen on the splines (PRAL, P = 0.043; NEAP, P = 0.017; A:P, P = 0.014; comparing the models with and without DAL proxies) (21).
Sensitivity analyses
To test the robustness of our findings, we carried out multiple sensitivity analyses. First, we used the residual method to account for extraneous variation in DAL arising from total energy intake. The associations with PRAL attenuated slightly, but the results for NEAP and A:P were similar to the main analysis (21). Second, we stratified by several predefined covariates (21). All stratified results largely resembled the original analyses (Fig. 2). Interestingly, PRAL was nominally significantly associated with higher NAFLD prevalence in participants with an impaired kidney function after full adjustment in the metabolic model (ORQ4vsQ1, 1.81; 95% CI, 1.01 to 3.24; P = 0.047) (21). Third, we have additionally adjusted model 3 for insulin resistance (instead of diabetes presence, using HOMA-IR) and found that the association dissipated, indicating the mediating role of insulin resistance in this association (ORQ4vsQ1 for PRAL, 1.20; 95% CI, 0.95 to 1.51; for NEAP, 1.16; 95% CI 0.92 to 1.46; for A:P, 1.13; 95% CI, 0.90 to 1.42). And fourth, to assess whether it is the acidic component or the alkaline component that drives the association between DAL proxies and NAFLD, we alternately excluded the alkaline component (Q1) and the acidic component (Q4) from the analyses. All models with DAL proxies performed better than models without DAL proxies only when the alkaline component was excluded, but not when the acidic component was excluded (log-likelihood ratio test excluding Q1: P = 0.032 for PRAL; P = 0.015 for NEAP; P = 0.011 for A:P; log-likelihood ratio test excluding Q4: P = 0.310 for PRAL; P = 0.115 for NEAP; P = 0.253 for A:P. This may indicate that it is the acidic component drives the association between DAL proxies and NAFLD.
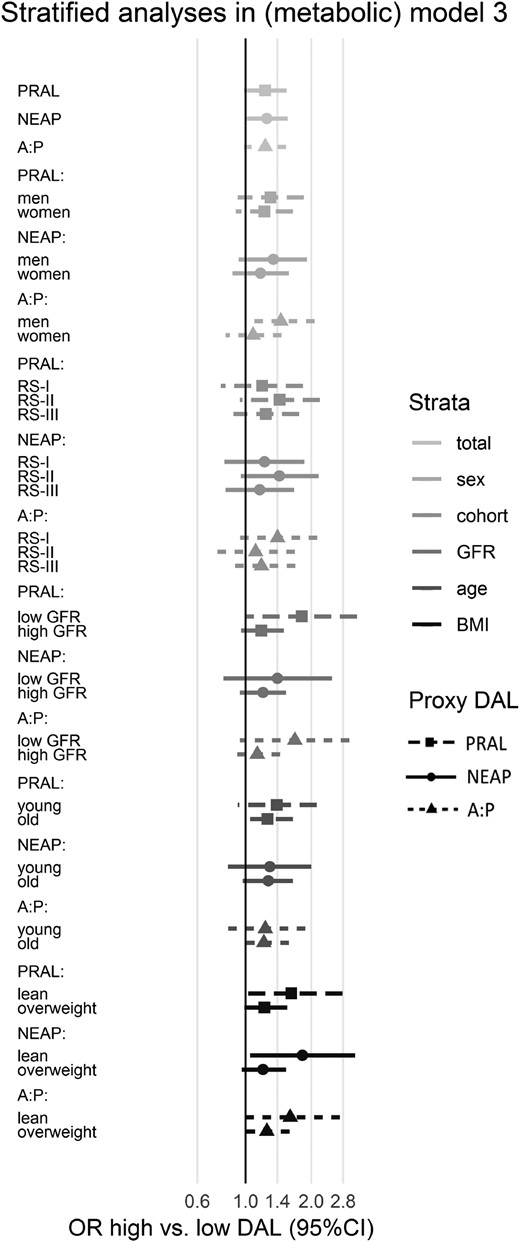
Associations of DAL proxies with NAFLD stratified by various covariates in the metabolic model. Values are ORs of Q4 with 95% CIs taking Q1 as reference. All strata are analyzed within modified (metabolic) model 3: NAFLD ∼ DAL proxy + (age) + (sex) + education level + energy intake + (study cohort) + smoking + units of alcohol + physical activity + HDL cholesterol + triglycerides + metabolic syndrome + (GFR) + diabetes mellitus + (BMI). This figure represents data that can also be found in more detail in an online supplement (21).
Discussion
In this largest population-based cohort study to date, we found that diet-dependent acid load, as assessed by net endogenous acid production and A:P, was independently associated with NAFLD. This association was not linear: the highest probability of NAFLD (36% to 37%) was found for an acidic diet, and the minimum predicted probability of NAFLD (29%) was found for an alkaline diet. Indeed, the association was driven mainly by the acidic component of the diet. Importantly, models with NEAP and A:P performed significantly better in predicting NAFLD than without these indices of DAL, even after correction for numerous confounders such as BMI and overall DQ. Moreover, the association between DAL proxies and NAFLD was tested for in different subgroups of the population, which showed overall consistent results.
Despite all ongoing pharmacological studies, lifestyle intervention remains the only available treatment of NAFLD today (45). Recently, several studies found detrimental associations between high animal protein intake (10, 46) and NAFLD. Among them, a recent study from Zelber-Sagi et al. (47) found that high red and processed meat consumption was associated with NAFLD and insulin resistance. This is in line with another recent study from Etemadi et al. (11) that showed that a diet rich in red meat was associated with higher incidence of liver-related mortality. Food items from the Western dietary pattern, such as red meat, generally contribute to a higher diet-dependent acid load (38). Indeed, animal protein had the highest positive correlation with all DAL proxies in our study as well. Interestingly, the highest inverse correlation with DAL proxies was found for monosaccharides and disaccharides. This is in line with our previous study in which we found an inverse association of monosaccharides and disaccharides with NAFLD, although this was not independent from metabolic confounders. We also know that fruit was by far the most contributing group to this macronutrient, and fruits have indeed an alkalinizing potential (38).
In this study, we show that in particular an acidic diet was associated with higher NAFLD prevalence, and we therefore hypothesize that diet-dependent acid load may (partially) explain the link between an animal protein–rich diet and NAFLD. Interestingly, our findings are in line with two previous studies on DAL and NAFLD (16, 17). A study on German adolescents found that PRAL was associated with ALT, fatty liver index, and hepatic steatosis index in girls but not in boys (17). However, the study population was small (n = 145), the study only included adolescents and young adults (mean age, 20 years), and steatosis algorithms were assessed only continuously (but prevalence was most probably low, as median fatty liver index was ±10). Another elegant study analyzed PRAL and NEAP in association with NAFLD (assessed by MRI-estimated proton density fat fraction) in 793 Chinese adults (16). The authors found an association between NEAP and NAFLD in multivariable analysis. However, linearity of PRAL and NEAP was not assessed in these two studies (16, 17), which makes direct comparison (along with major sociodemographic differences) to our Western adult population difficult. Of note, mean diet-dependent acid load in the latter study was rather high (PRAL, 24 mEq/d; NEAP, 77 mEq/d) (16) in comparison with our study and that of others, which was relatively more alkaline (i.e., the RS: PRAL, −4.7mEq/d and NEAP, 36 mEq/d; Nurses’ Health Study: PRAL, −3.1 mEq/d and NEAP, 44 mEq/d; and Health Professionals’ Follow-up Study: PRAL, 5.7 mEq/d and NEAP, 48 mEq/d) (12).
Diet-dependent acid load has also been implicated in other health outcomes that are related to NAFLD, such as type 2 diabetes and hypertension (38). An interesting Swedish study examined whether PRAL was associated with overall mortality in >80,000 individuals followed for 13 years (48). Similar to our study, the authors found a nonlinear association between PRAL and all-cause mortality but rather a U-shaped spline. Thus, both dietary acid and alkali excess were associated with increased mortality risk. We did not observe a clear U-shape in our splines, but the predicted probability of NAFLD was indeed also higher in the distinct alkaline diets. To date, there is no study that showed that a diet high in alkaline load is detrimental for health; however, one could speculate that a one-sided, unbalanced diet might be unhealthy anyway, possibly also via other mechanisms than diet-dependent acid load alone. Rightfully so, the authors of this Swedish study argued whether the low impact (hazard ratio, 1.06) of PRAL on mortality risk is important in terms of public health. Indeed, there are studies that found no association between diet-dependent acid load and health (49, 50). Differences in sociodemographic factors such as age, sex, ethnicity, and dietary habits could have contributed to these contrasting results. We have therefore performed several predefined subgroup analyses. Most subgroup analyses were not statistically significant, but should be interpreted in light of lower statistical power, and they generally confirmed the main results. Yet, the highest Q of PRAL was nominally significant in participants with an impaired renal function (estimated GFR <60 mL/min/1.73 m2) and, albeit not significant, the same trend was seen for both NEAP and A:P. The results were not significant after multiple testing correction, but again, they should be interpreted in light of lower power (n = 597). This finding is not surprising, as the kidney plays a crucial role in maintaining acid–base balance (51). Likewise, a long-term high diet-dependent acid load could also contribute to the development of chronic kidney disease by increasing endothelin-1, angiotensin-II, and aldosterone production to meet the demand for hydrogen excretion (52).
Mechanistically, it is thought that consumed proteins, in particular sulfur-containing amino acids (e.g., methionine and cysteine) found in animal proteins, form sulfate after oxidation (38). This is a nonvolatile acid that can be neutralized by bicarbonate but forms a hydrogen bond as an end product. In contrast, plant protein often contains glutamate, which can be metabolized without this formation. Fruit, alternatively, is potassium-rich and often accompanied by citrate and malate, which consume hydrogen bonds to become neutral and hence are alkalinizing (53). This low-grade or subclinical metabolic acidosis has been associated with various metabolic alterations (54). Among others, a change in glucose homeostasis has been found, being a lower insulin response to high glucose in the presence of a low pH (41). Also, long-term subclinical metabolic acidosis may increase adrenal cortisol production (modulated by the hypothalamic–pituitary–adrenal axis) and subsequently may lead to visceral obesity and insulin resistance (42, 55). In our study, adjustment for insulin resistance, as assessed by HOMA-IR, weakened the association between DAL and NAFLD, confirming our hypothesis that the association between DAL and NAFLD is mediated via insulin resistance (41, 42). Based on experimental studies, it has been proposed that low-grade metabolic acidosis influenced the GH/IGF-1 system, leading to hepatocellular GH resistance and subsequent hepatic lipid accumulation (56, 57). Opponents of the diet-dependent acid load hypothesis argue that DAL proxies are merely a different way of scoring adherence to a healthy diet. Although we cannot exclude this possibility, separate correction for adherence to DQ did not fully explain the association between DAL and NAFLD. Indeed, food items can effectuate health changes without affecting acid–base balance. For example, fruits and vegetables also contain dietary fiber that is beneficial for glycemic control (58). Also, it has been suggested that the metabolization of sulfur-containing amino acids (i.e., methionine and cysteine found in animal protein) in the liver can directly cause liver injury (59). Lastly, an experimental rat study found that a high-protein diet upregulated mRNA expression of genes encoding proteins involved in amino acid uptake and enhanced lipid synthesis (60). In this study, hepatic mRNA and protein levels of heat shock protein 90, a marker of liver injury, were markedly increased in these rats fed a high-protein diet. Of note, high protein intake did not result in elevated hepatic lipid concentrations in these rats.
Our study has several strengths, including a large sample size, availability of a great number of well-defined covariates, the (predefined) subgroup analyses to confirm the robustness of our findings, the evaluation of linearity and subsequent use of natural cubic splines, and the correction for multiple testing. Nonetheless, there are several considerations that need to be addressed. First, this study comprises a large predominantly elderly and white population, with a relatively alkaline diet. Despite the reassuring similar results in several subgroups of participants, caution on generalizability should be exercised. Second, owing to the cross-sectional design of this study it is not possible to draw any conclusions on causality. Third, although we have corrected for a large number of different traits, we cannot exclude the possibility of residual confounding. Fourth, as with any self-administered questionnaire, the FFQ is susceptible for recall and reporter bias. Nonetheless, we have tried to limit this bias by excluding potentially unreliable FFQs and by performing a sensitivity analyses with DAL proxies corrected by the residual method to account for extraneous variation in energy intake. Fifth, one of the three included cohorts (RS III) completed the FFQ 5.5 years prior to liver imaging. We assumed that dietary data were stable over time (23), which was indeed recently shown in another paper from the RS (61). Nonetheless, we used study cohorts as covariables in all regression models; moreover, we performed a sensitivity analysis per study cohort. All of the separate cohorts showed results that were comparable to the main analysis. Sixth, we used ultrasonography to assess steatosis, which has a good sensitivity to detect moderate steatosis but is poor in detecting mild steatosis and in grading steatosis. Moreover, the golden standard to assess NAFLD as well as its advanced subtype nonalcoholic steatohepatitis, is a liver biopsy. However, it is unethical to perform this invasive procedure on a large scale in presumed healthy individuals. Finally, we had no acid–base biomarkers available to estimate actual metabolic acidosis. However, NEAP and PRAL have been previously validated in healthy individuals and accounted for 71% of the variation in renal net acid excretion (15, 25). Additionally, although A:P has not yet been validated in healthy individuals, results of A:P were very comparable to those of NEAP and PRAL.
In conclusion, this study shows that an acid–base unbalanced diet is associated with NAFLD and that differences in sociodemographics, lifestyle, metabolic factors, and DQ did not fully explain the observed associations. Although the results should be interpreted in the context of a relatively alkaline diet, our findings might explain the previously observed association of an animal protein–rich diet with NAFLD. Future research initiatives should use acid–base biomarkers, such as urinary ammonium (62), to study low-grade metabolic acidosis more objectively. Nevertheless, dietary recommendations that are in agreement with an acid–base balanced diet—that is, a diet rich in fruit and vegetables and poor in animal protein—are generally considered beneficial for health. Therefore, adherence to such a diet low in animal protein while awaiting the results of future studies seems justifiable.
Acknowledgments
The authors thank the Rotterdam Study participants and staff, in particular the collaborating general practitioners and pharmacists. The authors are also deeply grateful to Paulien van Wijngaarden (nurse ultrasonographist) for performing the abdominal ultrasonography.
Financial Support: The Rotterdam Study is supported by the Erasmus MC University Medical Center and Erasmus University Rotterdam, the Netherlands Organization for Scientific Research, the Netherlands Organization for Health Research and Development, the Research Institute for Diseases in the Elderly, the Ministry of Education, Culture, and Science, the Ministry of Health, Welfare, and Sports, the European Commission (DG XII), and by the Municipality of Rotterdam. J.C.K.-d.J. received a grant from the Den Dulk-Moermans Foundation (Leiden University Fund).
Author Contributions: L.J.M.A., J.C.K.-d.J., and E.J.H. designed research; L.J.M.A. acquired participant data; J.C.K.-d.J. acquired nutritional data; L.J.M.A., J.C.K.-d.J., and N.S.E. analyzed data and performed statistical analysis; L.J.M.A. wrote the paper; R.J.d.K. provided technical support; H.J.M. and H.L.A.J. obtained funding; S.D.M., M.A.I., and O.H.F. supervised the study; S.D.M. has primary responsibility for the final content. All authors read and approved the final manuscript.
Disclosure Summary: The authors have nothing to disclose.
Abbreviations:
- ALT
alanine aminotransferase
- A:P
animal protein–to–potassium ratio
- BMI
body mass index
- DAL
dietary acid load
- DQ
dietary quality
- FFQ
food frequency questionnaire
- GFR
glomerular filtration rate
- HDL
high-density lipoprotein
- HOMA-IR
homeostasis model assessment of insulin resistance
- MET
metabolic equivalent of task
- NAFLD
nonalcoholic fatty liver disease
- NEAP
net endogenous acid production
- PRAL
potential renal acid load
- Q
quartile
- RS
Rotterdam Study
