


Abstract
Thyrotoxic periodic paralysis (TPP) is an acute complication of thyrotoxicosis that can be lethal. TPP is rare in Caucasians but often affects young men in East Asian populations. This study aimed to clarify the contribution of KCNJ18 to susceptibility to TPP in East Asian populations.
The study comprised 635 participants including 13 Japanese patients with TPP, 208 Japanese patients with Graves disease without TPP, and 414 healthy control subjects from the Japanese (n = 208), Korean (n = 111), and Caucasian populations (n = 95). DNA samples from 29 participants (13 with TPP, 8 with Graves disease, and 8 controls) were sequenced for KCNJ18, and all participants (n = 635) were genotyped for six variants of KCNJ18 and a polymorphism of KCNJ2 (rs312691).
Six single-nucleotide variants (SNVs) with amino acid substitutions were identified by direct sequencing of KCNJ18. Among these, four SNVs comprised three haplotypes under strong linkage disequilibrium. Haplotype 1 (AAAG) of KCNJ18 was significantly associated with susceptibility to TPP in the Japanese population (OR = 19.6; 95% CI, 1.5 to 256.9; P = 0.013). Haplotype frequencies in the general East Asian (Japanese and Korean) and Caucasian populations differed significantly (haplotype 1: 80.8% vs 48.4%, P = 1.1×10⁻²⁷).
A major haplotype of KCNJ18 in East Asian populations is significantly associated with susceptibility to TPP. The haplotype is much more common in East Asian than Caucasian populations, suggesting its contribution to the high prevalence of TPP in East Asian populations.
Thyrotoxic periodic paralysis (TPP) is an acute complication of thyrotoxicosis, characterized by sporadic episodes of muscle weakness with hypokalemia due to a massive intracellular shift in potassium ions (1). Therefore, TPP is known to be a channelopathy caused by mutations of the ion channel of the cell membrane and masked under euthyroid conditions. Although the episodes of muscle weakness are subsequently resolved by normalization of thyroid function, untreated TPP can cause paralysis of respiratory muscle or cardiac arrhythmia, leading to lethal conditions. An epidemiological survey revealed that TPP is a rare complication in Caucasians but more often affects young men of East Asian descent, such as Japanese (2) and Chinese men (3).
Ryan et al. (4) identified inwardly rectifying potassium (Kir) channel Kir2.6, encoded by KCNJ18 located in chromosome 17p11.2, which is expressed primarily in skeletal muscle to maintain excitability of the cell membrane, as a novel candidate gene for TPP. Thyroid hormone response cis elements (TREs), located in its promoter region, are considered to cause upregulation of Kir2.6 in patients with thyrotoxicosis. The entire coding region of KCNJ18 was sequenced and 10 mutations identified in 30 patients (33.3%) with TPP in the Caucasian and Brazilian populations (4). Some of these mutations showed electrophysiological evidence resulting in alteration of Kir2.6 currents either inherently or via a thyroid hormone–inducible mechanism and muscle membrane excitability, leading to paralysis (4). In contrast, such mutations were observed in only 5.7% (0.9% in Hong Kong and Thailand, 25.9% in Singapore) of Asian populations, suggesting that these mutations are not a major factor in the high prevalence of TPP in Asian populations. A genome-wide association study in the Chinese population identified an alternative susceptibility locus for TPP at chromosome 17q24.3, suggesting that a genetic variant other than KCNJ18 contributes to TPP susceptibility in Asian population (3). To clarify the possible contribution of KCNJ18 to ethnic differences in the prevalence of TPP between Asian and Caucasian populations, we sequenced KCNJ18 in Japanese patients with TPP and studied the association of variants in KCNJ18 with susceptibility to TPP and the difference in frequencies of disease-associated haplotypes between ethnic groups.
Participants and Methods
Participants
A total of 635 participants were studied (13 Japanese patients with TPP, 208 Japanese patients with Graves disease without TPP episodes, and 414 healthy control subjects in the Japanese population (n = 208), Korean population (n = 111) (provided by Prof. Inkyu Lee, Kyungpook National University School of Medicine, Korea), and Caucasian population (n = 95) (provided by Dr. Sunanda Babu, Barbara Davis Center for Childhood Diabetes, University of Colorado, Denver). This study was approved by the appropriate ethics committees, and informed consent was obtained from all participants.
Direct sequencing and genotyping of single-nucleotide variants (SNVs)
Because KCNJ18 shares >95% coding region identity with KCNJ12 and KCNJ17 (4), the entire coding region of the human KCNJ18 gene (KCNJ18, 1.47 kb, NM_001194958) was specifically amplified by PCR with a pair of primer sets (forward, ATGCTGTCCTCTCTGTTCC; reverse, GGGCCTCTCCCCGGCCA) as previously described (4). Refined PCR products were subjected to direct sequencing with an ABI PRISM Big Dye Terminator v3.1 Cycle Sequencing Kit (Applied Biosystems) and an ABI PRISM 3100 Genetic Analyzer (Applied Biosystems) and were subjected to nested PCR with three pairs of primers (ATGCTGTCCTCTCTGTTCC/CAAGGAAGGCCAGTGAGAAG for 116A>G, 119A>G, and 167A>C; TTCACCACCTGTGTGGACAT/GGATGTACTCGCCCTCCTC for 298G>A and 433G>A; CTGCATCATCGACTCCTTCA/GGTCTTGTGGAAGTGCGAGT for 745G>A) for genotyping of SNVs. Restriction fragment length polymorphism analysis was performed to genotype SNVs (TseI for 116A>G, HhaI for 119A>G, BsrDI for 167A>C, BsaHI for 298G>A, AluI for 433G>A, and BstNI for 745G>A; New England Biolab) of KCNJ18. The promoter region of KCNJ18, including thyroid hormone response cis elements, was amplified with a pair of primers (TCGTGGGACTTAATGGAGCC/CTGACTGGGGCCTGAAACT). A genetic variant is an alteration in the nucleotide sequence and is defined as polymorphism if it is a common variant. A common variant is typically defined as a variant with an allele frequency of ≥1%. We used the term variant rather than polymorphism in the present study because the variants in the susceptible haplotype are common in the Japanese population but not in the Caucasian population.
Statistics
Allele frequency was estimated by direct counting. The χ2 and Fisher exact probability test were applied to determine the significance of differences in the distribution of the number of subjects and alleles. Observed and expected genotype frequencies were compared by Hardy-Weinberg equilibrium via χ2 analysis. No significant deviation from equilibrium was observed in this study. Haplotypes were estimated by the expectation-maximization algorithm (Haploview version 4.2). The haplotype block was defined by CIs (5). Statistical significance was defined as P < 0.05.
Results
Clinical characteristics of patients with TPP
All 13 patients with TPP (11 men and 2 women) had Graves disease as the primary disease of thyrotoxicosis (Table 1). Mean age at onset of TPP was 33.7 ± 13.3 years (range, 21 to 57). Mean body mass index was 23.9 ± 5.6 kg/m2 (range, 15.1 to 33.6 kg/m2), and mean serum potassium concentration decreased to 2.1 ± 0.4 mEq/L (range, 1.6 to 3.2) at the onset of muscle weakness. All patients developed muscle weakness under the condition of thyrotoxicosis, and the symptom immediately disappeared after supplementation with potassium and treatment of Graves disease. Four patients had episodes of overeating before the onset of TPP (6). After thyroid function was restored, that is, under euthyroid conditions, potassium supplementation was not necessary for all patients to maintain the normal level of serum potassium concentration and muscle strength.
Clinical Characteristics of Patients With TPP
| Patient Number | Age at Onset, y | Sex | BMI, kg/m2 | SerumK, mEq/L | TSH, μIU/mL | Free T3, pg/mL | Free T4, ng/mL | Primary Disease | Trigger |
|---|---|---|---|---|---|---|---|---|---|
| 1 | 42 | Male | 19.4 | 2.2 | <0.01 | 15.6 | 6.3 | Graves disease | Overeating |
| 2 | 23 | Male | 23.7 | 1.8 | <0.01 | 13.2 | 7.6 | Graves disease | Unknown |
| 3 | 21 | Female | 30.6 | 1.8 | <0.01 | 7.1 | 3.6 | Graves disease | Overeating |
| 4 | 22 | Male | 22.1 | 2.2 | <0.01 | 5.1 | 2.4 | Graves disease | Unknown |
| 5 | 51 | Male | 30.4 | 1.6 | <0.01 | 10.0 | 2.5 | Graves disease | Overeating |
| 6 | 34 | Male | 26.3 | 1.8 | <0.01 | 13.5 | 3.0 | Graves disease | Overeating |
| 7 | 27 | Male | 22.2 | 2.1 | <0.01 | 8.6 | 2.3 | Graves disease | Unknown |
| 8 | 22 | Male | 17.3 | 3.2 | <0.01 | 4.7 | 1.4 | Graves disease | Unknown |
| 9 | 22 | Male | 18.4 | 1.8 | <0.01 | 13.5 | 3.0 | Graves disease | Unknown |
| 10 | 23 | Male | 15.1 | 2.1 | <0.01 | — | > 7.7 | Graves disease | Unknown |
| 11 | 47 | Male | 26.4 | 2.5 | <0.01 | 12.2 | 3.3 | Graves disease | Unknown |
| 12 | 47 | Male | 33.6 | 2.0 | <0.01 | 13.3 | 4.0 | Graves disease | Unknown |
| 13 | 57 | Female | 26.1 | 2.2 | <0.01 | 5.1 | 2.4 | Graves disease | Unknown |
Molecular scanning of KCNJ18 in Japanese patients with TPP
The entire coding regions of KCNJ18 in a total of 29 participants (13 patients with TPP, 8 patients with Graves disease without TPP, and 8 healthy controls) were sequenced. A total of six SNVs with amino acid substitution were identified: SNV1 (rs1371547709): 116A>G (R39Q); SNV2 (rs1267282483): 119A>G (R40H); SNV3 (rs1435508633): 167A>C (A56Q); SNV4 (rs1241343303): 298G>A (V100I); SNV5 (rs1295914926): 433G>A (G145S); and SNV6 (rs1182398045): 745G>A (I249V) (Table 2). R39Q, R40H, A56Q, V100I, and I249V have been previously reported (4), whereas G145S was identified in the current study. R39Q, R40H, A56Q, and I249V were located in the intracellular domain, V100I in the transmembrane domain, and G145S in the extracellular domain of Kir2.6 (Fig. 1). Among the 13 patients with TPP, all were homozygous for allele 1 (major allele in the Japanese population) of R39Q, R40H, A56Q, or I249V (Table 2, allele 1 frequency, 100.0%). The frequencies of allele 1 of these SNVs were significantly higher than in healthy control subjects (6), indicating that allele 1 of these SNVs was a risk allele for the development of TPP. The frequencies of allele 2 (a minor allele in Japanese population) of V100I were 3.8% in patients with TPP, 0.5% in patients with Graves disease without TPP (not significant vs TPP), and 0.5% in control subjects (not significant vs TPP) (6). G145S, a newly identified SNV, was observed in patients with TPP (7.7%), patients with Graves disease without TPP episodes (2.2%), and healthy controls (1.2%). Allele 2 frequencies of G145S in patients with TPP tended to be higher than in healthy control subjects (7.7 vs 1.2%, P = 0.06) (6). Previously reported mutations, such as T140M, Il44fs, R205H, T354M, K366R, R399X, and Q407X (4), were not observed in the current study. The promoter sequence of KCNJ18, including TREs, was also determined by direct sequencing, but no variant of the TREs was identified in the 13 participants with TPP.
Variants Identified in Sequencing of KCNJ18 in the Current Study and Their Genotypic Distribution in Participants With TPP, Participants With Graves Disease Without TPP, and Healthy Control Subjects
| TPP (n = 13) | Graves Diseasea (n = 8) | Control (n = 8) | |||||||||||||||||||||||||||||
|---|---|---|---|---|---|---|---|---|---|---|---|---|---|---|---|---|---|---|---|---|---|---|---|---|---|---|---|---|---|---|---|
| SNV | 1 | 2 | 3 | 4 | 5 | 6 | 7 | 8 | 9 | 10 | 11 | 12 | 13 | 1 | 2 | 3 | 4 | 5 | 6 | 7 | 8 | 1 | 2 | 3 | 4 | 5 | 6 | 7 | 8 | ||
| SNV1 | 116A>G | R39Q | 1/1 | 1/1 | 1/1 | 1/1 | 1/1 | 1/1 | 1/1 | 1/1 | 1/1 | 1/1 | 1/1 | 1/1 | 1/1 | 1/1 | 1/2 | 1/1 | 1/1 | 1/1 | 1/1 | 1/1 | 2/2 | 2/2 | 1/1 | 1/1 | 1/1 | 1/1 | 1/2 | 1/1 | 1/2 |
| SNV2 | 119A>G | R40H | 1/1 | 1/1 | 1/1 | 1/1 | 1/1 | 1/1 | 1/1 | 1/1 | 1/1 | 1/1 | 1/1 | 1/1 | 1/1 | 1/1 | 1/2 | 1/1 | 1/1 | 1/1 | 1/1 | 1/1 | 2/2 | 2/2 | 1/1 | 1/1 | 1/1 | 1/1 | 1/2 | 1/1 | 1/2 |
| SNV3 | 167A>C | A56Q | 1/1 | 1/1 | 1/1 | 1/1 | 1/1 | 1/1 | 1/1 | 1/1 | 1/1 | 1/1 | 1/1 | 1/1 | 1/1 | 1/1 | 1/2 | 1/1 | 1/1 | 1/1 | 1/1 | 1/1 | 2/2 | 2/2 | 1/1 | 1/1 | 1/1 | 1/1 | 1/2 | 1/1 | 1/2 |
| SNV4 | 298G>A | V100I | 1/1 | 1/1 | 1/1 | 1/2 | 1/1 | 1/1 | 1/1 | 1/1 | 1/1 | 1/1 | 1/1 | 1/1 | 1/1 | 1/1 | 1/1 | 1/1 | 1/1 | 1/1 | 1/1 | 1/1 | 1/1 | 1/1 | 1/1 | 1/1 | 1/1 | 1/1 | 1/1 | 1/1 | 1/1 |
| SNV5 | 433G>A | G145S | 1/1 | 1/2 | 1/1 | 1/1 | 1/1 | 1/1 | 1/1 | 1/1 | 1/1 | 1/1 | 1/1 | 1/1 | 1/2 | 1/2 | 1/1 | 1/1 | 1/1 | 1/1 | 1/1 | 1/1 | 1/1 | 1/1 | 1/1 | 1/1 | 1/1 | 1/1 | 1/1 | 1/1 | 1/1 |
| SNV6 | 745G>A | I249V | 1/1 | 1/1 | 1/1 | 1/1 | 1/1 | 1/1 | 1/1 | 1/1 | 1/1 | 1/1 | 1/1 | 1/1 | 1/1 | 1/1 | 1/2 | 1/1 | 1/1 | 1/1 | 1/1 | 1/1 | 2/2 | 2/2 | 1/1 | 1/1 | 1/1 | 1/1 | 1/2 | 1/1 | 1/2 |
Variant numbers: 1, major allele; 2, minor allele.
Graves disease without TPP episode.
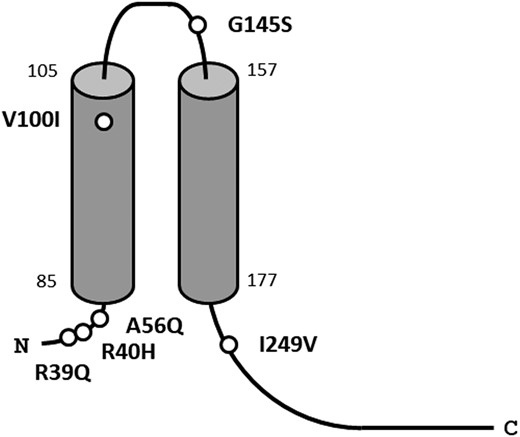
Position of SNVs in Kir2.6 encoded by KCNJ18. R39Q, R40H, A56Q, and I249V were located in the intracellular domain, V100I in the transmembrane domain, and G145S in the extracellular domain of Kir2.6.
Haplotype association study of KCNJ18 with TPP
Haplotype analysis with six SNVs revealed that four SNVs (SNV1, R39Q; SNV2, R40H; SNV3, A56Q; and SNV6, I249V) were in strong linkage disequilibrium (r2 = 0.81 to 1.0; Fig. 2), and constituted three haplotypes [haplotype 1, A-A-A-G (amino acid, R-R-A-I); haplotype 2, G-G-C-A (amino acid, Q-H-Q-V); and haplotype 3, G-A-A-G (amino acid, Q-R-A-I)] (Table 3). All patients with TPP were homozygous for haplotype 1, and the frequency of haplotype 1 in patients with TPP was significantly higher than that in healthy control subjects (100.0 vs 81.6%; OR = 19.6; 95% CI, 1.5 to 256.9; P = 0.013) (Table 3), indicating that haplotype 1 was susceptible to TPP. The frequency of haplotype 1 in patients with TPP was also significantly higher than that in patients with Graves disease without TPP episodes (100.0 vs 84.9%; OR = 15.5; 95% CI, 1.0 to 230.6; P = 0.032) (Table 3). In contrast, the frequency of haplotype 2 was lower in participants with TPP (0.0%) in comparison with healthy control subjects (15.5%; OR = 0.1; 95% CI, 0.0 to 0.9; P = 0.021), as well as patients with Graves disease without TPP episodes (13.0%; OR = 0.1; 95% CI, 1.0 to 1.3; P = 0.05), suggesting haplotype 2 as a protective haplotype.
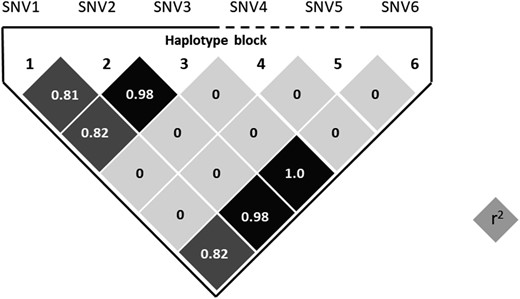
Linkage disequilibrium plot for the haplotype block constituted by six variants identified by direct sequencing of KCNJJ18. SNV1, SNV2, SNV3, and SNV6 were in strong linkage disequilibrium. Haplotypes were estimated by expectation-maximization algorithm (Haploview version 4.2) based on genotypes in Japanese controls (n = 208).
Haplotype Association Study of KCNJ18 With TPP in the Japanese Population
| TPP | Graves Diseasea | Control | TPP vs Control | TPP vs Graves Disease | |||||||
|---|---|---|---|---|---|---|---|---|---|---|---|
| SNV1-2-3-6 | n = 26 | % | n = 416 | % | n = 412 | % | OR (95% CI) | P | OR (95% CI) | P | |
| Haplotype 1 | A-A-A-G | 26 | 100.0 | 353 | 84.8 | 336 | 81.6 | 19.6 (1.5–256.9) | 0.013 | 15.5 (1.0–230.6) | 0.032 |
| Haplotype 2 | G-G-C-A | 0 | 0.0 | 54 | 13.0 | 64 | 15.5 | 0.1 (0.0–0.9) | 0.021 | 0.1 (0.0–1.3) | 0.05 |
| Haplotype 3 | G-A-A-G | 0 | 0.0 | 9 | 2.2 | 12 | 2.9 | — | NS | — | NS |
Abbreviation: NS, not significant, Fisher exact probability test.
Graves disease without TPP episode.
Marked differences in allele frequencies of variants in Asian and Caucasian populations
To see the difference in allele frequencies of SNVs between Asian and Caucasian populations, a total of 414 healthy control subjects in the Japanese, Korean, and Caucasian populations were genotyped (Table 4). Distribution of genotypes and allele 1 frequencies of all six SNVs were similar in the Japanese and Korean populations. Frequencies of risk alleles (allele 1) of R39Q, R40H, A56Q, and I249V in Asian populations (79.7% to 84.6% in the Japanese and Korean populations) were markedly higher than in the Caucasian population (48.4% to 50.5%; R39Q, P = 5.7 × 10⁻¹⁸; R40H, P = 1.6× 10⁻²⁰; A56Q, P = 1.9 × 10⁻¹⁹; I249V; P = 2.8 × 10⁻¹⁸) (Table 4). The allele 1 frequency of V100I in Asian populations was significantly higher than that in the Caucasian population (P = 0.018). The frequency of haplotype 1 in East Asian controls was significantly higher than that in the Caucasian controls (80.8 vs 48.4%, P = 1.1 × 10⁻²⁷) (Table 4).
Genotype, Allele Frequency, and Haplotype Frequency of KCNJ18 in East Asian and Caucasian General Populations
| Japanese (n = 208) | Korean (n = 111) | Caucasian (n = 95) | East Asian vs Caucasian | |||||||||||||||
|---|---|---|---|---|---|---|---|---|---|---|---|---|---|---|---|---|---|---|
| 1/1 | 1/2 | 2/2 | % | 1/1 | 1/2 | 2/2 | % | 1/1 | 1/2 | 2/2 | % | OR | 95% CI | P | ||||
| Allele frequency (allele 1) | ||||||||||||||||||
| SNV1 | 116A>G | R39Q | 141 | 59 | 8 | 82.0 | 74 | 29 | 8 | 79.7 | 25 | 42 | 28 | 48.4 | 4.6 | 3.3–6.5 | 5.7 × 10⁻¹⁸ | |
| SNV2 | 119A>G | R40H | 148 | 55 | 5 | 84.4 | 76 | 28 | 7 | 81.1 | 25 | 42 | 28 | 48.4 | 5.3 | 3.8–7.4 | 1.6 × 10⁻²⁰ | |
| SNV3 | 167A>C | A56Q | 147 | 54 | 5 | 84.5 | 76 | 28 | 7 | 81.1 | 26 | 42 | 27 | 49.5 | 5.1 | 3.6–7.1 | 1.9 × 10⁻¹⁹ | |
| SNV4 | 298G>A | V100I | 206 | 2 | 0 | 99.5 | 110 | 1 | 0 | 99.5 | 90 | 5 | 0 | 97.4 | 5.7 | 1.6–20.6 | 0.018 | |
| SNV5 | 433G>A | G145S | 203 | 5 | 0 | 98.8 | 111 | 0 | 0 | 100.0 | 95 | 0 | 0 | 100.0 | — | — | NS | |
| SNV6 | 745G>A | I249V | 149 | 54 | 5 | 84.6 | 75 | 29 | 7 | 80.6 | 27 | 42 | 26 | 50.5 | 4.9 | 3.5–6.8 | 2.8 × 10⁻¹⁸ | |
| Haplotype frequency, % | ||||||||||||||||||
| Haplotype 1 (A-A-A-G) | 81.6 | 79.3 | 48.4 | 4.7 | 3.4–6.6 | 1.1 × 10⁻²⁷ | ||||||||||||
| Haplotype 2 (G-G-C-A) | 15.5 | 18.9 | 50.5 | 0.2 | 0.1–0.3 | 5.7 × 10⁻³¹ | ||||||||||||
| Haplotype 3 (G-A-A-G) | 2.7 | 1.4 | 1.1 | 1.4 | 0.3–6.3 | NS | ||||||||||||
1, major allele; 2, minor allele; haplotype, SNV 1-2-3-6.
Abbreviation: NS, not significant, Fisher exact probability test.
Association of the KCNJ2-3′ region with susceptibility to TPP
A recent genome-wide association study in the Chinese Han population identified another locus linked to TPP susceptibility on chromosome 17q24.3 (rs312691 in the KCNJ2-3′ region) (3).The minor allele frequency (C allele, risk allele in reference 3) of rs312691 tended to be higher in patients with TPP (61.5%) than in healthy controls (44.5%, not significant vs TPP) or those with Graves disease without TPP episodes (45.2%, not significant vs TPP) (6) in the Japanese population, although the differences did not reach a statistically significant level. As for the ethnic differences in the risk allele frequencies in the general population, the allele frequency in Japanese controls (44.5%) was significantly higher than that in Korean controls (36.0%, P = 0.02 vs Japanese) or Caucasian control subjects (25.5%, P = 7.1 ×10⁻⁶ vs Japanese controls) (6).
Discussion
TPP is a multifactorial channelopathy triggered by environmental factors such as exercise, overeating, and alcohol intake in genetically susceptible people with thyrotoxicosis (7). Molecular scanning of KCNJ18 in the current study identified six SNVs with amino acid substitutions. Disease-associated mutations previously reported in Caucasian populations by Ryan et al. (4) were not observed in the Japanese population in the current study, indicating no evidence of a contribution of these KCNJ18 mutations to the development of TPP in the Japanese population. Of the six SNVs in the current study, four constituted three haplotypes, and a major haplotype (haplotype 1) was significantly associated with susceptibility to TPP in the Japanese population (P = 0.013 vs control, P = 0.032 vs Graves disease without TPP episodes). In addition, a marked difference in the frequencies of susceptible alleles and haplotype was observed between the East Asian and Caucasian populations (Table 4). Haplotype frequency in the Japanese population (haplotype 1, 81.6%) was comparable to that in the Korean population (79.3%) but much greater than that in the Caucasian population (48.4%) (Table 4), suggesting the contribution of KCNJ18 to the marked ethnic difference in prevalence of TPP between the East Asian and Caucasian populations.
According to the functional analysis of Kir2.6 by in vitro examination for potassium channels transfected into HEK293T cell line, no evidence of difference was observed in electrophysiological inwardly rectifying properties between two isotypes of Kir2.6 encoded by KCNJ18 haplotype 1 and haplotype 2 (8). Additional studies regarding the genetic causality of susceptible KCNJ18 haplotypes to TPP are therefore needed, such as variants modifying the promoter activity of KCNJ18 (9). Some variants were predicted to affect protein function and gene regulation in haplotype 1. A high PolyPhen-2 score (0.892, http://genetics.bwh.harvard.edu/pph2/) was observed for SNV1 (116A>G, R39Q), suggesting that the amino acid substitution may be damaging for protein function. SNV6 (745G>A, I249V) is located at the binding site for CTCF (CCCTC-binding factor) and transcriptional factors (FOXO1), suggesting that the variant might be causing dysregulation of the gene expression. SNV5 (433G>A, G145S), which is not included in haplotype 1, was a variant found in the Japanese population but not in the Korean or Caucasian populations in the current study. This amino acid substitution might also alter the function of Kir2.6 and might be specific to the Japanese population.
A genome-wide association study identified an alternative susceptibility locus for TPP on chromosome 17q24.3 in the vicinity of KCNJ2 in the Chinese Han population (3). In the current study, the risk allele frequency of KCNJ2 polymorphism (rs312691, C allele) tended to be higher in patients with TPP (61.5%) than in healthy control subjects (44.5%, P = 0.11 vs TPP) or those with Graves disease without a TPP episode (45.2%, P = 0.11 vs TPP) (6), indicating the possibility of association of the KCNJ2 region with susceptibility to TPP in the Japanese population. The reason that the difference did not reach statistical significance could be related to the small sample size of patients with TPP in the current study. The risk allele frequency has been reported to be 78.0% in patients with TPP (n = 69) and 45.0% in patients with Graves disease without a TPP episode (n = 775) in the Chinese population (3). A marked difference in risk allele (C allele) frequencies was also observed for KCNJ2 in the general populations, with the highest frequencies in the Chinese (3) and Japanese populations (45.0% and 44.5%, respectively), the second highest in the Korean population (36.0%, P = 0.02 vs the Japanese population), and the lowest in the Caucasian population (25.5%, P = 7.1 ×10⁻⁶ vs the Japanese population) (6), suggesting a distinct ethnic difference in the risk allele frequencies of KCNJ18 and KCNJ2 in the general populations. The present data may support the hypothesis that the KCNJ2 region also affects the high prevalence of TPP in the Japanese and Chinese populations, but the association of KCNJ2 with susceptibility to TPP, if any, did not reach statistical significance in the current study, suggesting the significance of KCNJ18 in the ethnic differences. The risk allele of rs312691 in KCNJ2-3′ (C allele) could affect the expression level of KCNJ2 as revealed by eQTL analysis (3), and both Kir2.6, encoded by KCNJ18, and Kir2.1, encoded by KCNJ2, are known to be highly expressed in skeletal muscle and form heterodimers (10), suggesting a possible link between them and the development of TPP. Of 13 participants with TPP who possessed a susceptible KCNJ18 haplotype, those with the rs312691 CC genotype in KCNJ2-3′ showed a negative correlation between serum potassium concentration and FT4 levels (R = −0.70), although no correlation was observed in participants with the CT or TT genotype (P < 0.03, CC vs CC or TT genotype, analysis of covariance) (6), suggesting a possible interaction between the susceptible KCNJ18 haplotype and the risk allele of KCNJ2-3′ on the development of TPP.
In conclusion, a major haplotype of KCNJ18 in East Asian populations is significantly associated with susceptibility to TPP in the Japanese population. Frequency of the disease-associated haplotype was markedly higher in East Asian than in Caucasian populations, suggesting a contribution of the KCNJ18 haplotype to the high prevalence of TPP in East Asian populations.
Acknowledgments
We thank Ms. Shie Hayase, Ms. Mariko Shiota, and Ms. Youko Yamano for their skillful technical assistance, Inkyu Lee and Sunanda Babu for kindly providing DNA samples and data, and Kazuyoshi Hosomichi for helpful discussion.
Financial Support: This study was supported in part by Grants-in-Aid for Scientific Research (C) from the Ministry of Education, Science, Sports, Culture, and Technology of Japan (S.N., N.B., and H. Ikegami) and a grant from the Osaka Medical Research Foundation for Incurable Diseases (H. Ito).
Author Contributions: All authors contributed to collection of samples and data. S.N. designed the study, analyzed the data, and wrote the manuscript. H. Ikegami reviewed the manuscript and directed the overall project.
Additional Information
Disclosure Summary: The authors have nothing to disclose.
Data Availability: The datasets generated during and/or analyzed during the current study are not publicly available but are available from the corresponding author on reasonable request.
Abbreviations:
- SNV
single-nucleotide variant
- TPP
thyrotoxic periodic paralysis
- TRE
thyroid hormone response cis element
