


Abstract
Subclinical and clinical complications emerge early in type 1 diabetes (T1D) and may be associated with obesity and hyperglycemia.
Test how longitudinal “weight-glycemia” phenotypes increase susceptibility to different patterns of early/subclinical complications among youth with T1D.
SEARCH for Diabetes in Youth observational study.
Population-based cohort.
Youth with T1D (n = 570) diagnosed 2002 to 2006 or 2008.
Participants were clustered based on longitudinal body mass index z score and HbA1c from a baseline visit and 5+ year follow-up visit (mean diabetes duration: 1.4 ± 0.4 years and 8.2 ± 1.9 years, respectively). Logistic regression modeling tested cluster associations with seven early/subclinical diabetes complications at follow-up, adjusting for sex, race/ethnicity, age, and duration.
Four longitudinal weight-glycemia clusters were identified: The Referent Cluster (n = 195, 34.3%), the Hyperglycemia Only Cluster (n = 53, 9.3%), the Elevated Weight Only Cluster (n = 206, 36.1%), and the Elevated Weight With Increasing Hyperglycemia (EWH) Cluster (n = 115, 20.2%). Compared with the Referent Cluster, the Hyperglycemia Only Cluster had elevated odds of dyslipidemia [adjusted odds ratio (aOR) 2.22, 95% CI: 1.15 to 4.29], retinopathy (aOR 9.98, 95% CI: 2.49 to 40.0), and diabetic kidney disease (DKD) (aOR 4.16, 95% CI: 1.37 to 12.62). The EWH Cluster had elevated odds of hypertension (aOR 2.18, 95% CI: 1.19 to 4.00), dyslipidemia (aOR 2.36, 95% CI: 1.41 to 3.95), arterial stiffness (aOR 2.46, 95% CI: 1.09 to 5.53), retinopathy (aOR 5.11, 95% CI: 1.34 to 19.46), and DKD (aOR 3.43, 95% CI: 1.29 to 9.11).
Weight-glycemia phenotypes show different patterns of complications, particularly markers of subclinical macrovascular disease, even in the first decade of T1D.
Subclinical and clinical complications emerge early in type 1 diabetes (1). In youth and adolescents, multiple studies have shown that the risk for these outcomes is associated with glycemic control as measured by HbA1c (1–3). However, the rising prevalence of overweight and obesity is a recently emerging problem in the clinical care of type 1 diabetes (4–6). Studies suggest that obesity in the setting of type 1 diabetes can contribute to adverse cardiovascular disease (CVD) outcomes and microvascular complications in adults with long-standing diabetes (7–9).
There are gaps in the current understanding of how excess adiposity and degrees of suboptimal glycemic control jointly contribute to the emergence of early and subclinical diabetes complications, including both macrovascular and microvascular outcomes, among youth and young adults in the first decade of having diabetes. This information is critical given shifts in the epidemiology of overweight and obesity within this patient population and the potential for intensive insulin therapy to induce weight gain (10), which may warrant a more flexible and integrated clinical approach that considers both weight and glycemic control for identifiable patient subgroups.
Although the association between weight status and glycemic control among youth and adolescents have been studied in the first few years of disease (11, 12), few studies have characterized the coevolution of these outcomes over a longer disease duration, and particularly outside of the partial remission, or “honeymoon” period, when blood glucose management is particularly challenging (13). Therefore, we employed a data-driven approach to capture the major patterns of longitudinal exposure of both weight status and glycemic control. The first objective of this study was to identify the main longitudinal “weight-glycemia” phenotypes of established type 1 diabetes, or clusters of youth and young adults with type 1 diabetes showing similar weight status and glycemic control measures collected at two time-points: a baseline > 1 year after diabetes onset and a follow-up visit at a mean of 8 years disease duration. The second objective was to test how the longitudinal weight-glycemia phenotypes of type 1 diabetes were associated with different subclinical and early complications, or combinations thereof, measured at the follow-up visit.
Materials and Methods
Participants
Individuals diagnosed with diabetes before 20 years of age were identified by the SEARCH for Diabetes in Youth study through a population-based registry network at five sites in the United States (South Carolina; Cincinnati, Ohio, and surrounding counties; Colorado, with southwestern American Indian sites; Seattle, Washington, and surrounding counties; and Kaiser Permanente, Southern California membership in seven counties). Individuals who received a new diagnosis of type 1 diabetes (T1D) in 2002 to 2006 or 2008 were invited to complete a baseline SEARCH visit to measure risk factors for diabetes complications. In 2011 to 2015, participants with ≥ 5 years diabetes duration who had previously completed a baseline visit were invited to participate in a follow-up visit, at which diabetes risk factors and early diabetes-related complications and comorbidities were assessed. The distribution of demographic, metabolic, and socioeconomic characteristics of participants who completed the follow-up visit were similar to that of the larger SEARCH registry population (1). The study was approved by institutional review boards with jurisdiction, and the parent, adolescent or young adult, or both provided consent or assent for all participants.
Inclusion criteria for the present analysis consisted of incident cases of type 1 diabetes between 2002 and 2006 and 2008 who attended the SEARCH baseline and follow-up “cohort” visit (n = 2869). Diabetes type was based on an etiological classification using diabetes autoantibodies (DAAs) or estimated insulin sensitivity score (euglycemic clamp-validated equation including waist circumference, HbA1c, and triglyceride levels) measured at the baseline visit (14). Youth included were those who were DAA positive and insulin sensitive, DAA positive and insulin resistant, DAA negative and insulin sensitive, DAA unknown and insulin sensitive, and DAA positive and unknown insulin sensitivity status. Participants were excluded if they were missing measures of body mass index z score (BMIz) or HbA1c at the baseline or follow-up visit (n = 1106) or if the baseline visit occurred < 12 months after a T1D diagnosis (n = 1193) to remove noninformative variability or within-person instability in baselines measure that may occur in the first year following diagnosis (Fig. 1). The latter exclusion cut-off was selected to ensure participants were not in partial remission, or the “honeymoon period,” at their baseline visit based on data showing that more than one-half and one-third of youth > 5 years are classified as being in remission at 3 and 6 months, respectively, based on insulin needs (U/kg/dose) (15) as well as longitudinal patterns in HbA1c, insulin dose, and C-peptide levels in the first 12 months of disease (16). Compared with individuals included in the analysis, excluded participants showed a lower mean age, HbA1c, and pump use at baseline (P < 0.05), with no important differences in BMIz or age at diagnosis. There were also no substantial differences in age, BMIz, or HbA1c between these groups at the follow-up visit.
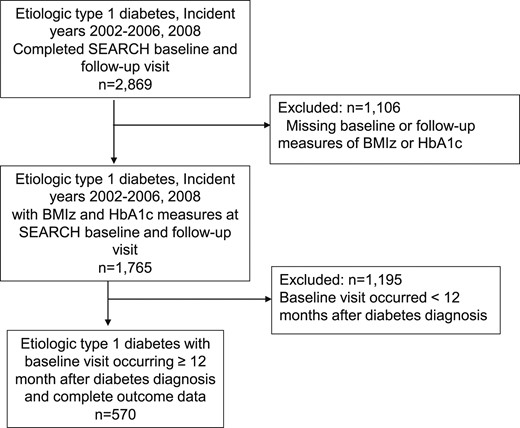
Participant flow diagram.
Research visits
Trained, certified research staff administered questionnaires, made measurements, and obtained blood samples at the in-person baseline and follow-up research visits in accordance with standardized study protocols (available at www.searchfordiabetes.org). Participants (or parents, for younger participants) self-reported date of birth, sex, race, ethnicity, highest parental education, annual household income, and type of health insurance. For reporting of race and ethnicity, US census methods (17) were used that provided a series of fixed race and ethnicity categories as well as an “other” option for the self-report by parent or participant, depending on age. These were further categorized into “non-Hispanic white” and “minority” racial/ethnic groups, including Hispanic (regardless of race), non-Hispanic black, American Indian, Asian/Pacific Islander, and other/multiple race/ethnicities. Education and income were self-reported. Highest education by either parent was classified as less than high school degree, high school graduate, some college through associate degree, and bachelor’s degree or more. Annual household income was classified as >$75,000, $50,000 to 75,000, $25,000 to 49,999, and <$25,000. Date of diagnosis obtained from medical records was used to calculate age of diagnosis and diabetes duration at both visits. BMI was defined as weight (kg) divided by height (m2) and converted to a z score (18). Weight status was classified as underweight (mean BMIz less than −1.64), normal weight (mean BMIz −1.64 to <1.04), overweight (mean BMIz 1.04 to <1.64), and obesity (mean BMIz ≥1.64), corresponding to <5th, 5 to <85th, 85th to <95th, and ≥95th percentile for age and sex, respectively (19). Waist circumference used the National Health and Nutrition Examination Survey protocol and was used to calculate waist-to-height ratio (20). A blood draw occurred after an 8-hour overnight fast, and medications, including short-acting insulin, were withheld the morning of the visit. Blood samples were obtained and analyzed for HbA1c, glucose, lipids, creatinine, and cystatin C at the central laboratory using established protocols (Northwest Lipid Metabolism and Diabetes Research, Seattle, WA). Samples were shipped from clinical centers to the central laboratory. HbA1c was measured in whole blood with an automated nonporous ion-exchange high-performance liquid chromatography system (model G-7; Tosoh Bioscience, Montgomeryville, PA).
Outcome measures
The main outcomes for the study included seven early or subclinical diabetes complications measured at the follow-up visit. Definitions of outcomes complications were consistent with previous SEARCH studies (1, 21, 22).
For the outcome of hypertension, the mean of three systolic and diastolic blood pressure levels was obtained using an aneroid manometer after at least 5 minutes of rest. Hypertension was defined based on 2017 American Academy of Pediatrics Clinical Practice Guidelines (23) as blood pressure ≥130/80 mm Hg or ≥95th percentile for ages <13 years or the use of antihypertensive medication. The outcome of dyslipidemia was defined to be consistent with previous SEARCH studies (21) following recommendations for children with type 1 diabetes (24, 25) and included high-density lipoproteins (HDLs) dyslipidemia (HDL <35 mg/dL) and non-HDL dyslipidemia (computed as total cholesterol − HDL-cholesterol >130 mg/dL), or use of a lipid-lowering medication. Arterial stiffness was measured with the SphygmoCor-Vx device (AtCor Medical, Lisle, IL) and defined as a carotid-femoral pulse wave velocity ≥90th percentile compared with control participants of the SEARCH CVD ancillary study (26). Diabetic retinopathy was assessed with 45° color digital fundus images taken with a nonmydriatic camera (Visucam Pro N, Carl Zeiss Meditech, Dublin, CA) and centered on the disc and macula of both eyes. Photos masked to all clinical characteristics were graded by the Wisconsin Ocular Epidemiology Reading Center. Diabetic retinopathy was defined as mild, moderate, or proliferative retinopathy in at least one eye (27). Diabetic kidney disease (DKD) was defined as the presence of microalbuminuria (urine albumin-to-creatinine ratio ≥30 μg/mg of creatinine) or low glomerular filtration rate (<60 mL/min/1·73 m2 as estimated by the CKD-EPI creatinine equation using serum creatinine and cystatin C) (28). Peripheral neuropathy was defined as a score >2 on the Michigan Neuropathy Screening Instrument (29). Cardiovascular autonomic neuropathy was assessed by heart rate variability using the SphygmoCor-Vx device (AtCor Medical). Electrocardiographic R-R intervals measured in a supine position were used to estimate five heart rate variability indices: the SD of the intervals, root mean square differences of successive intervals, normalized high-frequency power, normalized low-frequency power, and the low-to-high frequency ratio. Cardiovascular autonomic neuropathy was defined as abnormalities in three or more of the five indices, based on ≤5th or ≥95th percentile (as appropriate) observed in age- and sex-matched control participants of the SEARCH CVD study (26).
Other measures
Participants reported insulin regimen, classified as the use of an insulin pump vs any combination of multiple daily injection. Self-reported frequency of self-monitoring of blood glucose was categorized as <1, 1 to 3, and >3 times per day. History of severe hypoglycemia (defined as any episode requiring the help of another person) or diabetic ketoacidosis in the past 6 months were self-reported. Disordered eating behaviors was assessed with the Diabetes Eating Problem Survey Revised (DEPS-R) (30) at the follow-up visit. The DEPS-R survey assesses behaviors such as skipping insulin or keeping blood sugars high to lose weight as well as feelings toward the relative priorities of losing weight and taking care of one’s diabetes. Higher scores indicate increased disordered eating behaviors, with a cut-off score of 20 or higher recommended for further clinical evaluation for disordered eating behaviors (31). To directly address insulin omission as a strategy to manage weight gain, affirmative responses from Item 17 (i.e., answered “yes” in response to the question, “I take less insulin than I should”) from the DEPS-R were also individually analyzed and presented.
Statistical methods
Participants were clustering using k-means clustering for joint longitudinal data applied to BMIz and HbA1c values from baseline and follow-up to derive clusters of homogenous subgroups within a larger heterogeneous population (32, 33). Data from the interim follow-up visits (i.e., the 12-, 24-, and 60-month follow-up examinations) were not used due to variable degrees of sparsity. In this procedure, participants who are homogenous in their BMIz and HbA1c measures at both time-points are clustered together. BMIz and HbA1c measures were first normalized, and participants were clustered using the KmL3D package (34) in R using Euclidean distance. Briefly, k-means is an expectation-maximization algorithm: the center of each cluster is determined as the mean of data points within the cluster in the expectation step, then data points are reassigned to the nearest cluster center in the maximization step. These two steps are repeated until the clusters no longer change. Any number of methods can be used to provide the starting cluster assignments thereby initializing the process; the kml3d procedure alternates through different initialization methods and chooses the partition with the most stability (34). To obtain optimal solutions, we estimated cluster solutions 100 times each for between four- and nine-cluster solutions, exploring this as the literature suggests there are multiple longitudinal patterns of weight and glycemia, but we do not know how many accurately represents the major phenotypes (32). The Calinski-Harabasz criterion (35) was used to evaluate the various trajectory solutions and identify the optimal number of weight-glycemia longitudinal clusters. The Calinski Criterion is a relative metric that measures the ratio of the between-group variance relative to the within-group variance. The optimal clustering solution maximizes this ratio, representing the most compact and well-separated clusters (32, 33, 35).
Clusters were named based on primary exposure to elevated weight (i.e., elevated BMIz) or hyperglycemia (i.e., elevated HbA1c) at both time-points, relative to each other. The cluster with BMIz and HbA1c measures closest to clinical targets was selected as the Referent Cluster (13). This method of cluster nomenclature was selected to facilitate cluster-level phenotypic interpretation and comparisons thereof.
Cluster characteristics and associations with outcomes
The proportion of early or subclinical diabetes complications, sociodemographic characteristics, and clinical care correlates of each cluster were summarized using descriptive statistics. Overall tests of independence across clusters were carried out using ANOVA for continuous features and χ2 tests for categorical features. Typically, Fisher’s exact tests would be used to obtain the exact hypergeometric distribution for a 2 × 2 contingency table with low counts. However, because our tables have four rows (for four clusters), obtaining the exact distribution is computationally intensive. Therefore, we use a χ2 test where the distribution is approximated using the Monte Carlo method with 9999 random samples. In each sample, the feature categories are permuted, and the test statistic is computed (36). We accounted for multiple comparisons in the overall tests of difference using Bonferroni adjustment. If the overall test of difference was statistically significant, pairwise comparisons were performed for all clusters against the Referent Cluster.
Logistic regression modeling was used to test how each weight-glycemia subgroup was associated with early or subclinical diabetes complications. Each outcome was modeled independently as a binary outcome, adjusting for minimum confounders: sex, race/ethnicity (non-Hispanic white vs all others), age, and diabetes duration at follow-up. Small cell sizes prohibited extensive adjustment models. An additional model tested the association of the clusters with the probability of having two or more early or subclinical complications.
All P-values were evaluated at the 0.05 significance level. Data analyses were performed using the statistical analysis software package R version 3.4.1 and SAS 9.4 (SAS Institute, Cary, NC).
Results
The final sample included 570 youth with established T1D, 53.5% female and 70.9% non-Hispanic white race/ethnicity, with mean age at diagnosis of 9.7 ± 4.1 years and mean age at follow-up of 17.9 ± 4.6 years. The baseline visit and follow-up visit occurred at approximately 1.4 ± 0.4 years and 8.2 ± 1.9 years after diabetes diagnosis, respectively.
Four longitudinal weight-glycemia clusters were identified over a mean of 8 years disease duration (Fig. 2; Table 1). The Referent Cluster (n = 195, 34.3%) showed stable low BMIz and fair glycemic control at both time points. The Hyperglycemia Only Cluster (n = 53, 9.3%) showed low BMIz with stable high HbA1c at both time points, where mean HbA1c was 10.8% ± 1.9% (93 ± 21 mmol/mol) at baseline and 11.4% ± 1.9% (100 ± 20 mmol/mol) at follow-up. The Elevated Weight Only Cluster (n = 206, 36.1%) showed elevated BMIz, with only 48.5% and 36.9% of individuals being classified as normal weight at baseline and follow-up, respectively, and moderate HbA1c levels at both time points [HbA1c of 7.6% ± 1.1% (60 ± 12 mmol/mol) and 8.1% ± 1.0% (65 ± 11 mmol/mol) at baseline and follow-up, respectively]. The Elevated Weight with Increasing Hyperglycemia Cluster (n = 115, 20.2%) showed high BMIz at both time points, with only approximately 30% to 32% of individual being classified as normal weight across time, and with increasing HbA1c over time [mean HbA1c 8.4% ± 1.5% (67 ± 15 mmol/mol) and 11.2% ± 1.4% (99 ± 15 mmol/mol) at baseline and follow-up, respectively]. A three-dimensional, interaction plot of the longitudinal weight-glycemia clusters is shown in the data repository (37).
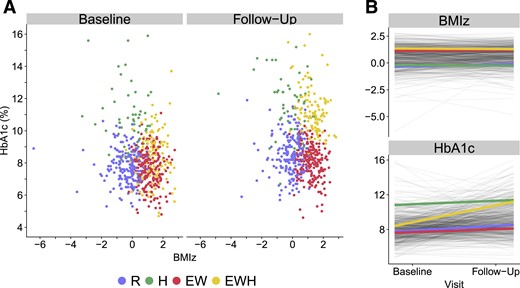
Longitudinal weight glycemia phenotypes in the SEARCH for Diabetes in Youth Study. Clusters were derived from baseline and follow-up measures of BMIz and HbA1c over a mean of 8.2 y. Clusters were named based on their main exposure, where high HbA1c is denoted by “Hyperglycemia” (H) and elevated BMIz is denoted by “Adiposity” (A). Four clusters were identified: The Referent Cluster (n = 195, 34.2%), the Hyperglycemia Only Cluster (n = 53, 9.3%), the Elevated Weight Only Cluster (n = 206, 36.1%), and the Elevated Weight with Increasing Hyperglycemia Cluster (n = 116, 20.4%). (A) Scatter plot of BMIz and HbA1c, colored by cluster, at both time points. (B) Cluster trajectories of BMIz and HbA1c between baseline and follow-up visit. EW, Elevated Weight Only Cluster; EWH, Elevated Weight with Increasing Hyperglycemia Cluster; H, Hyperglycemia Only Cluster; R, Referent Cluster.
Weight and Glycemia at the Baseline and Follow-Up Visit Across the Longitudinal Weight-Glycemia Phenotypes of Established TD1
| All, N = 570 | Referent (R) Cluster, n = 195 (34.2) | Hyperglycemia Only Cluster, n = 53 (9.3) | Elevated Weight Only Cluster, n = 206 (36.1) | Elevated Weight and Increasing Hyperglycemia Cluster, n = 116 (20.4) | P Value | |
|---|---|---|---|---|---|---|
| Low BMIz and Moderate HbA1c | Low BMIz, Stable High HbA1c | Stable High BMIz and Moderate HbA1c | High BMIz and Increasing HbA1c | |||
| Baseline | ||||||
| Weight and glycemia, mean (SD) | ||||||
| BMIz | 0.54 (1.07) | −0.36 (0.85) | −0.21 (1.02) | 1.12 (0.59)a | 1.36 (0.67)a | <0.0001 |
| HbA1c | 8.1 (1.6) | 7.8 (1.0) | 10.8 (1.9)a | 7.6 (1.1) | 8.4 (1.5)a | <0.0001 |
| Weight status, n (%)b | <0.0001 | |||||
| Underweight | 15 (2.6) | 10 (5.2) | 5 (9.4) | 0 (0.0)a | 0 (0.0)a | |
| Normal weight | 364 (63.9) | 183 (93.9) | 46 (86.8) | 100 (48.5)a | 35 (30.2)a | |
| Overweight | 110 (19.3) | 2 (1.0) | 2 (3.8) | 63 (30.6)a | 43 (37.1)a | |
| Obesity | 80 (14.2) | 0 (0.0) | 0 (0.0) | 43 (20.8)a | 38 (32.8)a | |
| Glycemic control, n (%)c | <0.0001 | |||||
| Adequate | 192 (33.7) | 72 (36.9) | 1 (1.9)a | 89 (43.2) | 30 (25.9)a | |
| Fair | 244 (42.8) | 103 (52.8) | 7 (13.2)a | 93 (45.2) | 41 (35.3)a | |
| Poor | 121 (21.2) | 20 (10.2) | 33 (62.3)a | 24 (11.7) | 44 (37.9)a | |
| Very poor | 13 (2.3) | 0 (0.0) | 12 (22.6)a | 0 (0.0) | 1 (0.9)a | |
| Follow-up visit | ||||||
| Weight and glycemia, mean (SD) | ||||||
| BMIz | 0.64 (0.97) | −0.11 (0.72) | −0.27 (1.07) | 1.21 (0.54)a | 1.30 (0.61)a | <0.0001 |
| HbA1c | 9.2 (1.9) | 8.5 (1.2) | 11.4 (1.9)a | 8.1 (1.0)d | 11.2 (1.4)a | <0.0001 |
| Weight status, n (%)b | <0.0001 | |||||
| Underweight | 11 (1.9) | 7 (3.6) | 4 (7.6) | 0 (0.0)a | 0 (0.0)a | |
| Normal weight | 344 (60.4) | 185 (94.9) | 46 (86.8) | 76 (36.9)a | 37 (31.9)a | |
| Overweight | 139 (24.4) | 3 (1.5) | 3 (5.7) | 85 (41.3)a | 48 (41.4)a | |
| Obesity | 76 (13.3) | 0 (0.0) | 0 (0.0) | 45 (21.8)a | 31 (26.7)a | |
| Glycemic control, n (%)c | <0.0001 | |||||
| Adequate | 85 (14.9) | 36 (18.5) | 1 (1.9)a | 48 (23.3)d | 0 (0.0)a | |
| Fair | 213 (37.4) | 90 (46.2) | 4 (7.6)a | 117 (56.8)d | 2 (1.7)a | |
| Poor | 225 (39.5) | 69 (35.4) | 26 (49.1)a | 41 (19.9)d | 89 (76.7)a | |
| Very poor | 47 (8.3) | 0 (0.0) | 22 (41.5)a | 0 (0.0)d | 25 (21.6)a |
Data are mean ± SD (continuous), or n (%) (categorical). Overall P values are from χ2, Fisher exact tests and ANOVA, as appropriate. Bonferroni correction was applied. Pairwise comparisons were performed for significant variables using the Referent Cluster as the referent group.
Pairwise P < 0.05.
Weight status defined based on BMIz. Underweight was defined as BMIz less than −1.64 corresponding to the 5th percentile for age and sex. Normal weight was defined as BMIz at least −1.64 and < 1.04, corresponding to ≥ 5th and < 85th percentile for age and sex. Overweight was defined as BMIz ≥ 1.04 and < 1.64, corresponding to ≥ 85th percentile and < 95th percentile for age and sex. Obesity was defined as BMIz ≥ 1.64 corresponding to ≥ 95th percentile for age and sex.
Glycemic control: adequate [HbA1c < 58 mmol/mol (7.5%)], fair [HbA1c ≥ 58 and < 75 mmol/mol (≥ 7.5 and < 9.0%)]; poor [HbA1c ≥ 75 and < 108 mmol/mol (≥9.0% and <12.0%)]; very poor [HbA1c > 108 mmol/mol (≥12.0%)].
Pairwise P < 0.0001.
The longitudinal weight-glycemia clusters showed significant differences in sociodemographic characteristics and aspects of type 1 diabetes clinical care (Table 2). Compared with the Referent Cluster, the Hyperglycemia Only Cluster and the Elevated Weight with Increasing Hyperglycemia Cluster comprised a significantly lower proportion of non-Hispanic white youth and reported lower levels of parental education, household income, and use of private health insurance (all P < 0.05). These clusters also had a lower proportion of pump users and individuals who checked glucose levels four or more times per day (all P < 0.05). There were no significant differences in sex, age, or diabetes duration at follow-up. Finally, there were significant differences in self-reported eating behaviors. The Elevated Weight with Increasing Hyperglycemia Cluster was associated with greater disordered eating behaviors at the follow-up visit, including the highest prevalence of self-reported insulin omission (35.9% compared with 15.1% in the Reference Cluster; Table 2).
Early or Subclinical Diabetes Complications, Sociodemographic Characteristics, and Aspects of T1D and Its Clinical Care at the Follow-Up Visit Across the Longitudinal Weight-Glycemia Phenotypes of Established T1D
| All, N = 570 | Referent (R) Cluster, n = 195 (34.2) | Hyperglycemia Only Cluster, n = 53 (9.3) | Elevated Weight Only Cluster, n = 206 (36.1) | Elevated Weight Elevated Weight With Increasing Hyperglycemia Cluster, n = 116 (20.4) | P Value | |
|---|---|---|---|---|---|---|
| Low BMIz and Moderate HbA1c | Low BMIz, Stable High HbA1c | Stable High BMIz and Moderate HbA1c | High BMIz and Increasing HbA1c | |||
| Early or subclinical diabetes complications, n (%)a | ||||||
| Hypertension | 111 (19.5) | 29 (14.9) | 5 (9.6) | 44 (21.4) | 33 (28.5) | 0.231 |
| Dyslipidemia | 180 (31.6) | 46 (23.6) | 23 (43.4)b | 59 (28.7) | 52 (44.8)c | 0.003 |
| Arterial stiffness | 54 (10.1) | 15 (8.1) | 3 (6.0) | 18 (9.5) | 18 (16.5) | 1.000 |
| Retinopathy | 22 (4.0) | 4 (2.1) | 8 (15.1)b | 2 (1.0) | 8 (7.3)b | <0.0001 |
| DKD | 35 (6.9) | 7 (4.0) | 8 (15.7)b | 6 (3.3) | 14 (13.5)b | 0.018 |
| Peripheral neuropathy | 35 (6.2) | 10 (5.2) | 3 (5.7) | 14 (6.9) | 8 (7.0) | 1.000 |
| Cardiovascular autonomic neuropathy | 63 (12.1) | 24 (13.6) | 9 (18.4) | 21 (11.2) | 9 (8.3) | 1.000 |
| Total number of early or subclinical diabetes complications, mean (SD) | 0.9 (0.9) | 0.7 (0.8) | 1.1 (1.0)b | 0.8 (0.9) | 1.2 (1.1)c | <0.0001 |
| Sociodemographic characteristics | ||||||
| Female (n) | 305 (53.5) | 94 (48.2) | 27 (50.9) | 107 (51.9) | 77 (66.4)b | 0.582 |
| Non-Hispanic white (n) | 404 (70.9) | 161 (82.6) | 27 (50.9)c | 154 (74.6)b | 62 (53.5)c | <0.0001 |
| Age at visit (y) | 17.9 (4.6) | 18.0 (4.7) | 18.9 (4.8) | 17.5 (4.9) | 18.0 (3.8) | 1.000 |
| Parental education of college graduate or higher | 264 (46.4) | 115 (59.0) | 15 (28.3)c | 98 (47.6)b | 36 (31.0)c | <0.0001 |
| Annual household income > $75,000 | 202 (35.4) | 83 (42.6) | 9 (17.0)b | 85 (41.6) | 25 (21.6)b | <0.0001 |
| Private health insurance | 391 (68.6) | 144 (73.8) | 26 (49.1)b | 154 (74.8) | 67 (57.8)b | 0.003 |
| Additional anthropometric characteristics | ||||||
| Waist circumference (cm) | 77.9 (12.9) | 70.9 (7.9) | 72.0 (8.4) | 81.5 (13.1)c | 85.8 (14.2)c | <0.0001 |
| Waist-to-height ratio | 0.47 (0.07) | 0.42 (0.03) | 0.44 (0.04)b | 0.50 (0.06)c | 0.52 (0.08)c | <0.0001 |
| Aspects of T1D and its clinical care | ||||||
| Diabetes duration (y) | 8.2 (1.9) | 8.2 (2.0) | 8.2 (1.8) | 8.1 (2.0) | 8.3 (2.0) | 1.000 |
| Insulin dose (units/kg) | 0.85 (0.43) | 0.89 (0.54) | 0.88 (0.48) | 0.79 (0.30) | 0.88 (0.39) | 1.000 |
| Insulin pump (vs multiple daily injection) | 304 (53.3) | 125 (64.0) | 16 (30.3)c | 121 (58.7) | 42 (36.2)c | <0.0001 |
| Frequency of self-monitoring of blood glucose > 4 times per day | 446 (78.3) | 160 (82.1) | 33 (62.3)b | 172 (83.5) | 81 (69.8)b | 0.009 |
| Disordered eating behaviors [DEPS-R Sum Score, meanf (SD)] | 13.4 (10.7) | 10.4 (8.0) | 14.0 (10.4) | 11.4 (8.8) | 21.7 (13.5) | <0.0001 |
| Endorsed insulin omission to avoid weight gain, n (%)d | 95 (18.3) | 27 (15.1) | 15 (29.4) | 15 (8.2) | 38 (35.9) | <0.0001 |
| Acute complicationse | ||||||
| 1+ Severe hypoglycemic episode | 43 (7.6) | 12 (6.2) | 5 (9.6) | 19 (9.2) | 7 (6.0) | 1.000 |
| 1+ Diabetic ketoacidosis episode | 109 (19.2) | 28 (14.4) | 14 (26.9) | 34 (16.5) | 33 (28.5) | 0.189 |
Data are mean ± SD (continuous) or n (%) (categorical). Overall P values from χ2, Fisher exact tests and ANOVA, as appropriate. Bonferroni correction was applied. Pairwise comparisons were performed for significant variables using the Referent Cluster as the referent group. Bolded text denotes statistical significance.
Outcomes defined as follows: Hypertension defined based on the American Academy of Pediatrics Clinical Practice Guidelines, Fifth Report as of 2017 (23): Stage 1 or 2 hypertension (blood pressure ≥ 130/80 mm Hg or ≥ 95th percentile for ages < 13 years) or the use of antihypertensive medication. Dyslipidemia includes HDL and non-HDL dyslipidemia [non–HDL-cholesterol (computed as total cholesterol − HDL-cholesterol): > 130 mg/dL OR HDL-cholesterol: < 35 mg/dL] or use of lipid-lowering medication. Arterial stiffness was measured with the SphygmoCor-Vx device and defined as a carotid-femoral pulse wave velocity >90th percentile compared with control participants of the SEARCH CVD study. Diabetic retinopathy was based on digital fundus images and defined as mild, moderate, or proliferative retinopathy in at least one eye. DKD was defined as the presence of albuminuria (>30 μg/mg of creatinine) or low glomerular filtration rate (<60 mL/min/1·73 m2 as estimated by the CKD-EPI equations with serum creatinine and cystatin C). Peripheral neuropathy was defined as a score >2 on the Michigan Neuropathy Screening Instrument. Cardiovascular autonomic neuropathy was assessed by heart rate variability using the SphygmoCor-Vx device; cardiovascular autonomic neuropathy was defined as abnormalities in three or more of the five indices, based on <5th or >95th percentile (as appropriate) observed in age- and sex-matched control participants of the SEARCH CVD ancillary study.
Pairwise P < 0.05.
Pairwise P < 0.0001.
Indicated “yes” to item 17 on the DEPS-R: “I take less insulin than I should.”
Acute complications occurring in the previous 6 months; self-report.
Disordered eating behaviors assessed with the DEPS-R (8). Higher sum scores are more suggestive of increased disordered eating behavior. A recommended cutoff score of 20 has been empirically established as a threshold indicating the need for further clinical assessment for eating problems.
The prevalence of dyslipidemia, retinopathy, and DKD was significantly different across clusters (all P < 0.05; Table 2). After adjustment for sex, race/ethnicity, age, and diabetes duration at follow-up, and compared with the Referent Cluster, the Hyperglycemia Only Cluster had elevated odds of dyslipidemia (OR 2.22, 95% CI: 1.15 to 4.29], retinopathy (OR 9.98, 95% CI: 2.49 to 40.0), and DKD (OR 4.16, 95% CI: 1.37 to 12.62) (Table 3). The Elevated Weight with Increasing Hyperglycemia Cluster had elevated odds of hypertension (OR 2.18, 95% CI: 1.19 to 4.00), dyslipidemia (OR 2.36, 95% CI: 1.41 to 3.95), arterial stiffness (OR 2.46, 95% CI: 1.09 to 5.53), retinopathy (OR 5.11, 95% CI: 1.34 to 19.46), and DKD (OR 3.43, 95% CI: 1.29 to 9.11). Compared with the Referent Cluster, the Elevated Weight Only Cluster was not significantly associated with any of the early or subclinical diabetes complications. There were no significant interactions by sex or race/ethnicity.
ORs With 95% CIs From Multivariable Logistic Regression Models of the Association Between Longitudinal Weight-Glycemia Phenotype Clusters and Outcomes, With Adjustment for Minimum Confounders
| Model a | Referent (R) Cluster, n = 195 (34.2) | Hyperglycemia Only Cluster, n = 53 (9.3) | Elevated Weight Only Cluster, n = 206 (36.1) | Elevated Weight With Increasing Hyperglycemia Cluster, n = 116 (20.4) | Overall P Value | |
|---|---|---|---|---|---|---|
| Early or subclinical diabetes complicationsb | ||||||
| Hypertension | Unadjusted | ref | 0.61 (0.22–1.65) | 1.55 (0.92–2.59) | 2.26 (1.29–3.98) | 0.009 |
| Adjusted | ref | 0.45 (0.16–1.28) | 1.62 (0.95–2.77) | 2.18 (1.19–4.00) | 0.006 | |
| Dyslipidemia | Unadjusted | ref | 2.48 (1.32–4.69) | 1.30 (0.83–2.03) | 2.63 (1.61–4.31) | 0.003 |
| Adjusted | ref | 2.22 (1.15–4.29) | 1.31 (0.83–2.07) | 2.36 (1.41–3.95) | 0.005 | |
| Arterial stiffness | Unadjusted | ref | 0.72 (0.20–2.61) | 1.19 (0.58–2.44) | 2.24 (1.08–4.66) | 0.092 |
| Adjusted | ref | 0.49 (0.12–1.90) | 1.26 (0.59–2.69) | 2.46 (1.09–5.53) | 0.045 | |
| Retinopathy | Unadjusted | ref | 8.40 (2.42–29.14) | 0.48 (0.09–2.64) | 3.74 (1.10–12.73) | 0.0003 |
| Adjusted | ref | 9.98 (2.49–40.01) | 0.48 (0.08–2.73) | 5.11 (1.34–19.46) | 0.0004 | |
| DKD | Unadjusted | ref | 4.44 (1.53–12.92) | 0.82 (0.27–2.48) | 3.71 (1.45–9.53) | 0.0009 |
| Adjusted | ref | 4.16 (1.37–12.62) | 0.80 (0.26–2.44) | 3.43 (1.29–9.11) | 0.003 | |
| Peripheral neuropathy | Unadjusted | ref | 1.10 (0.29–4.16) | 1.36 (0.59–3.15) | 1.38 (0.53–3.59) | 0.880 |
| Adjusted | ref | 0.99 (0.25–3.92) | 1.53 (0.65–3.60) | 1.57 (0.57–4.35) | 0.715 | |
| Cardiovascular autonomic neuropathy | Unadjusted | ref | 1.43 (0.61–3.31) | 0.80 (0.43–1.50) | 0.57 (0.25–1.28) | 0.289 |
| Adjusted | ref | 1.45 (0.60–3.50) | 0.86 (0.45–1.63) | 0.72 (0.31–1.67) | 0.552 | |
| Total burden of early or subclinical diabetes complications | ||||||
| Two or more co-occurring early or subclinical diabetes complications | Unadjusted | ref | 2.50 (1.25–5.00) | 1.20 (0.71–2.01) | 3.00 (1.75–5.15) | <0.0001 |
| Adjusted | ref | 2.17 (1.01–4.66) | 1.3 (0.74–2.26) | 3.40 (1.86–6.21) | 0.0004 |
Bolded text represents statistical significance.
Abbreviation: ref, reference.
Adjusted for minimum confounders: sex, race/ethnicity (non-Hispanic white vs all others), age at follow-up, T1D duration at follow-up.
Outcomes defined as follows: Hypertension defined based on the American Academy of Pediatrics Clinical Practice Guidelines, 5th Report as of 2017 (23): Stage 1 or 2 hypertension (blood pressure ≥ 130/80 mm Hg or ≥ 95th percentile for ages < 13 years) or the use of antihypertensive medication. Dyslipidemia includes HDL and non-HDL dyslipidemia [non–HDL-cholesterol (computed as total cholesterol − HDL-cholesterol): > 130 mg/dL OR HDL-cholesterol: < 35 mg/dL] or use of lipid-lowering medication. Arterial stiffness was measured with the SphygmoCor-Vx device and defined as a carotid-femoral pulse wave velocity > 90th percentile compared with control participants of the SEARCH CVD study. Diabetic retinopathy was based on digital fundus images and defined as mild, moderate, or proliferative retinopathy in at least one eye. DKD was defined as the presence of albuminuria (>30 μg/mg of creatinine) or low glomerular filtration rate (<60 mL/min/1·73 m2 as estimated by the CKD-EPI equations with serum creatinine and cystatin C). Peripheral neuropathy was defined as a score > 2 on the Michigan Neuropathy Screening Instrument. Cardiovascular autonomic neuropathy was assessed by heart rate variability using the SphygmoCor-Vx device; cardiovascular autonomic neuropathy was defined as abnormalities in three or more of the five indices, based on < 5th or > 95th percentile (as appropriate) observed in age- and sex-matched control participants of the SEARCH CVD ancillary study.
The Hyperglycemia Only Cluster and Elevated Weight with Increasing Hyperglycemia Cluster reported 1.1 ± 1.0 and 1.2 ± 1.1 total early or subclinical diabetes complications, compared with 0.7 ± 0.8 in the Referent Cluster (P < 0.0001). In adjusted models, the Hyperglycemia Only Cluster had 2.17 times higher odds than the Reference Cluster of having two or more co-occurring early or subclinical diabetes complications (OR 2.2, 95% CI: 1.01 to 4.68). The Elevated Weight with Increasing Hyperglycemia Cluster had 3.4 times higher odds of having two or more co-occurring complications (OR 3.4, 95% CI: 1.86 to 6.21).
Discussion
We demonstrate here that there are subgroups of youth and young adults with established type 1 diabetes sharing longitudinal phenotypes defined by patterns in weight status and glycemic control over the very early natural history of type 1 diabetes. Phenotypic clusters showed different associations with early or subclinical diabetes complications at a mean of 8 years’ diabetes duration. We focus our discussion on the longitudinal weight-glycemia phenotypes first, and then turn to their associations with complications.
The four clusters showed clinically significant differences in mean BMIz and HbA1c measures over time, providing phenotypes that integrate information from both key clinical parameters. Only 34% of the sample was captured in the Referent Cluster, suggesting that a relatively small proportion of youth and young adults with type 1 diabetes have BMIz and HbA1c measures that meet or approach clinical targets for both weight status and glycemic control. Although the Hyperglycemia Only Cluster was the smallest cluster, comprising 9% of the sample, this subgroup distinguished itself by significant hyperglycemia at both time points. By contrast, the Elevated Weight Only Cluster and the Elevated Weight with Increasing Hyperglycemia Cluster comprised approximately 50% of the overall sample. Despite data showing that risk for obesity increases in people with type 1 diabetes as they age (38), the clusters showed relatively consistent measures of elevated BMIz from childhood onward. Moreover, neither age nor disease duration were significantly different across clusters at the follow-up visit, suggesting that the weight-glycemia phenotypes do not appear to be age- or duration-driven subgroups, although this finding may also be attributed to limited variability in the study population.
Our study was not designed to disentangled contribution of adiposity vs hyperglycemia to the emergence of early or subclinical complications of diabetes, but to provide insight to their combined real-world effects on early markers for ensuing vascular outcomes. At the cluster level, we found a disparity in the relative risk for adverse outcomes across the longitudinal weight-glycemia phenotypes. Subgroups with sustained poor or worsening glycemic control showed striking rates of microvascular complications at the follow-up visit, particularly when compared with the referent subgroup. For example, 15% of the Hyperglycemia Cluster and 7% of the Elevated Weight with Increasing Hyperglycemia Cluster had retinopathy compared with 2% in the Referent Cluster, whereas the prevalence of DKD in these subgroups exceeded 15% compared with just 4.0% in the Referent Cluster. This pattern adds to existing literature showing that the emergence of microvascular complications of type 1 diabetes is related to glycemic control (2, 39).
We did not find differences in the risk of peripheral or autonomic neuropathy across clusters, despite previous data showing these outcomes are associated with glycemic control and weight status (2, 8, 39, 40). Inconsistencies with previous studies may reflect differences in the measurement of classification of outcomes. In the current study, the null results likely also reflect small cell sizes (n = 35 or 7% of the sample showed peripheral neuropathy, whereas n = 63 of 12% showed cardiovascular autonomic neuropathy at the follow-up visit) and diminished statistical power to detect smaller difference. It is also possible that an association may be better detected at a longer disease duration or older age.
Compared with the Referent Cluster, the Elevated Weight Only Cluster did not show an increased risk for different early and subclinical complications over the duration of follow-up in the current study. This finding is inconsistent with multiple studies previously showing obesity acts as an independent risk factor for the development of macrovascular (41, 42) and microvascular complications of diabetes (8, 9, 43), as well as all-cause mortality (44). One possible explanation for the lack of association is that the effects of adiposity on the selected long-term complications, especially in relation to the Referent Cluster, may manifest after a greater duration of exposure or an older age and thus were not captured in data of adolescents and young adults in the SEARCH study. In a younger population and over a shorter duration, the findings from the current study appear to be better-suited to illuminate the effects of obesity as they compound complications of hyperglycemia; this remains a critical insight as the incidence of diabetes-related complications has recently rebounded among young adults ages 18 to 44 years with type 1 diabetes (45). In addition, these data also elude to physiologic differences between the Elevated Weight Only Cluster and the Elevated Weight with Increasing Hyperglycemia Cluster early in disease duration that may warrant more investigation toward optimizing therapy for obesity in type 1 diabetes. Compared with the subgroup with elevated weight and increasing hyperglycemia, the Elevated Weight Only subgroup showed lower mean waist circumference, lower mean waist-to-height ratio, and lower mean insulin doses with improved glycemic control and a lower prevalence of dyslipidemia at the follow-up visit (all P < 0.05). One interpretation of these differences is that weight gain in T1D that coincides with lower indices of insulin resistance may be protective against the development of complications. Confirmation of these findings may lend evidence toward using distinct therapeutic approaches such as metformin (46) to optimize early outcomes among youth with type 1 diabetes who show weight gain with markers of increased insulin resistance in the first decade after diagnosis.
In logistic regression modeling, the Elevated Weight with Increasing Hyperglycemia Cluster had a higher risk of subclinical macrovascular complications including hypertension, and dyslipidemia and arterial stiffness, in addition to the microvascular complications seen in the Hyperglycemia Only Cluster, a worrisome finding given the elevated risk for adverse events in this population (3). A notable finding is that this subgroup showed comparable or worse outcomes at the follow-up visit compared with the Hyperglycemia Only Cluster, the subgroup marked by sustained high HbA1c, despite having a significantly lower HbA1c at baseline.
The pattern in which BMI accelerates the worsening of CVD status, despite lower relative exposure to glycemia, is reminiscent of data from the Diabetes Control and Complications Trial and corresponding Epidemiology of Diabetes Interventions and Complications cohort showing that the incident rate of total CVD events among individuals who received intensive insulin therapy and gained the most weight approximated the rate of those who did not receive intensive insulin therapy after 20 years of follow-up (7). The current study may be interpreted as a corroboration of that pattern in a younger population with earlier disease duration. In addition, the findings are consistent with previous SEARCH data showing that individuals with adverse metabolic risk profiles at baseline and follow-up visit were 10 times more likely to develop multiple complications than individuals with less adverse profiles (22), as well as data-driven studies in large adult cohorts showing differences in end-organ damage across metabolic subtypes of type 1 diabetes (47). Findings further resonate with the increased prevalence of these outcomes among youth with type 2 diabetes vs T1D, suggesting that obesity may contribute to the underlying pathophysiology of these outcomes (1).
Given that dual exposure to adiposity and hyperglycemia, as it occurs across data-driven subgroups present in the data, may accelerate the development of complications, particularly the subclinical macrovascular ones, incorporation of obesity measures as part of the clinical phenotype of type 1 diabetes may provide useful prognostic information with regards to long-term, adverse outcomes. As the incidence of hospitalization for major diabetes-related complications continues to increase among young adults (45), future epidemiological studies should examine the risk associated with longitudinal BMI and HbA1c, by testing individual and joint models over a longer duration, to better characterize the associations among these risk factors.
The variable patterns of BMIz and HbA1c and differential risk profiles captured from the first 8 years of diabetes underscore the tremendous challenges and complexity associated with diabetes management, as well as the need for clinical practice guidelines for weight management specifically in the setting of pediatric-onset type 1 diabetes (4, 13, 48). The heterogeneity across phenotypes with regards to clinical presentation and outcomes, in conjunction with multiple technologic, behavioral, and therapeutic options available to optimize or co-optimize outcomes (4), suggest that a stratified approach, developing treatment plans according to the unique needs of each subgroup, may be most appropriate. For example, the use of continuous glucose monitoring systems in the adolescent population has increased and shows benefit with regards to improved glycemic control in this age range (49). Increased use of such emerging diabetes technology and devices may be useful in mitigating hyperglycemia as well as hypoglycemia; hypoglycemia has been implicated as a barrier to exercise and a trigger for overeating, leading to weight gain and elevated HbA1c (48). The addition of further behavioral assessments across phenotypes may also provide rich insights into optimization of their care. For example, it appears that the Hypoglycemia Only Cluster and the Elevated Weight with Increasing Hyperglycemia Cluster were both associated with suboptimal diabetes care behaviors based on reported frequency of self-glucose monitoring; these subgroups may benefit from clinical intervention to address barriers to diabetes-self management, particularly those that are specific to the youth and young adult age group. Interestingly, the latter group also exhibited significant maladaptive eating behaviors to limit weight gain or induce weight loss that could be additionally addressed to optimize both weight and glycemia outcomes. Finally, the stratified medicine approach also holds particular promise in light of existing and newer noninsulin adjunctive therapies (50, 51); i.e., pharmacological interventions that have direct impacts on both obesity and glycemic control and thus may be most beneficial in the highest-risk subgroup. To this end, more work is needed to extend this work to a clinically relevant platform where risk groups can be defined by easily measured criteria.
The current study should be considered in the context of its limitations. The exclusion of individuals with baseline disease duration of < 12 months diminished sample size and may limit generalizability, where the study population may be not representative of the full SEARCH cohort. These exclusion criteria were judged to be important to avoid other forms of bias that may result from combining two phases of the early natural history of type 1 diabetes in the baseline measures, including misclassification bias, and based on scientific evidence regarding the duration of partial remission in relevant patient populations (15, 16). The resulting phenotypes are thus representative of known challenges in glycemia that occur after the remission period (13) rather than differences in remission itself. Because it is not model-based, there are no parameters to evaluate goodness-of-fit. However, the longitudinal k-means algorithm with parameters used in this analysis were shown to outperform other model based latent trajectory class analyses (52). The selection of the final number of clusters is subjective. We used a criterion for this decision that has been shown to perform best in nonhierarchical algorithms (6). Only two time points were used in the longitudinal cluster analysis, thus interim patterns in BMIz and HbA1c are not captured in these subgroups. Outcomes are prevalence measures; absolute risk difference across clusters cannot be reported. Low prevalence rates may increase the type 2 error rate for the outcomes. The hypertension outcome may be biased by misclassification of youth and young adults taking antihypertensive medications for renal protection. Sample size was not sufficient to include additional covariates to regression models, including markers of socioeconomic position, or test for interactions by daily insulin dose, which could act as an important modifier of the association between adiposity and CVD risk factors (53). There are additional limitations to the data, including the accuracy of self-reported measures such as glucose monitoring frequency and episodes of diabetic ketoacidosis. The longitudinal weight-glycemia clusters and their association with outcomes was not tested in a prospective way and thus clusters are not predictive in nature. Additional exploratory analyses tested the predictive validity of weight-glycemia clusters derived from baseline measures only and overlapping BMIz and HbA1c at the follow-up visit with variable associations with complications; this approach was deemed to be limited by the true variability in weight and glycemia measures over the early history of type 1 diabetes and less informative with regards to the joint trajectory structure inherent in the data.
There also several important strengths of this study. To our knowledge, it is the first to identify subgroups based on both weight and glycemia in established diabetes and evaluate the clinical utility for predicting long-term outcomes. The analysis takes an approach that integrates weight with glycemic control, a paradigm that offers a comprehensive and patient-centered approach to long-term health issues in type 1 diabetes. Clustering BMIz and HbA1c jointly produces a single grouping single nominal variable (i.e., cluster) that resumes the information contained in both sets of variables over both time points, offering an integrated measure of exposure to adiposity and glycemia as it occurs in real life. k-means is nonparametric and therefore requires no prior information for clustering (52). Capturing clinical phenotypes in youth with type 1 diabetes reflects how clinicians work to deliver individual care plans for patients and offers a platform for future research toward guidelines to comprehensively reduce the burden of comorbid complications among young people with diabetes.
In conclusion, we found evidence of four longitudinal weight-glycemia phenotypes of established, youth-onset T1D in the first eight years after diagnosis in patients with diabetes who experience different burdens of comorbid early or subclinical complications. More work is needed to identify therapeutic approaches tailored to the needs and prognoses of each subgroup for interventions that can be implemented early in the natural history of type 1 diabetes.
Acknowledgments
The SEARCH for Diabetes in Youth Study is indebted to the many youth and their families, and their health care providers, whose participation made this study possible.
Financial Support: The SEARCH for Diabetes in Youth Cohort Study (1UC4DK108173) is funded by the National Institutes of Health (NIH), National Institute of Diabetes and Digestive and Kidney Diseases (NIDDK), and supported by the Centers for Disease Control and Prevention. SEARCH for Diabetes in Youth is funded by the Centers for Disease Control and Prevention (PA numbers 00097, DP-05-069, and DP-10-001) and supported by the NIDDK. A.R.K. is supported by NIDDK of the NIH under Award Number F30DK113728. M.R.K., C.T.N., and J.B.B. are supported by funding from North Carolina Translational and Clinical Sciences Institute: UL1TR002489. Site Contract Numbers are as follows: Kaiser Permanente Southern California (U18DP006133, U48/CCU919219, U01 DP000246, and U18DP002714); University of Colorado Denver (U18DP006139, U48/CCU819241-3, U01 DP000247, and U18DP000247-06A1); Cincinnati’s Children’s Hospital Medical Center (U18DP006134, U48/CCU519239, U01 DP000248, and 1U18DP002709); University of North Carolina at Chapel Hill (U18DP006138, U48/CCU419249, U01 DP000254, and U18DP002708); Seattle Children’s Hospital (U18DP006136, U58/CCU019235-4, U01 DP000244, and U18DP002710-01); and Wake Forest University School of Medicine (U18DP006131, U48/CCU919219, U01 DP000250, and 200-2010-35171). The authors acknowledge the involvement of the Kaiser Permanente Southern California’s Clinical Research Center (funded by Kaiser Foundation Health Plan and supported in part by the Southern California Permanente Medical Group, the South Carolina Clinical & Translational Research Institute at the Medical University of South Carolina), NIH/National Center for Advancing Translational Sciences (NCATS) grant number UL1 TR000062 and UL1 TR001450; Seattle Children’s Hospital and the University of Washington, NIH/NCATS Grant UL1 TR00423; University of Colorado Pediatric Clinical and Translational Research Center, NIH/NCATS Grant UL1 TR000154; the Barbara Davis Center at the University of Colorado at Denver (DERC NIH Grant P30 DK57516); the University of Cincinnati, NIH/NCATS Grant UL1 TR000077, UL1 TR001425; and the Children with Medical Handicaps program managed by the Ohio Department of Health. This study includes data provided by the Ohio Department of Health, which should not be considered an endorsement of this study or its conclusions. The findings and conclusions in this report are those of the authors and do not necessarily represent the official position of the Centers for Disease Control and Prevention and the National Institute of Diabetes and Digestive and Kidney Diseases.
Author Contributions: A.R.K. and E.J.M.-D. designed the analyses. A.R.K., C.T.N., and M.R.K. and conducted the analyses. A.R.K. and E.J.M.-D. drafted the initial manuscript. C.T.N., L.A.A., A.E.A., K.S.B., J.B.B., D.D., L.M.D., F.S.M., A.K.M., C.P., B.A.R., K.A.S., and M.R.K. reviewed all analyses and provided critical review of the manuscript. A.R.K. and E.J.M.-D. had full access to all the data in the study and take responsibility for the integrity and accuracy of the data analysis.
Additional Information:
Disclosure Summary: The authors have nothing to disclose.
Data Availability: The data that support the findings of this study are available from the SEARCH for Diabetes in Youth Steering Committee, but restrictions apply to the availability of these data, which were used under license for the current study, and so are not publicly available. However, data are available from the authors upon reasonable request and with permission of the SEARCH for Diabetes in Youth Steering Committee.
Abbreviations:
- aOR
adjusted odds ratio
- BMI
body mass index
- BMIz
body mass index z score
- CVD
cardiovascular disease
- DAA
diabetes autoantibody
- DEPS-R
Diabetes Eating Problem Survey Revised
- DKD
diabetic kidney disease
- EWH
Elevated Weight With Increasing Hyperglycemia
- HDL
high-density lipoprotein
- T1D
type 1 diabetes
