


Abstract
Adipocyte fatty acid-binding protein (FABP4) is expressed in adipose tissue and may impair glucose homeostasis and promote atherosclerotic processes.
We examined the association between serum FABP4 and risk of type 2 diabetes (T2D), myocardial infarction (MI), and stroke.
Case-cohort study embedded within a sample of 27,548 participants of the EPIC-Potsdam cohort.
A randomly selected subcohort (n = 2194) of participants who were free of cardiovascular disease and T2D at study baseline and 728 incident T2D cases, 206 incident stroke cases, and 185 incident MI cases with an average 8.2 (±1.7) years of follow-up.
Incident T2D, MI, and stroke.
In a multivariable-adjusted model, the hazard ratios (HRs) in the highest vs lowest quartile of FABP4 were 1.81 (95% CI, 1.21 to 2.70; Ptrend = 0.01) for T2D, 0.93 (95% CI, 0.55 to 1.55; Ptrend = 0.68) for MI, and 1.41 (95% CI, 0.80 to 2.49; Ptrend = 0.24) for stroke, respectively. In analyses stratified by sex, no statistically significant differences could be seen for associations between FABP4 and T2D and MI (Pinteraction by sex = 0.27 and 0.84, respectively), whereas a higher risk of stroke was observed in men (HR: 2.70, 95% CI 1.20 to 6.00; P = 0.04), but not in women (HR: 0.70, 95% CI 0.31 to 1.60; P = 0.53; Pinteraction = 0.02).
These data support the hypothesis that elevated FABP4 levels may contribute to T2D risk. In contrast, our data did not support the hypothesis that circulating FABP4 may be relevant for MI, whereas the observed association with stroke in men may need further evaluation.
Adipocyte fatty acid-binding protein 4 (FABP4) is an intracellular lipid chaperone member of the cytoplasmatic fatty acid binding protein multigene family (1). Formerly deemed exclusive regulator of lipid transport and metabolism, FABP4 has been recently described as a multifunctional biomarker suggested to play a role in lipid signaling pathways, inflammatory responses, and metabolic regulation (1, 2). FABP4 is primarily expressed in adipocytes and macrophages and has been recently implicated in the development of type 2 diabetes (T2D) and atherosclerosis (2, 3).
In animal models, FABP4-deficient mice have been shown to be partially protected from hypertriglyceridemia and insulin resistance in the presence of genetically or diet-induced obesity (4), whereas inhibition or knockout of FABP4 was shown to prevent the development of atherosclerotic lesions in a mouse model of severe hypercholesteremia and accelerated atherosclerosis (5). In human studies, circulating FABP4 levels correlated positively with obesity and metabolic syndrome components, i.e., high blood pressure (BP) and dyslipidemia (6). Serum FABP4 concentration was also suggested to play a role in glucose homeostasis in patients with T2D (7). Nevertheless, the overall epidemiological evidence on the association between circulating FABP4 and incidence of T2D has been inconsistent with some studies reporting a positive association (8, 9), whereas other studies reporting null results (10, 11). Furthermore, FABP4 was implicated in the development of atherosclerosis and cardiovascular outcomes (2). Higher FABP4 concentrations were observed in patients with cardiovascular disease (CVD) compared with controls (12–14). Recently, circulating FABP was suggested to predict functional outcome and mortality in stroke patients independent of established conventional risk factors (15–17). However, data from prospective studies have been less consistent and the role of prediagnostic FABP4 as a direct contributor to CVD physiopathology has not been clarified (18).
Taken together, FABP4 could be implicated in the development of T2D and CVD, however, data from epidemiological research have been scant. We therefore aimed to investigate the prospective association of serum FABP4 concentrations with incident T2D, myocardial infarction (MI), and stroke using data from the European Prospective Investigation into Cancer and Nutrition (EPIC)-Potsdam cohort.
Materials and Methods
Study population
The EPIC-Potsdam study is part of the large-scale EPIC cohort and includes 27,548 men and women aged 35 to 65 years recruited from the general population of Potsdam and surrounding areas (19). Study procedures were approved by the Ethics Committee of the medical association of the State of Brandenburg (Germany). All participants provided written informed consent, and procedures were in line with the Helsinki Declaration for human rights. Baseline examination was conducted from 1994 through 1998 and included blood sampling, measurements of BP and anthropometric parameters, self-administered questionnaires on diet and lifestyle, and personal computer-assisted interviews (20).
Incident cases of T2D, MI, or stroke were identified by death certificate or by self-report in follow-up questionnaires mailed to the study participants every two to three years (21). The response rates during follow-up exceeded 90%. In the current analysis, we included all follow-up data of questionnaires returned by 31 August 2005 (T2D) or 30 November 2006 (MI and stroke), respectively. The diagnosis was verified by contacting the patients’ diagnosing physician, by review of medical records from the hospital, or by review of death certificates. All diagnoses were coded according to the International Classification of Diseases, 10th Revision (ICD-10).
After exclusion of participants with a history of T2D, MI, or stroke at baseline, we identified during an average of 8.5 years of follow-up 854 individuals with incident T2D (ICD-10 E11), 272 individuals with incident MI (ICD-10 I21) and 254 individuals with incident stroke classified as ischemic stroke (ICD-10 I63), hemorrhagic stroke (ICD-10 I60 and I61), or unspecified stroke (ICD-10 I64), respectively. In individuals with more than one cardiovascular event, only the first event was considered. For MI and stroke, death within 28 days after diagnosis and a death certificate in which the underlying cause of death was recorded with the respective ICD-10 codes was considered as a fatal event resulting from CVD.
The association of serum FABP4 levels with risk of disease was analyzed with a case-cohort design. With this type of study design, the results are expected to be generalizable to the source population without the need to measure FABP4 levels in the entire cohort (22, 23). Accordingly, among participants with biosample collection (n = 26,437), we randomly selected a subcohort of 2500 individuals from the EPIC-Potsdam cohort (Fig. 1). Because of missing values in serum FABP4-levels, relevant covariates, or missing follow-up data, we excluded 134 individuals of the random subcohort, 79 incident T2D cases, 26 incident cases of MI, and 22 incident stroke cases. After additional exclusion of subcohort members reporting a history of diabetes, MI, or stroke at study baseline, the final case-cohort sample included 2194 individuals of the subcohort, 728 incident T2D cases, 206 incident stroke cases, and 185 incident MI cases that occurred during an average of 8.2 (±1.7) years of study follow-up.
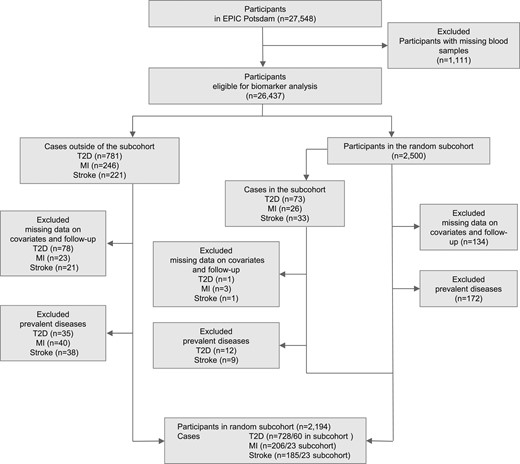
Flow diagram depicting study sample derivation. n = number.
Assessment and definition of covariates
Baseline measurement of anthropometric parameters was obtained by trained personnel with the participants dressed in light clothes and without shoes. Body mass index (BMI) was calculated as the ratio of body weight (kg) to height squared (m2). Waist circumference was measured midway between the lower rib margin and the superior anterior iliac spine to the nearest 0.5 cm with a nonstretching tape applied horizontally. Smoking habits, physical activity, educational attainment, and medical history were assessed during a standardized interview. Dietary habits including consumption of alcoholic beverages, red meat, and whole grain bread during the previous year were assessed with self-administered food frequency questionnaires (24). Measurements of systolic and diastolic BP were obtained after a resting period of 15 to 30 minutes (25). History of hypertension was defined as systolic BP ≥ 140 mm Hg, diastolic BP ≥ 90 mm Hg, self-reported hypertension diagnosis, or use of antihypertensive medication.
Biomarker measurements
At study baseline 30 mL of venous blood was collected by qualified medical staff in a standardized procedure and subsequently fractionated into serum, plasma, buffy coat, and erythrocytes. Blood samples were stored in the vapor phase of liquid nitrogen at −196°C until measurement of clinical biomarkers. Baseline plasma concentrations of cholesterol, high-density lipoprotein cholesterol (HDL-C), triglycerides, high-sensitivity C-reactive protein (hs-CRP), γ-glutamyl transferase (GGT), and red blood cell proportions of glycated hemoglobin (HbA1C) were determined with the automatic ADVIA 1650 chemistry system (Siemens Healthcare, Erlangen, Germany) at the Department of Internal Medicine, University of Tubingen (26). Concentrations of serum FABP4 were assessed by an enzyme immunoassay assay kit for human FABP4 from Biovendor (Brno, Czech Republic). In a separate study, we also evaluated the reliability of plasma FABP4 concentrations among 207 participants from the EPIC-Potsdam study using replicate blood samples taken 4 months apart (27). The intraclass correlation coefficients denoting the between-person variance divided by the sum of the between- and within-person variance was 0.73 (95% CI, 0.65 to 0.78), indicating very good reliability of FABP4 measurements (27).
Statistical analyses
Participants were categorized into quartiles based on the sex-specific distribution of serum FABP4 in the random subcohort. Baseline characteristics of the subcohort were displayed as means ± SDs or frequencies across quartiles of FABP4, as appropriate. To examine the correlation between FABP4 and established disease markers, we calculated Spearman partial correlation coefficients adjusted for age and sex within subcohort members
To investigate the association of FABP4 with risk of T2D, MI, or stroke, we used Cox proportional hazards regression adapted for the case-cohort design using the weighting method described by Prentice (22). The participants’ age at recruitment was used as the entry time and age at censoring or at diagnosis of T2D, MI, or stroke, respectively, as the disease-specific exit time. The regression models were stratified by age at recruitment and adjusted for sex, physical activity (inactive, moderately inactive, moderately active, active), smoking (never smoker, past smoker, smoker), education (no vocational training/vocational training, technical college, university), alcohol consumption (no alcohol use at study baseline; low consumption: men > 0 to 12 g/d, women > 0 to 6 g/d; moderate consumption: men > 12 to 24 g/d, women > 6 to 12 g/d; high consumption: men > 24 g/d, women > 12g/d; coffee intake (g/d), red meat intake (g/d), whole grain bread intake (g/d), prevalent hypertension (yes/no), and fasting status (yes/no). The multivariable-adjusted model was further adjusted for BMI and waist circumference. In addition, the association for T2D was adjusted for metabolic biomarkers including HbA1C, cholesterol, HDL-C, triglycerides, hs-CRP, and GGT. The shape of the association for T2D was also evaluated by means of cubic spline regression fitting knots at 5th, 50th, and 95th percentile of biomarker distribution. In these analyses, the nonlinear trend was assessed based on the Wald test.
In additional stratified analyses, we evaluated the associations according to categories based on BMI (<25 kg/m2 vs ≥25 kg/m2) and waist circumference (men: <94 cm vs ≥94 cm; women: <80 cm vs ≥80 cm). P values for interaction on the multiplicative scale were obtained by the likelihood ratio test after including cross-product terms between plasma FABP4 and categories of the respective dichotomized anthropometric variable in the regression model. In secondary analyses we also stratified by sex.
To compare model performance with and without FABP4, we examined changes in continuous net reclassification improvement [NRI(>0)] and the relative integrated discrimination improvement (rIDI) as suggested reclassification measures (28), in models including variables in the multivariable adjustment sets described above. NRI(>0) quantifies amount of correct change in model-based probabilities introduced by using model with new biomarker (29). As previously suggested, NRI(>0) values >0.6, 0.6 to 0.4, and <0.2 have been considered strong, intermediate, and weak, respectively (28). rIDI is defined as the increase in discrimination slopes of model including biomarker divided by the slope of the old model (29). In sensitivity analyses, we excluded cases diagnosed with disease within the first 2 years of study follow-up (189 diabetes cases, 11 MI cases, and 14 stroke cases) and participants with extreme FABP4 concentrations (below 5th percentile, 7.7 ng/mL and above the 95th percentile, 37.5 ng/mL, n = 308). In addition, we explored the associations in analyses restricted to fasting participants (n = 935). Finally, we also evaluated main associations for additional endpoints such as ischemic stroke (n = 148), hemorrhagic stroke (n = 34), fatal MI (n = 35), and fatal stroke (n = 23).
All P values presented are two-tailed, and P < 0.05 was considered statistically significant. All statistical analyses were carried out using SAS software, version 9.2 (SAS Institute, Inc., Cary, NC).
Results
Participants with higher FABP4 concentrations at baseline were more likely to be older, to have higher BMI and waist circumference, to be physically inactive, to smoke less and to have a history of hypertension compared with participants with lower FABP4 concentrations (Table 1). The inverse association with smoking was restricted to women (Spearman ρ = 0.09; P = 0.002) compared with men (ρSpearman = 0.01; P = 0.62) and after adjustment for age and BMI, the correlation in women was no longer present (ρSpearman = −0.02; P = 0.35). In Spearman partial correlation analysis adjusted for age and sex, FABP4 was positively correlated with BMI (rs = 0.51) waist circumference (rs = 0.54), hs-CRP (rs = 0.33), GGT (rs = 0.30), and triglycerides (rs = 0.27). Weaker positive correlations were observed for HbA1C, glucose, and total cholesterol, and inverse correlations with HDL-C (Table 2).
Baseline Characteristics and Risk Factors According to Sex-Specific Quartiles of Plasma FABP4 Concentrations Within the EPIC-Potsdam Subcohort
| Baseline Characteristics | Quartiles of Plasma FABP4 Concentrations | |||
|---|---|---|---|---|
| 1 | 2 | 3 | 4 | |
| N | 560 | 544 | 544 | 546 |
| FABP4, ng/mL, median, IQR | 9.2 (7.8–10.2) | 12.9 (12.0–14.5) | 17.1 (15.3–19.5) | 26.1 (22.4–32.7) |
| Age, y, mean ± SD | 46.1 ± 0.4 | 48.8 ± 0.4 | 51.2 ± 0.4 | 53.2 ± 0.4 |
| Male sex, % | 37.1 | 36.6 | 36.8 | 36.3 |
| BMI, kg/m2, mean ± SD | 23.1 ± 0.1 | 24.9 ± 0.1 | 26.6 ± 0.1 | 29.2 ± 0.1 |
| Waist circumference, cm, mean ± SD | 77.6 ± 0.5 | 82.3 ± 0.5 | 87.1 ± 0.5 | 93.8 ± 0.5 |
| Physically active, % | 21.6 | 17.1 | 14.7 | 11.4 |
| Current smoker, % | 25.9 | 20.4 | 18.9 | 16.7 |
| University degree, % | 45.2 | 43.2 | 34.7 | 32.1 |
| Self-reported hypertension, % | 29.6 | 41.0 | 52.2 | 63.7 |
Abbreviation: IQR, interquartile range.
Age- and Sex-Adjusted Spearman Correlation Coefficients of Plasma FABP4 Concentrations With Anthropometric Parameters and Selected Biomarkers Within the EPIC-Potsdam Subcohort
| Anthropometric Parameters and Biomarkers | Spearman Correlation Coefficienta | ||
|---|---|---|---|
| rs | 95% CI | P | |
| BMI | 0.55 | 0.52; 0.58 | <0.0001 |
| Waist circumference | 0.54 | 0.51; 0.57 | <0.0001 |
| Glucoseb | 0.12 | 0.08-0.15 | <0.0001 |
| HbA1Cb | 0.12 | 0.08; 0.17 | <0.0001 |
| HDL-Cb | −0.12b | −0.22; -0.15 | <0.0001 |
| Total cholesterolb | 0.11 | 0.08; 0.15 | <0.0001 |
| Triglyceridesb | 0.27 | 0.23; 0.31 | <0.0001 |
| hs-CRPb | 0.33 | 0.29; 0.37 | <0.0001 |
| GGTb | 0.30 | 0.26; 0.34 | <0.0001 |
Adjusted for age and sex.
Analyses with plasma biomarker restricted to 1981 participants with complete biomarker information.
T2D
In multivariable-adjusted Cox-models, taking into account age, sex, education, lifestyle factors, and prevalent hypertension, participants within the highest compared with the lowest quartile of serum FABP4 levels had a 4.91-fold higher risk of T2D (95% CI 3.45, 6.98; Ptrend < 0.0001; Table 3). After additional adjustment for BMI and waist circumference, the association was substantially attenuated, but remained statistically significant (HR = 1.81; 95% CI 1.21, 2.70; Ptrend = 0.01). In spline regression analysis, the shape of the observed association with T2D showed to be nonlinear (Fig. 2).
HRs of T2D, MI, and Stroke According to Quartiles of FABP4 Concentrations
| Quartiles of Plasma FABP4 Concentrations | |||||
| 1 | 2 | 3 | 4 | Ptrend | |
| FABP4, median, ng/mL | 9.2 | 12.9 | 17.1 | 26.1 | |
| T2D | |||||
| N, cases | 48 | 106 | 178 | 396 | |
| HR, 95% CI | |||||
| Crude modela | 1.00 | 1.90 (1.31–2.75) | 2.84 (1.99–4.05) | 6.15 (4.38–8.64) | <0.0001 |
| MV modelb | 1.00 | 1.77 (1.21–2.60) | 2.42 (1.68–3.50) | 4.91 (3.45–6.98) | <0.0001 |
| MV model + BMI and waist circumference | 1.00 | 1.37 (0.92–2.06) | 1.49 (1.00–2.21) | 1.81 (1.21–2.70) | 0.01 |
| MI | |||||
| N, cases | 40 | 45 | 49 | 72 | |
| HR, 95% CI | |||||
| Crude modela | 1.00 | 0.88 (0.56–1.36) | 0.80 (0.52–1.24) | 1.07 (0.70–1.62) | 0.71 |
| MV modelb | 1.00 | 1.07 (0.68–1.68) | 0.98 (0.63–1.55) | 1.15 (0.74–1.81) | 0.59 |
| MV model + BMI and waist circumference | 1.00 | 1.01 (0.64–1.60) | 0.89 (0.55–1.42) | 0.93 (0.55–1.55) | 0.68 |
| Stroke | |||||
| N, cases | 26 | 38 | 52 | 69 | |
| HR, 95% CI | |||||
| Crude modela | 1.00 | 1.31 (0.78–2.20) | 1.49 (0.91–2.45) | 1.68 (1.05–2.68) | 0.02 |
| MV modelb | 1.00 | 1.26 (0.74–2.16) | 1.43 (0.85–2.42) | 1.44 (0.87–2.39) | 0.16 |
| MV model + BMI and waist circumference | 1.00 | 1.26 (0.74–2.17) | 1.42 (0.84–2.43) | 1.41 (0.80–2.49) | 0.24 |
Abbreviations: MV, multivariable adjusted model; N, number.
Age was used as the underlying time variable in all regression models, with stratification by age at recruitment.
The multivariable model is adjusted for sex, physical activity, smoking, educational attainment, consumption of alcoholic beverages, consumption of whole grain bread, consumption of red meat, consumption of coffee, prevalent hypertension, and fasting status.
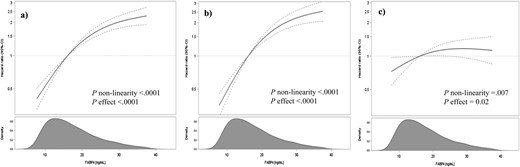
Association of serum FABP4 concentrations and risk of T2D. Results from cubic spline regression fitting knots at 5th, 50th, and 95th percentile of biomarker distribution. (a) Cox proportional hazards regression adapted for the case-cohort design using the weighting method described by Prentice (22), using age as the underlying time variable, with stratification by age at recruitment. (b) Multivariable model is adjusted for sex, physical activity, smoking, educational attainment, consumption of alcoholic beverages, consumption of whole grain bread, consumption of red meat, consumption of coffee, prevalent hypertension, and fasting status. (c) Multivariable model additionally adjusted for BMI and waist circumference. The shaded area represents the smoothed density of FABP4 distribution calculated with the nonparametric kernel density estimation.
We next analyzed the influence of entering biomarkers, reflecting different pathways to the multivariable-adjusted model (Table 4). When added, individually, the positive association between FABP4 and risk of T2D was most strongly attenuated after adjustment for HbA1C or triglyceride levels, although positive associations remained. In contrast, including HDL-cholesterol, total cholesterol, hs-CRP, and GGT resulted in negligible alterations of the HRs.
Multivariable HRs (95% CIs) of T2D by Quartiles of FABP4 Concentrations After Adjustment for Metabolic Biomarkers
| Quartiles of Plasma FABP4 Concentrations | |||||
| Adjustment Models | 1 | 2 | 3 | 4 | Ptrend |
| HR, 95% CI | |||||
| MV modela + BMI and waist circumference | 1.00 | 1.37 (0.92–2.06) | 1.49 (1.00–2.21) | 1.81 (1.21–2.70) | 0.01 |
| MV modela + BMI and waist circumference + HbA1c | 1.00 | 1.39 (0.91–2.10) | 1.21 (0.79–1.83) | 1.53 (1.01–2.33) | 0.09 |
| MV modela + BMI and waist circumference + HDL-C | 1.00 | 1.33 (0.87–2.01) | 1.46 (0.98–2.19) | 1.70 (1.13–2.56) | 0.01 |
| MV modela + BMI and waist circumference + TC | 1.00 | 1.32 (0.88–1.99) | 1.44 (0.97–2.14) | 1.74 (1.16–2.61) | 0.007 |
| MV modela + BMI and waist circumference + TG | 1.00 | 1.28 (0.85–1.93) | 1.41(0.95–2.09) | 1.58 (1.05–2.37) | 0.03 |
| MV modela + BMI and waist circumference + CRP | 1.00 | 1.28 (0.85–1.93) | 1.46 (0.98–2.17) | 1.73 (1.15–2.60) | 0.006 |
| MV modela + BMI and waist circumference + GGT | 1.00 | 1.33 (0.88–1.99) | 1.42 (0.96–2.12) | 1.69 (1.13–2.54) | 0.01 |
Abbreviations: MV, multivariable adjusted; TC, total cholesterol; TG, triglycerides.
The multivariable model is adjusted for sex, physical activity, smoking, educational attainment, consumption of alcoholic beverages, consumption of whole grain bread, consumption of red meat, consumption of coffee, prevalent hypertension, and fasting status.
When stratified by BMI, the risk of T2D for the comparison of extreme quartiles of serum FABP4 was 3.49 in individuals with BMI < 25 kg/m2 (95% CI 1.41, 8.60; Ptrend = 0.02), and 1.39 (95% CI 0.86 to 2.26; Ptrend = 0.10) among persons with BMI ≥ 25 kg/m2 (Pinteraction = 0.08; Fig. 3). In contrast, the HRs across FABP4 quartiles were similar among individuals with low vs high waist circumference (Pinteraction = 0.70; Fig. 3).
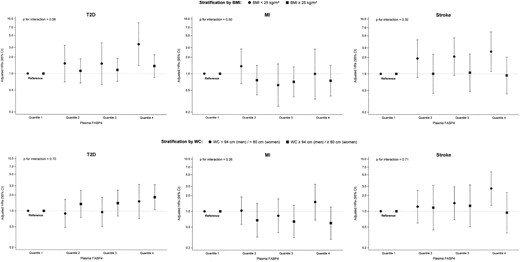
Association of serum FABP4 concentrations with risk of T2D, MI, and stroke, stratified by (upper panel) BMI and (lower panel) waist circumference. Results from Cox proportional hazards regression adapted for the case-cohort design using the weighting method described by Prentice (22), using age as the underlying time variable, with stratification by age at recruitment, and adjustment for sex, physical activity, smoking, educational attainment, consumption of alcoholic beverages, consumption of whole grain bread, consumption of red meat, consumption of coffee, prevalent hypertension, fasting status, BMI, and waist circumference.
In analyses stratified by sex, the HRs for T2D in the highest vs lowest quartile of FABP4 appeared to be stronger among women (HR: 2.56; 95% CI, 1.26 to 5.20; Ptrend = 0.007 compared with men (HR: 1.33; 95% CI, 0.80 to 2.18; Ptrend = 0.23; Pinteraction=0.27; Table 5).
HRs (95% CIs) of T2D, MI, and Stroke by Quartiles of FABP4 Concentrations by Sex
| Quartiles of Plasma FABP4 Concentrationsa | ||||||
| Q1 | Q2 | Q3 | Q4 | Ptrend | Pinteractionb | |
| T2D | ||||||
| Men | ||||||
| N, cases | 36 | 65 | 105 | 206 | ||
| HR, 95% CI | 1.00 | 1.11 (0.66–1.88) | 1.41 (0.85–2.32) | 1.33 (0.80–2.18) | 0.23 | 0.27 |
| Women | ||||||
| N cases | 12 | 41 | 73 | 190 | ||
| HR, 95% CI | 1.00 | 1.87 (0.93–3.76) | 1.63 (0.81–3.28) | 2.56 (1.26–5.20) | 0.007 | |
| MI | ||||||
| Men | ||||||
| N, cases | 33 | 33 | 35 | 48 | ||
| HR, 95% CI | 1.00 | 0.95 (0.56–1.61) | 0.83 (0.47–1.44) | 0.85 (0.47–1.55) | 0.54 | 0.84 |
| Women | ||||||
| N cases | 7 | 12 | 14 | 24 | ||
| HR, 95% CI | 1.00 | 1.25 (0.49–3.20) | 0.94 (0.36–2.40) | 1.28 (0.49–3.37) | 0.72 | |
| Stroke | ||||||
| Men | ||||||
| N, cases | 11 | 21 | 20 | 42 | ||
| HR, 95% CI | 1.00 | 2.30 (1.01–5.21) | 1.71 (0.73–4.00) | 2.70 (1.20–6.00) | 0.04 | 0.02 |
| Women | ||||||
| N, cases | 15 | 17 | 32 | 27 | ||
| HR, 95% CI | 1.00 | 0.85 (0.38–1.86) | 1.19 (0.58–2.42) | 0.70 (0.31–1.60) | 0.53 | |
Abbreviations: N, number; Q, quartile.
The multivariable model is adjusted for sex, physical activity, smoking, educational attainment, consumption of alcoholic beverages, consumption of whole grain bread, consumption of red meat, consumption of coffee, prevalent hypertension, fasting status, BMI, and waist circumference.
P value for statistical interaction calculated on the multiplicative scale based on the likelihood ratio test.
MI
Participants in the highest vs lowest quartile of FABP4 had a multivariable adjusted relative risk of 1.15 (95% CI 0.74, 1.81; Ptrend = 0.59) for MI without additional adjustment for BMI or waist circumference, and a RR of 0.93 (95% CI 0.55, 1.55; Ptrend = 0.68; Table 3) with additional adjustment for BMI and waist circumference. Further adjustment for biomarkers did not substantially change these results (data not shown). There was no evidence for an effect modification by BMI or waist circumference (Fig. 3). There was also no difference by sex (Table 5). In analyses restricted to fatal MI cases (n = 35), FABP4 concentration above the median vs below the median was positively albeit weakly and not statistically significantly associated with a higher MI risk (HR: 1.37; 95% CI, 0.70 to 2.71).
Stroke
Participants in the highest vs lowest quartile of FABP4 had a multivariable adjusted risk of stroke of 1.44 (0.87, 2.39; Ptrend = 0.16) without, and 1.41 (95% CI 0.80, 2.49; Ptrend = 0.24) with additional adjustment for BMI and waist circumference (Table 3). Further adjustment for biomarkers did not substantially change these results (data not shown). Similar estimates were obtained when restricting the analysis to 148 cases of incident ischemic stroke (RR = 1.35; 95% CI 0.73, 2.50; Ptrend = 0.24). When restricted to hemorrhagic stroke (34 cases), the HR was 1.19 (95% CI 0.51, 2.77) when comparing participants with FABP4 levels above vs participants below the sex-specific median.
The HR for stroke in the highest vs lowest quartile of FABP4 was 2.56 (95% CI 1.11, 5.92; Ptrend = 0.02) among participants with BMI < 25 kg/m2, and it was (HR = 0.93, 95% CI = 0.43 to 2.02, Ptrend = 0.79,) among participants with BMI ≥ 25 kg/m2 (Pinteraction = 0.32; Fig. 3). The association between FABP4 and stroke was stronger among men (HR in the highest vs lowest quartile of FABP4: 2.70; 95% CI, 1.20 to 6.05; Ptrend = 0.04) than among women (0.70; 95% CI, 0.31 to 1.60; Ptrend =0.54; Pinteraction = 0.03) (Table 5). When analyses were restricted to fatal stroke cases (n = 23), FABP4 concentration above the median vs below the median was positively, albeit weakly, and not statistically significantly associated with higher stroke risk (HR: 1.19; 95% CI, 0.58 to 2.46).
To determine the clinical utility of adding FABP4 to predictive models for T2D, MI, and stroke, we evaluated a model with and without this variable, including sex, education, and lifestyle-related variables included in the main multivariable analyses and a full model with added BMI and waist circumference. Overall, we observed that model improvement varied depending on the reference model. When only the variables in main multivariable analyses were included as baseline model, the reclassification calibration improved, most notably for T2D. The estimated NRI(>0) was 0.41, 0.14, and 0.21 and the rIDI was 0.27, 0.003, and −0.003 for T2D, MI, and stroke, respectively. When the full model, additionally including BMI and waist circumference was used as the reference, there was little improvement in model fit. In these analyses, the estimated NRI(>0) was 0.09, −0.01, and 0.12 and the rIDI was 0.03, 0.001, and −0.004 for T2D, MI, and stroke, respectively. Of note, the negative NRI(>0) value for MI possibly suggest that FABP4 merely adds additional outcome specific variation in line with the overall weak association with the end point.
Sensitivity analyses
In sensitivity analyses, the associations were not markedly changed when participants diagnosed with a disease within the first two years of study follow-up, those with extreme FABP4 concentrations and fasting-only participants were excluded from the analysis (Table 6).
HRs (95% CIs) of T2D, MI, and Stroke for the Highest vs the Lowest Quartile of FABP4 Concentrations
| Exclusions | Cases/Noncases | HR (95% CI)a | Ptrend | Cases/Noncases | HR (95% CI)a | Ptrend | Cases/Noncases | HR (95% CI)a | Ptrend |
|---|---|---|---|---|---|---|---|---|---|
| Q4 vs Q1 | Q4 vs Q1 | Q4 vs Q1 | |||||||
| First 2 y of study follow-up | 727/2121 | 1.81 (1.21–2.70) | 0.004 | 199/2161 | 0.94 (0.55–1.60) | 0.67 | 180/2161 | 1.33 (0.802.32) | 0.31 |
| Extreme FABP4 concentrationsb | 714/2080 | 1.84 (1.22–2.77) | 0.003 | 202/2119 | 0.93 (0.55–1.57) | 0.71 | 185/2119 | 1.41 (0.80–2.46) | 0.22 |
| Fasting participantsc | 504/1524 | 1.73 (1.07–2.77) | 0.03 | 137/1550 | 0.68 (0.37–1.26) | 0.22 | 121/1546 | 1.34 (0.66–2.72) | 0.45 |
Abbreviation: Q, quartile.
The multivariable model is adjusted for sex, physical activity, smoking, educational attainment, consumption of alcoholic beverages, consumption of whole grain bread, consumption of red meat, consumption of coffee, prevalent hypertension, fasting status, BMI, and waist circumference.
Defined as values below the 1st percentile (5.9 ng/mL) and above the 99th percentile (53.1 ng/mL) of FABP4 distribution.
Because of the large number of nonfasting participants, analysis was controlled excluding fasting participants.
Discussion
In this prospective cohort study, higher circulating plasma FABP4 concentrations were associated with a statistically significantly higher risk of incident T2D. Higher FABP4 concentrations were also associated with a higher risk of stroke predominantly among men. In contrast, higher circulating FABP4 concentrations were not associated with a higher risk of MI.
Increased body fat is a major determinant of circulating FABP4 because of the secretory activity of adipocytes and macrophages (30). Serum FABP4 concentrations have been pronouncedly elevated in obesity both in animal and human research and have been strongly correlated with metabolic complications (1, 2). Circulating FABP4 was shown to act as an active adipokine that contributes to hyperglycemia by promoting hepatic gluconeogenesis and interfering with peripheral insulin action (31). FABP4 was suggested to promote hypertriacylglycerolaemia and proinflammatory gene expression (32). Blocking FABP4 signaling was shown to improve insulin sensitivity, allowing better glucose utilization by tissues and decreased glucose production by the liver (31). In contrast to the aforementioned detrimental effects of FABP4 on glucose homeostasis, FABP4 has also been shown to increase glucose-stimulated insulin secretion in humans (29), potentially enhancing insulin secretion during obesity. Experimental evidence suggests here a close feedback loop, with insulin inhibiting FABP4 release from adipocytes (29). In our study, individuals with higher serum FABP4 were at a higher risk for developing T2D and there was a residual risk even after obesity measures, namely BMI and waist circumference, were controlled for in the analyses.
These findings lay within previous lines of research coming from prospective cohort studies (9–11, 33). For example, each SD unit increase in FABP4 concentrations was associated with a 1.32-fold higher risk of T2D (95% CI 0.99 to 1.76) in a large Swedish cohort study (11). In a Chinese prospective cohort study, FABP4 concentrations above vs below the sex-specific median were associated with a doubling in risk of T2D (9). However, in those previous studies no data on waist circumference measurements were available and the reported findings did not account for potential influence of other metabolic biomarkers. The etiological role of FABP4 in metabolic diseases was questioned by some studies, such as the Women's Health Initiative Observational Study (34). This large prospective cohort study of postmenopausal women did not report statistically significant associations between common variants in FABP4 gene and T2D risk. However, data from the Cardiovascular Health Study, conducted among 3190 European Americans and 660 African Americans suggested that FABP4 variants account for a minor fraction of variability of circulating FABP4 (<1% for individual single nucleotide polymorphisms), which limits their usefulness as instrumental variables to investigate causality (35). Noteworthy, associations between common variants and haplotypes in the FABP4 gene were associated with lower plasma FABP4 concentrations in the Cardiovascular Health Study but with higher fasting glucose levels in the Meta-Analyses of Glucose and Insulin-related traits Consortium (33). Paradoxically, in our data high FABP4 was associated with higher risk of T2D particularly in people with BMI < 25 kg/m2. Similar to our findings, the association of FABP4 with T2D risk was also most pronounced in persons with BMI < 25kg/m2 compared with those with BMI > 25 kg/m2 in the abovementioned Cardiovascular Health Study (8). It was previously shown that circulating FABP4 levels increase after bariatric surgery potentially as a result of increased lipolytic activity during massive weight loss (36). To explain this paradoxical phenomenon, more research is needed on the role of fat mass dynamics and nutritional status reflected by circulating FABP4 changes. Further prospective studies would be also needed to confirm the observed association between circulating FABP4 and T2D in our analyses and shed light on the underlying biological pathways.
In our data, higher FABP4 concentrations were not associated with a higher risk of MI. These findings seem to be in contrast to several previously published cross-sectional and case-control studies that collectively demonstrated higher FABP4 levels among patients with coronary artery disease (37–39). However, based on these studies, it was not possible to evaluate whether elevated FABP4 concentrations are a cause or consequence of CVD. Comparison with previous studies is also hampered by the fact that most have been conducted among individuals with prevalent metabolic disturbances. Thus, an association between FABP4 and CVD was reported in patients with end-stage renal disease (40) or pre-existing coronary heart disease (41, 42). Although FABP4 have been shown to be elevated in patients with MI (43), evidence has been more contradictory among prospective studies conducted in apparently healthy individuals as in our study. Serum FABP4 levels exhibited a positive association with CVD risk in a Chinese study (44) and no association with CVD risk was reported in a Swiss study (41). The biological pathways potentially linking FABP4 and CVD beyond established metabolic triggers are also unclear. Our data did not show differences in the observed associations according to adiposity level and no statistically significant effect modification of BMI or waist circumference on the association between FABP4 and risk of MI could be seen. In apoplipoprotein E-deficient mice with impaired plasma lipoprotein clearing and rapid development of atherosclerotic lesions, FABP4 knockout or its chemical inhibition has been shown to result in reduced atherosclerotic plaque formation (5). FABP4 was suggested to exhibit its atherogenic effects locally via its actions in macrophages, coronary smooth muscle cells and endothelial cells (45). However, systemic effects of circulating FABP4 as measured in our study in relation to CVD remain to be evaluated.
Interestingly, our data suggested that higher circulating concentrations of FABP4 are associated with a higher risk of stroke predominantly among men, and no such pronounced association could be observed in women. Similarly elevated risk in men but not in women was observed with regards to adiposity measures in a large Spanish cohort (46). It could be therefore speculated that differential expression of FABP4 in adipose tissue of men and women could provide an explanation to current findings. To test this hypothesis, we adjusted the analyses for adiposity parameters, however, the associations remained unaltered. In addition, our analyses revealed a tendency of a positive association between FABP4 and stroke risk that was restricted to lean individuals, though the P value for interaction between FABP4 and BMI categories was not statistically significant. These data may suggest direct effects of FABP4 in stroke pathogenesis, independent from adiposity as previously postulated (16). However, whether and why FABP4 could be involved in cerebrovascular pathologies in a sex-specific manner has not been addressed by previous studies. The interpretation of our data is further hampered by the low number of cases in stratified analyses. Therefore, more studies with sufficient sample size to allow evaluation of the associations by sex would be needed to confirm our findings.
In addition to analyses where FABP4 was explored as etiological factor, we also addressed the question whether FABP4 would add value to risk prediction models. In our data, we observed that the estimated improvement with the use of reclassification methods depended on the reference model. As the comparison model including adiposity measures (BMI and waist circumference) became stronger, the utility of adding FABP4 became weaker. When it was added to models with the lifestyle variables, reclassification measures suggested an improvement most notable for T2D with NRI(>0) of 0.41 and rIDI of 0.27. Compared with a reference model that additionally included BMI and waist circumference, the improvement was smaller with NRI(>0) of 0.09 and rIDI of 0.03. Thus, despite suggested associations the clinical utility of FABP4 beyond adiposity measures remains questionable because of a lack of substantial model improvement.
Strengths of our study include the large sample size allowing stratified analyses and the long follow-up of the study, allowing us to account for potential confounding factors and for reverse causality. However, some methodological issues deserve consideration. Because we used a case-cohort design with a large subcohort, our risk estimates are expected to be generalizable to the source population, however, generalizability may be limited to populations with comparable characteristics. The use of anticoagulants, statins, and antihypertensives among persons with pre-existing diseases has been shown to be associated with increased FABP4 levels (39, 47). Our study was conducted in a general population, all individuals with prevalent CVD or diabetes were excluded from analyses, and we adjusted for the presence of hypertension. Therefore, it is unlikely that our results are influenced by intake of medications. Because we measured FABP4 in serum our results do not rule out that FABP4 may have different effects on the tissue levels. A single assessment of FABP4 may be susceptible to short-term variation, which would bias the results toward the null. However, we found intraindividual FABP4 levels to be reasonably stable over time, with an intraclass correlation coefficient of 0.73 for FABP4 levels measured within participants 4 months apart (27). Accurate classification of cases and noncases is important to obtain valid risk estimates for the association between the investigated biomarkers and disease risk. Because all self-reports were confirmed by the diagnosing physician, we expect the proportion of false positives to be negligible in our study. Nevertheless, we cannot exclude the possibility of false-negative cases resulting from undiagnosed disease or reporting failure. However, we attempted to reduce this number by extending the medical verification procedure to individuals reporting stroke symptoms, diabetes-relevant medication, and dietary treatment owing to diabetes in the follow-up questionnaires.
In conclusion, these data support the hypothesis that elevated FABP4 levels may contribute to T2D risk. In contrast, the data did not support the hypothesis that circulating FABP4 may be relevant for MI, whereas the potential association with stroke in men would require further evaluation
Acknowledgments
We thank the Human Study Centre (HSC) of the German Institute of Human Nutrition Potsdam-Rehbrücke, namely the trustee and the data hub for the processing, and the participants for the provision of the data; the biobank for the processing of the biological samples; and the head of the HSC, Manuela Bergmann, for contributing to the study design and leading the underlying processes of data generation. Furthermore, we thank all EPIC-Potsdam participants for their invaluable contribution to the study.
Financial Support: This study was partly supported by grants from the Federal Ministry of Education and Research, Germany (Bundesministerium für Bildung und Forschung, Förderkennzeichen 0315381A).
Additional Information
Disclosure Summary: The authors have nothing to disclose.
Data Availability: The datasets generated during and/or analyzed during the current study are not publicly available but are available from the corresponding author on reasonable request.
Abbreviations:
- BMI
body mass index
- BP
blood pressure
- CVD
cardiovascular disease
- EPIC
European Prospective Investigation into Cancer and Nutrition
- FABP4
fatty acid–binding protein
- GGT
γ-glutamyl transferase
- HbA1C, glycated hemoglobin
HDL-C
- high-density lipoprotein cholesterol
HR
- hazard ratio
hs-CRP
- high-sensitivity C-reactive protein
IDC-10
- International Classification of Diseases
10th Revision
- MI
myocardial infarction
- NRI
net reclassification improvement
- rIDI
relative integrated discrimination improvement
- T2D
type 2 diabetes
