


Abstract
Diabetes mellitus is conventionally associated with an increased risk of cancer; however, inverse associations of diabetes with prostate cancer are well described. Mechanisms are unclear, although hormonal factors, including alterations in sex hormone and IGF1 concentrations due to metabolic disturbances, have been hypothesized to play a role.
To assess sex hormones, IGF1, glucose, and advanced glycation end products (AGEs) as potential mediators of the association between diabetes mellitus and prostate cancer.
Longitudinal cohort study. The association of baseline diabetes with prostate cancer incidence was assessed using proportional hazards competing risks analysis in 3149 men followed for 12 years. Baseline hormone, glucose, and carboxymethyllysine (CML) levels were examined as potential mediators of this association.
Diabetes was associated with a lower prostate cancer risk (fully adjusted subhazard ratio, 0.63; 95% CI, 0.43 to 0.92; P = 0.017). This association was unchanged after accounting for testosterone, DHT, estradiol, or SHBG. Similarly, the addition of IGF1 or its binding proteins 1 and 3, or glucose, did not alter this association. CML was not associated with the risk of prostate cancer, and additional correction for CML in the fully adjusted model did not alter the inverse association of diabetes and prostate cancer risk.
In this study, alterations in sex hormone, IGF1, glucose, and CML levels did not account for the inverse association of diabetes and prostate cancer risk. Further studies are required to provide more insight into underlying causes of this association.
Diabetes mellitus is typically associated with an increased risk of cancer; however, an inverse association between diabetes and prostate cancer risk has been observed (1–5). The reason for this is unclear and several mechanisms have been postulated. Alterations in hormone concentrations have been hypothesized to be a mediator of this association in men with type 2 diabetes mellitus. The prostate gland is an androgen sensitive organ, and lower testosterone (T) concentrations have been observed in men with type 2 diabetes (6). It has therefore been postulated that lower T may have a protective effect on prostate cancer risk in men with type 2 diabetes. IGF1 is bound to IGF binding proteins (IGFBPs) in the circulation (7). Insulin both directly and indirectly modulates IGF1 actions. Insulin increases the synthesis of IGF1 and decreases the production of IGFBP1 (7). Long-term type 2 diabetes is associated with hypoinsulinemia, potentially decreasing IGF1 production while increasing IGFBP1 concentrations and reducing bioavailable IGF1 in the circulation. Because IGF1 is trophic, it has also been postulated that this may be another mechanism in which type 2 diabetes may be associated with a decreased risk of prostate cancer.
Despite this, associations of hormones and prostate cancer risk are not clearly established. Meta-analyses of T and prostate cancer risk have shown conflicting results. In an earlier meta-analysis, neutral associations of T and prostate cancer risk were reported, whereas a more recent meta-analysis demonstrated a reduced risk of prostate cancer in men with the lowest 10th of calculated free T (8, 9). Most of the studies included in these meta-analyses used immunoassays for measurement of T. This method of sex hormone measurement is associated with assay-dependent bias and nonspecificity, and it is less precise compared with methods such as liquid chromatography–tandem mass spectrometry (LC-MS/MS) (10, 11). Furthermore, T is a prohormone and is converted to the more potent androgen DHT by 5α-reductase, and to estradiol (E2) by aromatase (12, 13). Few studies have assessed associations of LC-MS/MS measured T, DHT, and E2 with prostate cancer risk. A meta-analysis showed an association of higher IGF1 with increased risk of prostate cancer (14); however, the largest prospective studies of IGF1 and prostate cancer risk showed neutral associations (15–17). Few studies have assessed associations of IGFBPs with prostate cancer risk, and results from available studies are conflicting (18, 19).
Advanced glycation end products (AGEs) are proteins or lipids that have been nonenzymatically oxidized in a hyperglycemic environment and are implicated in diabetic-associated vascular complications [for review, see (20)]. AGEs have not been extensively studied in prostate cancer risk; however, existing studies suggest adverse effects of AGEs on prostate cancer proliferation (21) and prostate cancer risk (22). AGEs may also accumulate from aging and other chronic disease (20), and therefore further correction for AGEs may account for residual confounding from these processes.
The aim of our study was to assess associations of diabetes and prostate cancer risk in a cohort of older men, and to assess whether these associations may be mediated through hormonal factors, including sex hormones, GHs, or its binding proteins. We assessed whether factors intrinsic to the pathophysiology of type 2 diabetes, including glucose and insulin resistance, may affect these associations. Furthermore, we assessed associations of the stable AGE compound carboxymethyllysine (CML) with prostate cancer risk and determined whether additional correction for CML changed the association of diabetes and prostate cancer risk.
Methods
Study design and population
This is a longitudinal cohort study using men from the Health in Men Study based in Perth, Western Australia. Methods for recruitment and details of this cohort have been previously described (23). A flowchart on how the current study cohort was derived is shown in Fig. 1. Between 1996 and 1999, 12,203 men attended abdominal aortic aneurysm screening and completed a health questionnaire and physical examination as part of a randomized controlled trial for abdominal aortic aneurysm screening (termed wave 1 of data collection). Between 2001 and 2004, 4249 men responded to an invitation to attend a follow-up survey and physical examination and provided early morning blood samples (termed wave 2 of data collection). The study protocol was approved by the Human Research Committee of Western Australia, and all men provided informed consent to participate in the study. Information from wave 1 and wave 2 was used to identify lifestyle habits, medication use, and anthropometry. The Western Australian Data Linkage System (WADLS) was used to identify baseline comorbidities and outcome events. This is a centralized system that captures data from death and cancer registries (established in 1981), hospital morbidity data (which includes medical diagnoses from public and private hospital admissions), and the Mental Health Information System in Western Australia (24). A previous diagnosis of diabetes mellitus, self-reported use of oral hypoglycemic therapy or insulin, a fasting blood glucose of ≥7.0 mmol/L, or a random blood glucose of ≥11.0 mmol/L was used to define diabetes in this cohort. Prostate cancer outcomes were identified until June 2013 through the WADLS using the International Classification of Diseases 10th edition code C61. In Western Australia, it is mandatory to notify the cancer registry of cancer diagnoses (25, 26). Notification is made by the examining specialist who becomes aware that a specimen indicates a malignancy, a radiation oncologist who treats a person for cancer, or an ophthalmologist who makes a diagnosis of an ocular melanoma (26).
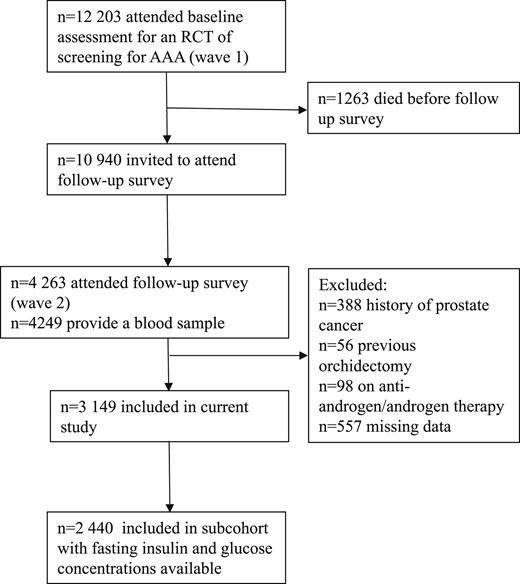
Diagram depicting the current study cohort that was derived from 12,203 men who participated in a health questionnaire and physical examination as part of a randomized controlled trail (RCT) for abdominal aortic aneurysm (AAA) screening.
Laboratory assays
Fasting blood samples were collected at wave 2 between 8:00 am and 10:30 am. Plasma was immediately prepared and stored at −80°C until assayed. T, DHT, and E2 were quantified within a single LC-MS/MS run without derivatization using atmospheric pressure photoionization in positive mode for androgens and negative mode with electrospray ionization for estrogens using 200-μL samples as previously reported (27, 28). Precision profiles displayed coefficients of variation (CVs) of <6% for serum T levels (>0.4 nmol/L), <13% for DHT levels (>0.7 nmol/L), and <8% for serum E2 levels (>25 pmol/L). LH and SHBG levels were determined via chemiluminescent immunoassays on an Immulite 2000 analyzer (Diagnostic Products Corp., Biomediq, Doncaster, VIC, Australia) with CVs of <7% for both hormones (29). IGF1 and IGFBP1/IGFBP3 were quantified using reagent kits of single lot numbers from Diagnostics Systems Laboratories (supplied by Beckman Coulter, Gladesville, NSW, Australia) as previously reported (30). The kits used include the nonextraction IGF1 ELISA, the total IGFBP1 ELISA, and the active IGFBP3 ELISA kits. The assays were automated using a Grifols Triturus ELISA processor (Vital Diagnostics, Castle Hill, NSW, Australia). CVs were 12.2% and 8.6% at 117 and 216 μg/L IGF1, 8.6% and 5.2% at 3.1 and 49 μg/L IGFBP3, and 16.8% and 4.4% at 540 and 4300 μg/L IGFBP3. Serum glucose was measured using a Roche Hitachi 917 analyzer with a between-day imprecision of 2.2% to 2.9%. Serum insulin was measured using an analyzer (Elecsyc 2010; Roche Diagnostics, Rotkreuz, Switzerland) with a between-day imprecision assay ranging from 3.3% to 4.6% with the local laboratory range of <12 mU/L. The homeostasis model assessment of estimated insulin resistance (HOMA-IR) was calculated with fasting glucose and insulin levels using an updated computerized method (HOMA2-IR) (31). CML was measured using a validated indirect ELISA with an interassay CV of 7.9% (32).
Statistical analysis
Statistical analysis was performed using Stata version 13.1 (StataCorp, College Station, TX). Longitudinal analysis was carried out using proportional hazards competing risks analysis with death as a competing factor. Adjustments were made for age, body mass index, physical activity (≥150 min/wk of vigorous physical activity), alcohol intake, smoking status (ex-smoker, nonsmoker, or current smoker), and history of previous cancer. Hormone variables including T, SHBG, IGF1, and its IGFBP1/IGFBP3 were individually added into the fully adjusted model to assess whether this changed the association of diabetes and prostate cancer risk. The inclusion of these variables in the model was based on a priori hypotheses that these factors may account for the inverse association of diabetes and prostate cancer risk, and were not predicated on showing differences in hormone variables between groups. We also examined CML, glucose, and HOMA2-IR (calculated in men with fasting insulin measurements available) as potential modulating factors because these relate to the underlying pathophysiology of type 2 diabetes.
Results
After excluding men with a history of prostate cancer (n = 388), men who had previous orchidectomy (n = 56), men who were on androgen/antiandrogen therapy at baseline (n = 98), and men with missing hormone data (n = 557), there were 3149 men in the data set. Of these, 450 men had diabetes at baseline, and 315 men were diagnosed with prostate cancer during the follow-up period. In a subset of 2440 men with data for fasting insulin and glucose levels, there were 253 men who were diagnosed with prostate cancer.
Baseline characteristics
The mean age of the cohort was 76.9 ± 3.6 years. In total, 450 (14.3%) of the men in this cohort had diabetes. Compared with men without diabetes, men with diabetes had a higher body mass index (27.5 ± 3.9 vs 26.5 ± 3.6 kg/m2; P < 0.001) and lower T (11.4 ± 4.3 vs 13.4 ± 4.9 nmol/L; P < 0.001), DHT (1.21 ± 0.70 vs 1.47 ± 0.73 nmol/L; P < 0.001), and SHBG (38.2 ± 15.3 vs 43.3 ± 17.0 nmol/L; P < 0.001) concentrations (Table 1). IGF1 concentrations were higher in men with diabetes (146.2 ± 66.0 vs 140.2 ± 50.7 μg/L; P = 0.045), whereas IGBFP3 concentrations were lower (3657.9 ± 1069 vs 3779.7 ± 862 μg/L; P = 0.008). CML was higher in men with diabetes compared with men without; however, this difference was not significant (Table 1). Men with diabetes had higher glucose levels (7.80 ± 2.86 vs 5.46 ± 0.59 mmol/L; P < 0.001) and higher HOMA2-IR values (1.51 ± 1.47 vs 1.00 ± 0.63; P < 0.001) (Table 1).
Baseline Characteristics, Biochemical Details, and Demographic Details for the Entire Cohort and in Men Who Had a History of Diabetes
| Variable | Entire Sample (n = 3149) | History of Diabetes | ||
|---|---|---|---|---|
| No (n = 2699) | Yes (n = 450) | P Value | ||
| Mean ± SD | ||||
| Age, y | 76.9 ± 3.6 | 77.0 ± 3.7 | 76.6 ± 3.3 | 0.007 |
| Body mass index, kg/m2 | 26.5 ± 3.6 | 26.3 ± 3.5 | 27.5 ± 3.9 | <0.001 |
| T, nmol/L | 13.2 ± 4.8 | 13.4 ± 4.9 | 11.4 ± 4.3 | <0.001 |
| DHT, nmol/L | 1.43 ± 0.73 | 1.47 ± 0.73 | 1.21 ± 0.70 | <0.001 |
| E2, pmol/L | 73.5 ± 28.7 | 73.9 ± 28.8 | 71.2 ± 28.2 | 0.068 |
| SHBG, nmol/L | 42.6 ± 16.8 | 43.3 ± 17.0 | 38.2 ± 15.3 | <0.001 |
| IGF1, μg/L | 141.1 ± 58.1 | 140.2 ± 56.7 | 146.2 ± 66.0 | 0.045 |
| IGFBP1, μg/L | 26.9 ± 20.6 | 26.8 ± 20.0 | 27.3 ± 24.4 | 0.635 |
| IGFBP3, μg/L | 3762.3 ± 896 | 3779.7 ± 862 | 3657.9 ± 1069 | 0.008 |
| CML, nmol/mol | 1431.4 ± 1165.2 | 1429.2 ± 1157 | 1444.4 ± 1212 | 0.798 |
| Glucose, mmol/L | 5.71 ± 1.48 | 5.46 ± 0.59 | 7.80 ± 2.86 | <0.001 |
| HOMA2-IRa | 1.06 ± 0.81 | 1.00 ± 0.63 | 1.51 ± 1.47 | <0.001 |
| n (%) | ||||
| Smoking | 0.012 | |||
| Never smoked | 1054 (33.5) | 928 (34.4) | 126 (28) | |
| Ex-smoker | 1914 (60.8) | 1612 (59.8) | 302 (67.1) | |
| Current smoker | 180 (5.7) | 158 (5.9) | 22 (4.9) | |
| Alcohol, drinks per week | 0.112 | |||
| Nondrinker | 439 (14.7) | 363 (14.1) | 76 (17.4) | |
| <15 | 1994 (67) | 1711 (66.9) | 283 (64.8) | |
| 15–28 | 425 (14.2) | 360 (14.1) | 65 (14.9) | |
| >28 | 138 (4.6) | 125 (4.9) | 13 (3.0) | |
| Vigorous physical activity | ||||
| ≥150 min/wk | 730 (23.2) | 631 (23.4) | 99 (22.0) | 0.516 |
| Prostate cancer | 315 (10.0) | 283 (10.5) | 32 (7.1) | 0.027 |
P values are for t tests or Pearson χ2 test as appropriate, comparing diabetic and nondiabetic groups. Results are reported as mean and SD for continuous variables, and as percentages for categorical variables.
n = 2440.
Association of diabetes with prostate cancer risk
In the univariate analysis, a history of diabetes was associated with a decreased risk of prostate cancer [subhazard ratio (SHR), 0.66; 95% CI, 0.46 to 0.98; P = 0.028] (Table 2). This association was similar after accounting for conventional risk factors (SHR, 0.63; 95% CI, 0.43 to 0.92; P = 0.017) (Table 2).
Competing Risks Proportional Hazards Models for the Association of Diabetes and Prostate Cancer Risk
| Prostate Cancer (n = 315) | ||
|---|---|---|
| SHR (95% CI) | P Value | |
| Univariate | 0.66 (0.46, 0.96) | 0.028 |
| Fully adjusteda | 0.63 (0.43, 0.92) | 0.017 |
| Fully adjusted + T | 0.63 (0.43, 0.93) | 0.020 |
| Fully adjusted + DHT | 0.64 (0.43, 0.94) | 0.023 |
| Fully adjusted + E2 | 0.63 (0.43, 0.93) | 0.020 |
| Fully adjusted + SHBG | 0.62 (0.43, 0.92) | 0.016 |
| Fully adjusted + IGF1 | 0.63 (0.43, 0.92) | 0.018 |
| Fully adjusted + IGFBP1 | 0.64 (0.43, 0.93) | 0.021 |
| Fully adjusted + IGFBP3 | 0.63 (0.43, 0.92) | 0.017 |
| Fully adjusted + glucose | 0.56 (0.35, 0.89) | 0.015 |
| Fully adjusted + CML | 0.63 (0.43, 0.92) | 0.018 |
Results are reported as SHRs and their corresponding 95% CIs and P values.
Adjustments were made for age, body mass index, physical activity, alcohol intake, smoking status, and history of previous cancer in the fully adjusted model.
Association of diabetes and prostate cancer risk after accounting for individual hormone variables
Hormone variables, glucose, and CML were individually added into the fully adjusted model to assess whether the inverse association of diabetes and prostate cancer risk was mediated through these factors. The addition of sex hormones including T, DHT, or E2 in the fully adjusted analysis did not change this association (Table 2). Similarly, addition of SHBG did not affect the association of diabetes and prostate cancer risk. When IGF1, IGFBP1, or IGBP3 were added into the fully adjusted model, the associations of diabetes and prostate cancer risk did not change (Table 2). Similarly, the association remained unchanged with the addition of glucose into the fully adjusted analysis. CML was not associated with prostate cancer risk in this cohort of men (fully adjusted SHR, 0.95; 95% CI, 0.84 to 1.06; P = 0.351 for every SD increase in CML). Likewise, CML did not alter associations of diabetes and prostate cancer risk (Table 2).
Association of diabetes and prostate cancer risk in men with fasting insulin levels
In men who had fasting insulin levels available, diabetes was inversely associated with prostate cancer risk; however, this association was not statistically significant (fully adjusted SHR, 0.67; 95% CI, 0.43 to 1.04; P = 0.071) (Table 3). The addition of HOMA2-IR into the fully adjusted model did not alter this association.
Competing Risks Proportional Hazards Models for the Association of Diabetes and Prostate Cancer Risk in a Subset of Individuals With Fasting Insulin Levels Available
| Prostate Cancer (n = 253) | ||
|---|---|---|
| SHR (95% CI) | P Value | |
| Univariate | 0.73 (0.47, 1.11) | 0.142 |
| Fully adjusteda | 0.67 (0.43, 1.04) | 0.071 |
| Fully adjusted + HOMA2-IR | 0.70 (0.45, 1.10) | 0.126 |
| Prostate Cancer (n = 253) | ||
|---|---|---|
| SHR (95% CI) | P Value | |
| Univariate | 0.73 (0.47, 1.11) | 0.142 |
| Fully adjusteda | 0.67 (0.43, 1.04) | 0.071 |
| Fully adjusted + HOMA2-IR | 0.70 (0.45, 1.10) | 0.126 |
Results are reported as SHRs and their corresponding 95% CIs and P values.
Adjustments were made for age, body mass index, physical activity, alcohol intake, smoking status, and history of previous cancer in the fully adjusted model.
Discussion
In this cohort of men ≥70 years of age, diabetes was associated with an ∼35% reduction in risk of prostate cancer after accounting for conventional risk factors. Men with a history of diabetes had an altered hormone profile compared with men without diabetes. Men with diabetes had lower androgens, higher IGF1, and lower IGFBP3 concentrations. The association of lower prostate cancer risk in men with diabetes was not explained by differences in sex hormones, IGF1, or IGFBP1 and IGFBP3. Men with diabetes had higher blood glucose levels and were more insulin resistant; however, neither blood glucose levels, insulin resistance, or CML concentrations accounted for associations of diabetes and prostate cancer risk.
Prostate cancer is an androgen-dependent cancer, and previous authors have hypothesized that lower T in patients with type 2 diabetes may account for decreased prostate cancer risk seen in these patients (1–5). A high frequency of hypogonadotropic hypogonadism has been reported in men with type 2 diabetes (33–35). This is in keeping with lower androgen levels observed in men with diabetes in this cohort. Despite this, the role of androgens in the development of prostate cancer is still unclear. A recent meta-analysis of 20 prospective studies found a reduced risk of prostate cancer in men with the lowest 10th of calculated free T concentrations (9). Associations of DHT and E2 were not assessed in that meta-analysis. In contrast, an earlier meta-analysis of 18 prospective studies found no associations of T, DHT, or E2 with prostate cancer risk (8). Most studies included in both meta-analyses used sex hormones measured via immunoassay. Few studies assessing associations of sex hormones and prostate cancer outcomes have utilized LC-MS/MS for measurement of sex hormone concentrations. We have previously reported no associations of T, DHT or E2 with prostate cancer risk in this cohort (36). Similarly, the Osteoporotic Fractures in Men study, which also consisted of an older population, found no associations of T or E2 with prostate cancer risk in 275 cases and 1652 noncases of men followed for 4.7 years (37). Conversely, in a study of 3255 middle-aged men whereby 819 prostate cancer cases occurred, higher T was associated with prostate cancer risk in men with T <10 nmol/L, but not in the entire cohort (38). Endocytic pathways for cellular uptake and action of sex steroids bound to SHBG have previously been described (39), suggesting an alternate pathway in which SHBG may modulate effects of sex hormones. Men with diabetes have lower SHBG concentrations (40), and this is in line with observations in our study. However, results from our study suggest that the risk of prostate cancer was unchanged after correcting for SHBG. Overall, our results do not support sex hormones or SHBG as the mediator of lower prostate cancer risk in men with diabetes.
Changes to the GH axis in men with type 2 diabetes has also been hypothesized to play a role in the inverse association of diabetes and prostate cancer risk (1, 3–5). Circulating IGF1 is predominantly modulated by GH secretion; however, other factors such as insulin may also influence IGF1 concentrations, with studies demonstrating a direct association between IGF1 and insulin concentrations in patients with type 2 diabetes (7, 41). The bioavailability of IGF1 is further modulated by its binding to IGFBPs 1 to 6, as well as insulin suppresses IGFBP1 secretion (7, 42). Whereas type 2 diabetes is initially characterized by insulin resistance, long-term diabetes mellitus is associated with progressive β-cell failure and decreasing insulin secretion (43). It is therefore postulated that hypoinsulinemia, which accompanies long-term type 2 diabetes, may lead to decreased circulating IGF1 and increased IGFBP1 secretion, thus further decreasing bioavailability of IGF1. A meta-analysis has previously shown an increased risk of prostate cancer with higher IGF1 levels (14). Another meta-analysis demonstrated a lower risk of prostate cancer in men with a longer duration of diabetes (≥10 years) but not in men with diabetes of a shorter duration (1). These results support the hypothesis that decreased actions of IGF1 in patients with long-term diabetes may account for decreased prostate cancer risk in these patients. Despite this, we have previously reported no significant associations of IGF or IGFBP1/IGFBP3 with prostate cancer risk in this cohort (44), and other prospective studies in this area show neutral associations of IGF1 and prostate cancer risk (15–17), Moreover, we found higher concentrations of IGF1 in men with type 2 diabetes in this cohort, which was of borderline significance. In our study, neither IGF1 nor IGFBP1 or IGFBP3 changed the association of diabetes and prostate cancer risk in older men. Results from our study suggest that the association of diabetes and prostate cancer in men is independent of IGF1 and IGFBP1/IGFBP3; however, information regarding duration of diabetes was not available for this cohort of men.
Type 2 diabetes is characterized by insulin resistance leading to increased circulating glucose concentrations (43). We therefore assessed whether factors intrinsic to the pathophysiology of type 2 diabetes may account for associations of diabetes and prostate cancer risk. As expected, men with diabetes had higher glucose and insulin resistance (as measured by the HOMA2-IR) compared with men without diabetes. Adjustment for glucose levels did not alter the association of diabetes with prostate cancer risk in this population. In a subset of men with fasting insulin levels available, diabetes was inversely associated with prostate cancer risk; however, these results were not significant, although the power to detect significant associations was reduced in this subcohort of men due to a lower number of outcomes. The addition of HOMA2-IR into the fully adjusted model did not alter the direction of association between diabetes and prostate cancer risk in this subset of men; however, this finding requires confirmation in larger prospective studies.
AGEs are formed in a hyperglycemic environment and are implicated in vascular complications of diabetes (20). Despite higher blood glucose levels in men who had diabetes in this cohort, CML levels did not significantly differ in men with diabetes compared with those without. A positive correlation between CML and blood glucose level has previously been demonstrated in this cohort of men (32). It is plausible that wider interindividual variation in CML may account for nonsignificant differences between the two groups. The receptor for AGEs is expressed in prostate cancer, and the AGE–receptor for AGEs interaction is associated with prostate cancer cell proliferation (21). Few studies have assessed associations of AGEs and prostate cancer risk. Results from our study differ from a prospective study of 24 prostate cancer cases that reported higher CML concentrations in cases vs matched controls (22). In our study, which included 348 cases of prostate cancer, no associations of CML were seen with prostate cancer risk. Similarly, the addition of CML into the fully adjusted model did not alter the association between diabetes and prostate cancer risk in this population.
In this study, the inverse association of diabetes and prostate cancer risk was neither mediated through hormonal factors or through pathophysiological changes associated with diabetes. Prostate cancer is an age-related cancer (45). Because our population consisted of older men and diabetes is associated with increased mortality, it is possible that our results may be affected by competing risks or be biased toward men who have favorable biologic or lifestyle factors. Although the competing risk of death was taken into account in this study, residual bias may still be present. In a recent study, a latent class regression method for analysis of competing risk was used to assess the association of type 2 diabetes and prostate cancer risk. In that study, heterogeneity in risk of prostate cancer was assessed within a population of 126,482 men with 6036 cases of prostate cancer during a 6-year follow-up period (46). Unlike conventional methods of survival analysis, a latent class regression analysis does not assume homogeneous associations between covariates and the studied endpoints. Instead, a latent class analysis can be used to identify whether a population can be divided into subclasses with differing associations with the studied endpoint. In that study, conventional methods of survival analysis, including competing risk analysis, showed an inverse association of type 2 diabetes and prostate cancer risk (46). However, when a latent class model was used, there was a high probability of two distinct classes within the population, with a higher risk of prostate cancer observed in the class consisting of men who were frailer (46). The risk of prostate cancer was more strongly associated with class membership rather than individual risk factors, and type 2 diabetes was not associated with prostate cancer risk using this method of analysis (46). It is therefore plausible that the association of type 2 diabetes and prostate cancer risk is biased by the way competing risks are conventionally handled in epidemiological studies.
Limitations of this study include the observational nature of this research. This population included older white men, and therefore results from this study cannot be generalized to men of a different age or race. Similarly, men from this study were previous participants of a randomized controlled trial, and therefore a “healthy survivor” effect is possible. Serial biochemistry measurements were not available for this study and we did not measure “free” IGF1 or IGF1 bioactivity, rather total IGF1 was used as a measure of IGF1 status. This study was not originally designed to examine prostate cancer outcomes. Cases of prostate cancer were identified through the WADLS and men were not screened for prostate cancer. Therefore, subclinical disease may have been missed; however, results would be reflective of clinically relevant prostate cancers. In this study, a significant difference in T, DHT, SHBG, and IGFBP3 was observed in men with diabetes compared with those without. The difference in IGF1 was borderline in the context of multiple comparisons, and there was no between-group difference in E2, IGFBP1, or CML concentrations. Therefore, our results may be less informative for E2, IGFBP1, or CML. Strengths of this study include a large population of a narrow age range and a long period of follow-up. The WADLS was used to capture outcome events, allowing near complete follow-up for this population. Furthermore, systematic adjustments for confounders that may influence the association of diabetes and prostate cancer risk were applied.
In conclusion, older men with diabetes mellitus have a lower risk of prostate cancer after adjusting for potential confounders. This inverse association was not mediated through sex hormones, SHBG, IGF1 or its binding proteins, or glucose concentrations. Our results do not suggest a role for insulin resistance in mediating this association; however, this requires confirmation in larger studies. In older men, CML was not associated with prostate cancer risk. These results require validation in other cohorts of varying ages. Further research into potential mediators of decreased prostate cancer risk in men with diabetes is required, and ongoing studies are required to assess whether statistical methods in which competing risks are conventionally handled may account for bias in results of current epidemiological studies.
Acknowledgments
We thank the staff of PathWest Laboratory Medicine, Fremantle, and Royal Perth Hospitals, Perth, and the ANZAC Research Institute, Sydney, and Johnson Setoh and Seamus Duffy for excellent technical assistance. We thank Sylvia Johnson of Diagnostics Systems Laboratories Australia for specialist help in setting up the IGF1 and IGFBP assays. We thank the Data Linkage Unit, Health Department of Western Australia, for their assistance. We especially thank all of the men and staff who participated in the Western Australian Abdominal Aortic Aneurysm Program and the Health in Men Study.
Financial Support: Hormone assays and the Health in Men Study were funded by Project Grants 279408, 379600, 403963, 513823, 634492, 1045710, and 1060557 from the National Health and Medical Research Council of Australia. Y.X.C. is supported by the Warren Jones/University of Western Australia Postgraduate Scholarship.
Additional Information:
Disclosure Summary: The authors have nothing to disclose.
Data Availability: All data generated or analyzed during this study are included in this published article or in the data repositories listed in References.
Abbreviations:
- AGE
advanced glycation end product
- CML
carboxymethyllysine
- CV
coefficient of variation
- E2
estradiol
- HOMA-IR
homeostasis model assessment of estimated insulin resistance
- IGFBP
IGF binding protein
- LC-MS/MS
liquid chromatography–tandem mass spectrometry
- SHR
subhazard ratio
- T
testosterone
- WADLS
Western Australian Data Linkage System
