


Abstract
Accurate diagnosis of adrenal insufficiency is critical because there are risks associated with overdiagnosis and underdiagnosis. Data using liquid chromatography tandem mass spectrometry (LC/MS/MS) free cortisol (FC) assays in states of high or low cortisol-binding globulin (CBG) levels, including cirrhosis, critical illness, and oral estrogen use, are needed.
Cross-sectional.
Determine the relationship between CBG and albumin as well as total cortisol (TC) and FC in states of normal and abnormal CBG. Establish the FC level by LC/MS/MS that best predicts TC of <18 μg/dL (497 nmol/L) (standard adrenal insufficiency diagnostic cutoff) in healthy individuals.
This study included a total of 338 subjects in four groups: healthy control (HC) subjects (n = 243), patients with cirrhosis (n = 38), intensive care unit patients (ICU) (n = 26), and oral contraceptive (OCP) users (n = 31).
FC and TC by LC/MS/MS, albumin by spectrophotometry, and CBG by ELISA.
TC correlated with FC in the ICU (R = 0.91), HC (R = 0.90), cirrhosis (R = 0.86), and OCP (R = 0.70) groups (all P < 0.0001). In receiver operator curve analysis in the HC group, FC of 0.9 μg/dL (24.8 nmol/L) predicted TC of <18 μg/dL (497 nmol/L; 98% sensitivity, 91% specificity; AUC, 0.98; P < 0.0001). Decreasing the cutoff to 0.7 μg/dL led to a small decrease in sensitivity (92%) with similar specificity (91%).
A cutoff FC of <0.9 μg/dL (25 nmol/L) in this LC/MS/MS assay predicts TC of <18 μg/dL (497 nmol/L) with excellent sensitivity and specificity. This FC cutoff may be helpful in ruling out adrenal insufficiency in patients with binding globulin derangements.
Accurate diagnosis of adrenal insufficiency is critical, as there are serious risks of overdiagnosing and underdiagnosing the condition. Cortisol-binding globulin (CBG) and albumin are the two main reservoirs of cortisol in the human body, binding 70% to 80% and 10% to 20% of total cortisol (TC), respectively. Approximately 10% of TC is free or unbound, which reflects the biologically active cortisol in the body. States of low CBG and albumin, such as critical illness and cirrhosis, lead to underestimation of cortisol action by TC levels, with the potential for overdiagnosis of adrenal insufficiency (1–5). In many instances, patients with these diagnoses have complicated clinical courses, with symptoms or signs that could be consistent with adrenal insufficiency, such as hypotension, fatigue, and weakness, which make it particularly difficult to rule out insufficient cortisol production. On the other end of the spectrum, states of high CBG, such as oral contraceptive (OCP) use, lead to overestimation of cortisol action by TC levels and the potential for underdiagnosis of adrenal insufficiency (6, 7). This is particularly relevant to women with hypopituitarism on OCPs as treatment for central hypogonadism who may also need monitoring for the development of adrenal insufficiency.
Thus, although there are well-established cutoffs for the diagnosis of adrenal insufficiency for TC, the interpretation of measured levels is heavily dependent on normal levels of binding globulins. In contrast, free cortisol (FC) measurements more accurately reflect the free fraction of biologically active cortisol in the presence of binding globulin derangements. However, normative data for FC in the diagnosis of adrenal insufficiency is lacking. Moreover, establishment of normative serum FC values has been limited by prior use of older radioimmunoassays (8–11) or noncommercially available liquid chromatography tandem mass spectrometry (LC/MS/MS) assays, which have limited clinical application. Two recent small studies have proposed the use of FC for the diagnosis of adrenal insufficiency based on cosyntropin stimulation data in subjects with adrenal insufficiency vs control subjects, with cutoffs ranging from 0.9 to 1.3 μg/dL (25 to 36 nmol/L) by LC/MS/MS (12, 13). One additional study examined a larger population (n = 295) that included all patients presenting to a single Endocrine Testing Center for evaluation of adrenal insufficiency, with 14% of the cohort receiving the diagnosis based on TC levels (14). Although their study was designed primarily to investigate cortisol dynamics on cosyntropin stimulation testing, the authors provided a FC cutoff of 0.9 and 1.2 μg/dL at 30 and 60 minutes, respectively. However, this study included women on oral estrogen as well as all patients attending the testing center who were not screened for conditions that could contribute to cortisol binding globulin or albumin derangements (14).
Thus, our study is the first to investigate the relationship between total and free cortisol in a large population of healthy controls with normal cortisol binding globulins in order to enable the determination of the free cortisol level corresponding to the standard total cortisol diagnostic cutoff of 18 μg/dL (497 nmol/L). Having a robust FC cutoff for the diagnosis of adrenal insufficiency would serve a great clinical need for patients with either low or high binding globulins because it would avoid exposing patients to the risks of infection, bone loss, and adverse metabolic effects from steroid exposure, and would avoid putting them at risk of a missed diagnosis of true adrenal insufficiency. These clinical scenarios are encountered frequently at our institution, which led to our examination of cortisol dynamics, CBG, and albumin in subjects on oral contraceptives, with cirrhosis, and in the intensive care unit (ICU).
Building upon this prior literature, we sought to use the relationship between TC and FC in a large population of healthy individuals with normal binding globulins to determine what FC corresponds to the standard TC cutoff used for the diagnosis of adrenal insufficiency (18 µg/dL or 497 nmol/L). We used LC/MS/MS assays for FC and TC that are widely available for clinical care to maximize the clinical utility and generalizability of our findings. We additionally sought to determine whether albumin levels could be used to predict CBG levels when interpreting TC or whether there are clinical scenarios for which FC would be particularly useful.
Subjects and Methods
Subjects
Partners Human Research Committee (PHRC IRB) approval was obtained for the use of discarded clinical specimens with a waiver of informed consent from subjects. Blood samples were obtained from discarded clinical plasma specimens in a cross-sectional study across four subject groups, including HC subjects, OCP users, individuals with cirrhosis, and ICU patients. A total of 338 subjects in the four groups were studied: HC subjects (n = 243), OCP users (n = 31), patients with cirrhosis (n = 38), and ICU patients (n = 26). All subject records were reviewed by a physician (L.E.D. or M.S.) for medical history and medications prior to inclusion into the database and group assignment. Subjects across all groups were excluded for systemic steroid use of any kind. Subjects with topical or inhaled steroid use were included in the database (HC, n = 11; ICU, n = 3; cirrhosis, n = 2; and OCP, n = 1). HC subjects were excluded for conditions that may affect binding globulin levels such as cirrhosis, renal dysfunction, malignancy, OCP use, or human immunodeficiency virus. OCP users were subjected to the same exclusion criteria as HC subjects and were confirmed to be taking a combined estrogen- and progesterone-containing oral contraceptive pill. ICU subjects were excluded if they had concurrent cirrhosis, but all diagnoses were otherwise included. Time of day and severity of illness varied based on type of visit, which included outpatient and emergency room visits for the HC and OCP groups; outpatient, emergency room, and non-ICU admissions for subjects with cirrhosis; and medical ICU admissions for all ICU subjects. The duration of ICU stay at the time of blood draw was 3.0 ± 2.2 (SD), and mean total duration of ICU stay was 5.5 ± 4.4 (SD) days. Model for End-Stage Liver Disease scores and Sequential Organ Failure Assessment scores were calculated as a measure of disease severity for individuals in the cirrhosis and ICU groups, respectively. Mean Model for End-Stage Liver Disease score of the cirrhosis group was 14 ± 7 (subject score range, 6 to 30; possible score range, 6 to 40), which represents ∼6% 3-month mortality (15). Mean Sequential Organ Failure Assessment score on admission for the ICU group was 6.2 ± 3.1 (subject score range, 2 to 14; possible score range, 0 to 24), which represents <10% hospital mortality (16, 17). Demographics and baseline laboratory values are listed in Table 1.
Subject Characteristics and Laboratory Values
| HC Subjects (n = 243) | OCP Users (n = 31) | Cirrhosis (n = 38) | ICU (n = 26) | |
|---|---|---|---|---|
| Subject demographics | ||||
| Age, y | 47 ± 16A | 30 ± 8B | 56 ± 12C | 60 ± 16C |
| Female, n (%) | 130 (53) | 31 (100) | 12 (32) | 12 (46) |
| BMI, kg/m2 | 27.9 ± 5.9AB | 24.9 ± 3.6B | 29.6 ± 8.3A | 30.2 ± 10.5A |
| White, n (%) | 170 (70) | 25 (81) | 28 (74) | 21 (81) |
| Outpatient, n (%) | 141 (58) | 27 (87) | 24 (63) | N/A |
| ER visit, n (%) | 102 (42) | 4 (13) | 0 (0) | N/A |
| Inpatient, n (%) | N/A | N/A | 14 (37) | 26 (100) |
| Laboratory valuesa | ||||
| Total protein, g/dL | 7.1 ± 0.3A | 6.8 ± 0.4AB | 6.8 ± 0.9A | 5.9 ± 0.9B |
| Total bili, mg/dL | 0.6 ± 0.8A | 0.3 ± 0.1A | 4.3 ± 7.1B | 0.7 ± 0.8A |
| AST, U/L | 32 ± 4A | 24 ± 13A | 81 ± 63B | 61 ± 61B |
| ALT, U/L | 30 ± 57A | 19 ± 10A | 43 ± 33B | 52 ± 54AB |
| Sodium, mmol/L | 141 ± 3AB | 142 ± 3AB | 138 ± 7B | 140 ± 4A |
| Creatinine, mg/dL | 0.86 ± 0.20AB | 0.77 ± 0.20AB | 0.83 ± 0.70A | 1.27 ± 1.10B |
| INR | 1.3 ± 0.3 | 1.2 ± 0.3 | ||
| Disease-specific risk scores | ||||
| MELD score | 14 ± 7 | |||
| SOFA score | 6.2 ± 3.1 |
Variables not referenced by the same letter indicate a significant difference between groups (P < 0.05).
Abbreviations: ALT, alanine aminotransferase; AST, aspartate aminotransferase; BMI, body mass index; ER, emergency room; INR, international normalized ratio; MELD, Model for End-Stage Liver Disease; N/A, not available; SOFA, Sequential Organ Failure Assessment.
Subset of HC subjects and OCP users defined as follows. Total protein: HC n = 38, OCP n = 17; total bilirubin: HC n = 134, OCP n = 10; AST and ALT: HC n = 139, OCP n=12; Na: HC n = 214, OCP n = 21; Cr: HC n = 212, OCP n = 21.
Methods
FC and TC were measured by an isotope dilution mass spectrophotometric LC/MS/MS method as previously described (12) (Quest Diagnostics Nichols Institute, San Juan Capistrano, CA). Briefly, TC and FC were measured using an on-line extraction method involving a high-throughput liquid chromatography system (Thermo Scientific, Waltham, MA) and a tandem mass spectrometer (Thermo Scientific). Quantitation on the MS/MS is run in positive mode. The sensitivity of the method is 0.1 μg/dL. The interassay variation is <8%: 1.5 μg/dL, CV = 7.9%; 20 μg/dL, CV = 6.8%; 40 μg/dL, CV = 6.6%; and 80 μg/dL, CV = 6.0%. The intra-assay variation is 3.0% at 15.9 μg/dL and 4.6% at 202.7 μg/dL. Free cortisol was measured after equilibrium dialysis as previously described (12). Samples were incubated in a dialysis chamber against PBS buffer at 37°C. After reaching equilibrium, an aliquot from the PBS chamber FC was analyzed using the LC/MS/MS method described above. The sensitivity of the serum FC method is 0.03 μg/dL. The FC interassay variation was <10% (9.4% at 0.36 μg/dL and 9.8% at 2.17 μg/dL). The FC intra-assay variation was 7.4% at 0.36 μg/dL and 9.3% at 2.20 μg/dL.
Albumin was measured spectrophotometrically on the Beckman Coulter AU series platform (Brea, CA) using a dye-binding method (Albumin, Beckman Coulter, Brea, CA and Quest Diagnostics Nichols Institute, San Juan Capistrano, CA). At acid pH, bromocresol green reacts with albumin to form an intense green complex, and the formation of the color of this complex is measured bichromatically (600/800 nm). The intensity is directly proportional to the albumin concentration in the sample. The sensitivity of the method is 1.5 g/dL (interassay variation <1.0%: 2.1 g/dL, 0.5%; 4.5 g/dL, 0.4%; 5.3 g/dL, 0.4%; normal range 3.6 to 5.1 g/dL).
CBG was measured at the Research Laboratory Services at Maine Medical Center using a sandwich ELISA with an intra-assay variation of 1.7% and interassay variation of 7.1% (Biovendor, Ashville, NC).
Statistical analysis
Analysis was conducted using JMP Statistical Discovery Software, Version 13 Professional (SAS Institute, Inc., Cary, NC). Variables were log-transformed prior to analysis. Four group comparisons were performed using the Tukey-Kramer multiple comparisons test. Linear regression analysis with Pearson correlation coefficients was used to investigate the associations between variables. A two-tailed P value ≤0.05 defined statistical significance. Unless otherwise specified, data are reported as mean ± SD or as an R coefficient and P value. Slopes were compared with Dunnett test with HC subjects as the reference group. Receiver operator curve analysis was performed to calculate the FC with greatest sensitivity and specificity for the diagnosis of adrenal insufficiency. Adrenal sufficiency was defined as the negative condition and adrenal insufficiency as the positive condition using the standard TC cutoffs of ≥18 and <18 μg/dL, respectively.
Results
Determination of FC cutoff
In receiver operator curve analysis in the HC group, an FC cutoff of 0.9 μg/dL (25 nmol/L) predicted a diagnosis of adrenal insufficiency as defined as a TC of <18 µg/mL with 98% sensitivity (3/185 false positives) and 89% specificity (3/35 false negatives; AUC, 0.98; P < 0.0001) (Fig. 1). The sensitivity (i.e., the probability of a true diagnosis to rule in adrenal insufficiency) was 100% at a cutoff of 1.5 μg/dL (41 nmol/L), remained robust at the proposed cutoff of 0.9 μg/dL (25 nmol/L, 98%), and began dropping below 0.7 μg/dL (19 nmol/L, 92%). The specificity (i.e., the probability of a true negative result to rule out adrenal insufficiency) remained stable at 91% down to a cutoff of 0.7 μg/dL (19 nmol/L) and only rose to 97% at a cutoff of 0.4 μg/dL (11 nmol/L). Six individuals had discordant results on the two cutoffs of TC <18 μg/dL (497 nmol/L) and FC <0.9 μg/dL (25 nmol/L) for the diagnosis of adrenal insufficiency. Three HC subjects had a TC >18 μg/dL (497 nmol/L) but had FC <0.9 μg/dL (25 nmol/L), including TC 18.3 μg/dL (505 nmol/L) and FC 0.4 μg/dL (11 nmol/L), TC 18.8 μg/dL (519 nmol/L) and FC 0.6 μg/dL (17 nmol/L), and TC 21.6 μg/dL (596 nmol/L) and FC 0.7 μg/dL (19 nmol/L). Similarly, three HC subjects had a TC <18 μg/dL (497 nmol/L) and FC >0.9 μg/dL (25 nmol/L), including TC 17.1 μg/dL (472 nmol/L) and FC 1.2 μg/dL (33 nmol/L), TC 17.2 μg/dL (475 nmol/L) and FC 1.1 μg/dL (30 nmol/L), and TC 17.7 μg/dL (488 nmol/L) and FC 1.5 μg/dL (41 nmol/L). Thus, the latter three HC subjects deemed adrenally sufficient by the FC assay had near-passing TC levels (all >17.0 μg/dL or 469 nmol/L). The FC cutoff as well as its sensitivity and specificity for the diagnosis of adrenal insufficiency were unchanged after the exclusion of the HC subjects who were taking inhaled steroids (n = 11).
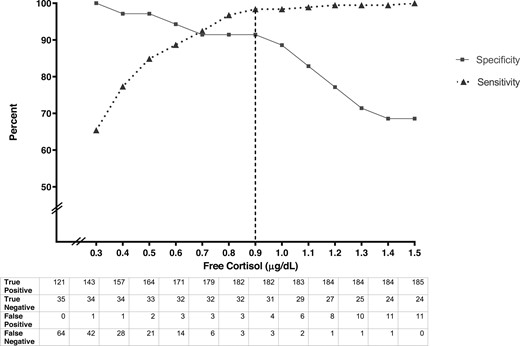
Sensitivity (triangles and dotted line) and specificity (squares and solid line) of different plasma FC cutoffs for the diagnosis of adrenal insufficiency. True positive, true negative, false positive, and false negative data for each FC cutoff are noted.
Albumin and CBG
Mean albumin in the OCP group did not differ from that of the HC group (4.6 ± 0.3 vs 4.7 ± 0.3 g/dL, respectively; P = NS). However, both the cirrhosis (3.5 ± 0.9 g/dL) and ICU (3.1 ± 0.7 g/dL) groups had lower mean albumin levels than the HC group (both comparisons, P < 0.0001) (Table 2; Fig. 2A). As expected, mean CBG was higher in the OCP (57 ± 18 µg/mL) group and lower in the ICU (22 ± 4 µg/mL) and cirrhosis (21 ± 7 µg/mL) groups compared with the HC group (28 ± 7 µg/mL, P < 0.0001 for all other groups vs HC) (Table 2; Fig. 2B).
Cortisol and Binding Globulin Results
| HC Subjects (n = 243) | OCP Users (n = 31) | Cirrhosis (n = 38) | ICU (n = 26) | |
|---|---|---|---|---|
| Binding globulin variables | ||||
| Albumin, g/dL | 4.7 ± 0.3A | 4.6 ± 0.3A | 3.5 ± 0.9B | 3.1 ± 0.7C |
| CBG, µg/mL | 28 ± 7A | 57 ± 18B | 21 ± 7C | 22 ± 4C |
| Cortisol variables | ||||
| TC, µg/dL | 11.5 ± 7.3A | 18.9 ± 8.5B | 9.9 ± 5.7A | 14.7 ± 6.6AB |
| FC, µg/dL | 0.58 ± 0.67A | 0.33 ± 0.15A | 0.59 ± 0.47A | 1.29 ± 1.08B |
| FC, % | 4.2 ± 2.2A | 1.8 ± 0.8B | 5.4 ± 2.7A | 7.7 ± 4.8C |
Variables not referenced by the same letter indicate a significant difference between groups (P < 0.05). Multiply by 27.6 to convert cortisol from µg/dL to nmol/L. Multiply by 17.2 to convert CBG from µg/mL to nmol/L. Multiply by 10 to convert albumin from g/dL to g/L.
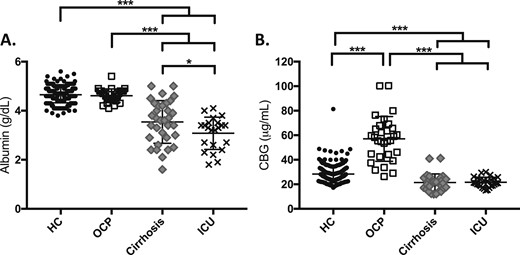
(A) Albumin and (B) CBG by study group. *P < 0.01; ***P < 0.0001.
CBG correlated weakly with albumin in the HC (R = 0.32, P < 0.0001) (Fig. 3A) and cirrhosis groups (R = 0.46, P = 0.01) (Fig. 3B) but was not correlated in the OCP (R = 0.17, P = 0.4) or ICU groups (R = 0.19, P = 0.4) (Fig. 3C and 3D). There was a trend toward a higher CBG in the women on higher-dose estradiol (≥0.03 mg estradiol; n = 20; CBG, 62 ± 19 µg/mL) vs lower dose estradiol (≤0.02 mg estradiol; n = 9; CBG, 48 ± 13 µg/mL; P = 0.08). However, there was notable within-group variability and overlap in CBG levels between the high-dose and low-dose groups (range, 31 to 100 µg/mL vs 26 to 62 µg/mL, respectively).
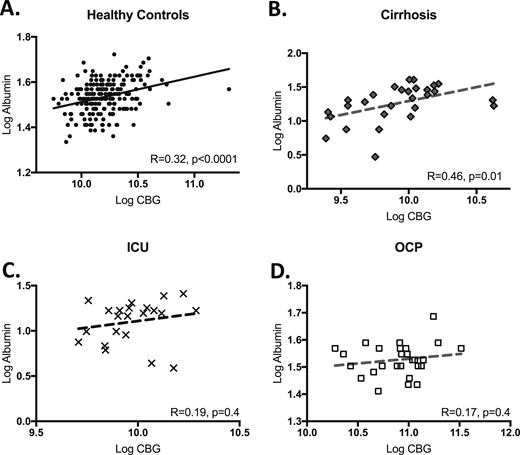
Correlation between albumin and CBG by study group, including (A) HC, (B) cirrhosis, (C) ICU, and (D) OCP. Logged correlations shown with R and P values reported on individual graphs.
TC and FC
Absolute TC and FC by group are presented in Table 2; however, variability in timing of unstimulated samples and severity of illness precludes meaningful comparison of absolute levels between groups. As expected, percent FC was significantly higher in the ICU subjects (7.7 ± 4.8%), a group with a high illness severity and low CBG levels, compared with the HC (4.2 ± 2.2%, P < 0.0001), cirrhosis (5.4 ± 2.7%, P < 0.006), and OCP groups (1.8 ± 0.8%, P < 0.0001). Percent FC was significantly lower in the OCP group, a predominantly outpatient sample with high CBG levels, when compared with all other groups (P < 0.0001 for all comparisons) (Table 2). ICU subjects with albumin <2.5 g/dL had higher FC despite similar TC as those subjects with an albumin of ≥2.5 g/dL (FC 1.8 ± 1.2 vs 0.6 ± 0.7 µg/dL, P < 0.0005; TC 13.6 ± 5.5 vs 12.1 ± 7.6 µg/dL, P = 0.2).
TC strongly correlated with FC in the HC (R = 0.90, P < 0.0001), ICU (R = 0.91, P < 0.0001), and cirrhosis (R = 0.86, P < 0.0001) groups but more weakly in the OCP group (R = 0.70, P < 0.0001) (Fig. 4A–4D). These four TC and FC correlation plots are shown on the same axis in Fig. 4E for direct comparison.
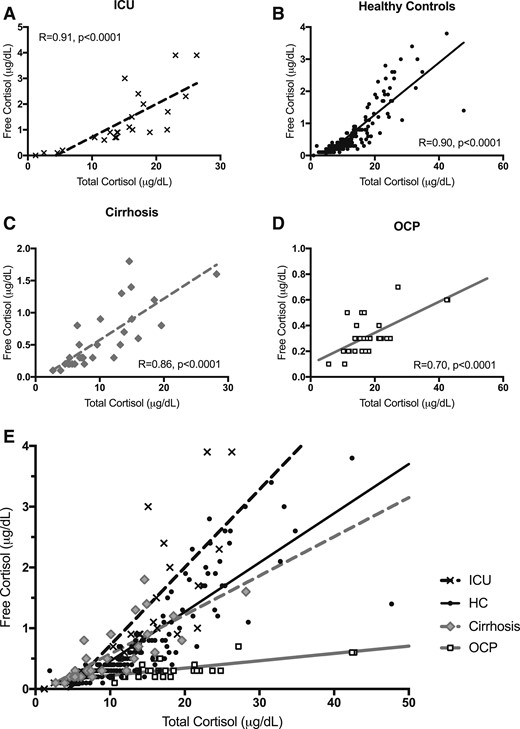
(A–D) Correlation between FC and TC by individual study group and (E) plotted by group on the same axis for comparison. Unlogged correlations shown with R and P values reported for analysis after log transformation.
Discussion
We investigated albumin, CBG, TC, and FC levels across four populations to better care for patients with alterations in cortisol binding proteins. Specifically, we identified an FC level that corresponds to a TC level of 18 µg/dL (497 nmol/L) in HC subjects with normal binding globulins to help establish an FC cutoff for the diagnosis of adrenal insufficiency. Our hope is that the development of a standardized FC cutoff for the diagnosis of adrenal insufficiency could greatly affect patient care because it could be applied to patients with alterations in cortisol binding globulins who may otherwise be over- or underdiagnosed with adrenal insufficiency by TC levels alone. With this in mind, we also investigated the ability to use albumin as a proxy for CBG as well as the relationship between TC and FC to identify specific patient populations in whom TC may be particularly misleading and require the use of a FC cutoff.
Thus, our primary aim was to establish an FC level that corresponds to the gold-standard TC cutoff for the diagnosis of adrenal insufficiency in healthy individuals (18 μg/dL or 497 nmol/L). Three prior studies defining FC cutoffs for the diagnosis of adrenal insufficiency are worth reviewing. Bancos et al. (14) studied a larger number of individuals (n = 295) with unknown adrenal status and determined separate FC cutoffs for 30- and 60-minute values (0.87 and 1.17 µg/mL in all subjects, respectively, and 0.90 and 1.20 µg/mL when excluding women on oral estrogen). A study of patients with adrenally insufficiency (n = 10) and control subjects (n = 12) proposed a cutoff of 0.9 µg/mL at 30 minutes and 1.3 µg/mL at 60 minutes in this same assay as the current study (Quest Diagnostics) after a 250-µg standard dose cosyntropin stimulation test (12). Rauschecker et al. (13) also obtained an FC cutoff of 0.9 µg/mL in the same LC/MS/MS assay as our study (Quest Diagnostics) using cosyntropin-stimulated values in patients with adrenal insufficiency (n = 43) vs control subjects (n = 27).
Our data are consistent with these studies in that they demonstrate that a plasma FC cutoff of <0.9 µg/mL (25 nmol/L) predicts a TC of <18 μg/dL (497 nmol/L) in a large group of healthy individuals with normal binding globulins with excellent sensitivity and good specificity. This cutoff was reached using a larger population and a different methodology than prior studies, which we believe adds to the literature in fortifying and establishing the utility of this FC cutoff in clinical care. This could be a useful tool in clinical practice for patients with altered binding globulins in whom TC may be unreliable, particularly because the high sensitivity of the cutoff indicates that it is unlikely to miss a critical diagnosis of adrenal insufficiency (i.e., negative results are true negatives). In addition, our data suggest that the sensitivity for the diagnosis of adrenal insufficiency remained high (92%) when the cutoff was decreased to 0.7 µg/dL (19 nmol/L), indicating that a lower cutoff may still diagnose the majority of cases of adrenal insufficiency while reliably excluding the diagnosis in most patients.
Additionally, our data demonstrate that, although albumin and CBG significantly correlated with each other in healthy individuals and patients with cirrhosis, albumin was a poor proxy for CBG overall, particularly in critically ill patients in the ICU and healthy women on OCPs. Thus, hypoalbuminemia in a patient with cirrhosis may truly reflect a reduction in both albumin and CBG, which would significantly alter the interpretation of TC levels in these patients. However, these data suggest that, although albumin was shown to be useful as a dichotomous predictor of the accuracy of TC in the ICU (1), it is not helpful as a continuous predictor of CBG levels in critical illness. These discrepant findings have been reported elsewhere and may be due to the heterogeneity of ICU populations, which often include patients with septic shock, sepsis, and nonsepsis-related shock and critical illness (18–20).
Moreover, healthy women on OCPs had a very variable, and at times robust, elevation of CBG, which resulted in a poor correlation with albumin levels. Oral estrogen is known to increase CBG levels (21), with a resulting increase in TC levels (6, 22). Overall, our data support the notion that higher estrogen doses in OCPs lead to higher CBG levels. However, there was still substantial variability of CBG levels even among those on high or low estradiol doses, which limits the ability to predict how any one individual’s CBG level will respond to OCP administration in the clinical setting. Thus, our data also strongly suggest that TC should not be used to assess the adrenal axis in oral contraceptive users because it could overestimate a patient’s FC status, particularly in the unstimulated state. In our own neuroendocrine practice (L.E.D., K.K.M., and M.S.), we frequently encounter women on OCPs who are at risk for adrenal insufficiency and need axis testing. Because the effect on CBG is long lasting, OCPs must be stopped for months to allow for accurate TC testing, delaying the diagnosis of adrenal insufficiency and leaving these women at risk for potential unintended pregnancy as well as menstrual, mood, and other unintended effects of OCP withdrawal. Therefore, this is an ideal patient population for which utilization of FC testing for adrenal insufficiency makes an important clinical impact.
The ICU population deserves particular attention due to the complex physiology of cortisol and binding globulins in these patients, and there is a body of literature regarding TC and FC in this group. A seminal paper by Hamrahian et al. (1) demonstrated that serum TC underestimated serum FC (measured by radioimmunoassay) in critically ill patients with hypoalbuminemia and that measurement of TC in this population would lead to overdiagnosis of adrenal insufficiency. However, this study was performed using an immunoassay and was not designed to determine an FC cutoff for the diagnosis of adrenal insufficiency (1). There are additional studies investigating the use of serum or salivary FC in the diagnosis of adrenal insufficiency in the ICU population. However, they are limited by variable testing protocols, the use of immunoassays, and the lack of design to specifically determine serum FC cutoffs for this purpose (18, 19, 23).
The physiology of changes in albumin, CBG, TC, and FC levels in states of critical illness are complex and difficult to study in a heterogenous ICU population. Studies in the ICU population have demonstrated differential changes in albumin and CBG (19) and changes in binding dynamics as TC increases (24) and suggest that the proportion of FC to TC may be different in these patients irrespective of binding globulins (18). Thus, prospective studies should be performed in critically ill patients to further investigate the physiology of TC, FC, and binding globulins in this setting. Additionally, some authors suggest that critically ill patients would be expected to have an FC that potentially surpasses a healthy, stimulated individual (20), suggesting that the same FC cutoff defined in this paper may not be applicable to the ICU population in particular.
We recognize the difficulty of translating plasma FC and TC levels to physiologic endpoints due to the complexity of this steroid and binding globulin system. Cortisol exhibits diurnal variability and wide fluctuations based on severity of illness, resulting in expected normal ranges that are condition dependent. We additionally recognize the limitation of a single timepoint measurement of a free hormone, which is in constant equilibrium that can be affected by a wide variety of factors, including inflammation, temperature, and other rapidly changing conditions. Moreover, the cellular response to cortisol is durable, which stands in stark contrast to the rapid fluctuations of plasma cortisol levels. Finally, CBG is a serpin subject to degradation by enzymes such as neutrophil elastace, which provides targeted delivery of liberated FC to local tissues in the inflammatory state (25). Thus, the measurement of TC and FC levels may not adequately reflect the underlying complexity of this steroid system and the resulting physiologic response.
Limitations of our study include a lack of cosyntropin stimulation testing across the four main study groups. Although random sampling allowed us to obtain a wide range of TC and FC levels, it limited our ability to compare TC and FC levels across our subject groups. Additionally, although still widely used in clinical care, our gold standard TC cutoff of 18 µg/dL (497 nmol/L) was established using older, nonspecific fluorometric assays, which might not reflect the same levels measured by current LC/MS assays or even radioimmunoassays (8–11, 26–28), although one recent study effectively confirmed these cutoffs in an LC/MS/MS assay (26). Finally, we were limited in our ability to fully evaluate the complex nature of albumin, CBG, and cortisol binding dynamics in our heterogeneous ICU population as noted above. This may limit the clinical application of our FC cutoff in critical illness.
In summary, an FC of <0.9 µg/dL (25 nmol/L) in this commercially available LC/MS/MS assay predicts a diagnosis of adrenal insufficiency with maximal sensitivity and specificity based on the standard TC cutoff of <18 µg/dL (497 nmol/L) in healthy individuals. Thus, an FC level of <0.9 µg/dL (25 nmol/L) could be used in clinical care to aid in the diagnosis of adrenal insufficiency in states of altered CBG, particularly in those with cirrhosis or on oral estrogen, with the caveat that the sensitivity and specificity did not reach 100% even in HC subjects, and clinical judgment must be used in interpretation of TC and FC levels in specific clinical cases. Certain groups, such as those with critical illness in the ICU, deserve further study given the complexity of cortisol system dynamics in this population.
Acknowledgments
The authors dedicate this manuscript to the late Dr. Richard Reitz, who made a substantial contribution to this work before his passing.
Financial Support: This work was supported by the following National Institutes of Health Grants: K23DK113220 (to L.E.D.), K23DK115903 (to M.S.), and K24HL092902 (to K.K.M.).
Disclosure Summary: Laboratory services were provided at no cost by Quest Diagnostics, San Juan Capistrano, CA. M.J.M. is an employee of Quest Diagnostics, San Juan Capistrano, CA. Discounted Cortisol Binding Globulin kits were provided by Biovendor, Ashville, NC.
Abbreviations:
- CBG
cortisol-binding globulin
- FC
free cortisol
- HC
healthy control
- ICU
intensive care unit
- LC/MS/MS
liquid chromatography tandem mass spectrometry
- OCP
oral contraceptive
- TC
total cortisol
