


Abstract
Emerging evidence suggests that deficiencies of folate-related B vitamins can arise with metformin treatment and are independently linked with cognitive dysfunction, a comorbidity of diabetes.
To determine the impact of hyperglycemia and metformin use on relevant B vitamin biomarkers and cognitive outcomes in older adults.
Community-dwelling older adults (74.1 ± 8.3 years, n = 4160) without dementia, recruited to the Trinity, Ulster and Department of Agriculture cohort study in 2008 to 2012, were classified as normoglycemic (n = 1856) or hyperglycemic, based on HbA1c ≥5.7% (39 mmol/mol), either with (n = 318) or without (n = 1986) metformin treatment.
Biomarkers of folate, vitamin B12, vitamin B6, and riboflavin were measured. Cognitive assessments included the Repeatable Battery for Assessment of Neuropsychological Status (RBANS) and the Frontal Assessment Battery (FAB).
Metformin use was associated with higher risk of deficiency of vitamin B12 (combined B12 index ≤−1; OR 1.45; 95% CI, 1.03 to 2.02) and vitamin B6 (plasma pyridoxal 5-phosphate <30.0 nmol/L; OR 1.48; 95% CI, 1.02 to 2.15). Fortified foods when eaten regularly had a positive impact on all relevant B vitamin biomarkers, even with hyperglycemia. After adjustment for relevant covariates, metformin use was associated with an increased risk of cognitive dysfunction as assessed with the RBANS (OR 1.36; 95% CI, 1.03 to 1.80) and FAB (OR 1.34; 95% CI, 1.03 to 1.74).
Use of metformin by older adults is associated with poorer cognitive performance; B vitamin deficiency may be implicated. Fortified foods can optimize B vitamin status and may be beneficial for maintaining better cognitive health in older people with or at risk for diabetes.
Diabetes is estimated to affect 422 million people worldwide and accounts for 14.5% of global mortality in those aged 20 to 79 years (1). In the United States alone, ∼29 million people have diagnosed diabetes (2), with costs to the US economy estimated at $245 billion and predicted to double by 2034 (3). As a result of improved prevention and treatments in diabetes and comorbidities, people are now living longer but presenting with multiple comorbidities, including cardiovascular disease, renal disease, and neuropathy, and thereby placing a greater demand on health care services (2).
Metformin, the most commonly prescribed drug for type 2 diabetes, is used primarily to increase insulin sensitivity and promote weight loss (4). More than 40 years ago, Tomkin et al. (5) reported evidence of vitamin B12 malabsorption in up to 30% of diabetic patients on long-term metformin treatment. Large observational studies (6–8) and systematic reviews (9–11) subsequently concluded that metformin use was associated with significantly lower vitamin B12 status. This may be of particular concern for older patients given that, apart from any metformin-related depletion and in the absence of clinical deficiency (i.e., pernicious anemia), low B12 status commonly occurs in older age mainly as a result of food-bound B12 malabsorption caused by atrophic gastritis (12). Determining the impact of metformin use on vitamin B12 status remains unclear, however, because the majority of previous studies have based their conclusions on one biomarker, but experts in the field now recommend that at least two biomarkers be used in the diagnosis of B12 deficiency owing to the limitations of individual biomarkers (13, 14). There is also some evidence linking metformin use with low status of folate (15) which, together with vitamin B12, is necessary for the remethylation of homocysteine to methionine within one-carbon metabolism and may thus be related to health outcomes in aging.
No previous study has explored the relationship of diabetes and metformin use with all relevant B vitamins involved in one-carbon metabolism (namely folate, vitamin B12, vitamin B6, and riboflavin). Deficiencies of these B vitamins have been independently associated with cognitive dysfunction (16), an emerging comorbidity of diabetes, with epidemiological studies reporting an increased risk of dementia (by 50% to 150%) in those with type 2 diabetes compared with the general population (17, 18). Although far fewer studies have investigated the impact of metformin use, there is some evidence of an increased risk of cognitive dysfunction with long-term metformin treatment, but the evidence is conflicting (19, 20). The aim of this study therefore was to investigate the impact of hyperglycemia and metformin use on all relevant B vitamin biomarkers and examine their associations with cognitive outcomes in older adults. Furthermore, we considered the potential role of fortified foods as a means of optimizing B vitamin status in those with or at risk of diabetes.
Materials and Methods
Recruitment and study design
This observational study involved new analysis of data from the Trinity, Ulster and Department of Agriculture (TUDA) cohort (ClinicalTrials.gov identifier NCT02664584), made up of 5186 community-dwelling older adults. As described in detail elsewhere (21), TUDA study participants were recruited between 2008 and 2012 from General Practice or hospital outpatient clinics in Northern Ireland (UK) and the Republic of Ireland via standardized protocols. Briefly, the inclusion criteria for the TUDA study were being born on the island of Ireland, aged ≥60 years, and without an existing diagnosis of dementia. A comprehensive health and lifestyle questionnaire was administered as part of the 90-minute interview to capture medical and demographic details, medications, and vitamin supplement usage. A food frequency questionnaire was used to collect habitual dietary intake of foods providing rich sources of B vitamins. Weight, height, waist, and hip measurements were recorded and blood pressure was measured with a validated clinical automated blood pressure recording device (705 CP-II blood pressure monitor; Omron, Milton Keynes, UK) in accordance with standard operating procedures. Ethical approval was obtained from the Office for Research Ethics Committees Northern Ireland (reference number 08/NIR03/113), the Research Ethics Committee in St James’s Hospital, and the Adelaide and Meath Hospital, Dublin. All participants provided written informed consent at the time of recruitment.
For this analysis, participants without HbA1c results (n = 171) and those on B12 injections (because of diagnosis of pernicious anemia) and oral B vitamin supplement users (n = 837) were excluded (Fig. 1). The small number of participants identified as normoglycemic and on glucose-lowering drugs or insulin (n = 18) were also excluded, resulting in a final sample of 4160 participants for this analysis.
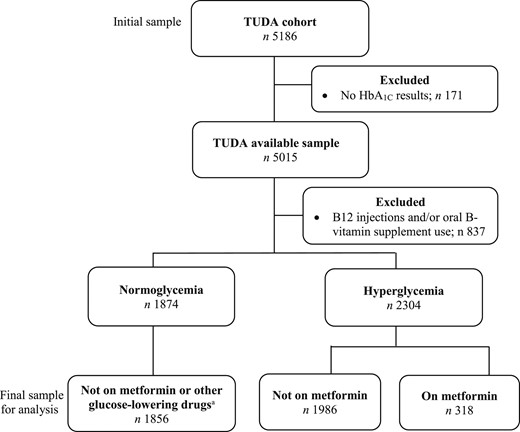
Flowchart of eligible participants from the TUDA cohort study . Hyperglycemia classification includes participants with prediabetes (HbA1c ≥5.7% to 6.4%; 39 to 47 mmol/mol) and diabetes (HbA1c ≥6.5%; 48 mmol/mol). Glucose-lowering drugs included sulfonylureas, dipeptidyl peptidase-4 inhibitors, glitazones, meglitinides, α-glucosidase inhibitors, glucagon-like peptide 1 receptor agonists, and glucagon.
Procedures
Cognitive and neuropsychiatric performance tests
Cognitive performance was assessed by trained researchers via the Folstein Mini–Mental State Examination (MMSE), Frontal Assessment Battery (FAB), and Repeatable Battery for the Assessment of Neuropsychological Status (RBANS). MMSE is the most widely used clinical screening tool to assess global cognitive function; from a maximum attainable score of 30, a score of <25 is considered indicative of cognitive impairment. The FAB tool specifically assesses frontal lobe executive functioning and the domains of conceptualization, verbal fluency, motor programming, resistance to interference, inhibitory control, and environmental autonomy. The maximum score attainable is 18, with a score ≤15 indicating cognitive dysfunction (22). RBANS is an age-adjusted tool that assesses specific cognitive domains including immediate and delayed memory, visual-spatial, language, and attention; a total score <80 indicates cognitive dysfunction. Total scores in each cognitive test were used for this analysis. Depression was assessed via the Centre for Epidemiological Studies Depression scale screening test, with a score ≥16 indicating clinical depression.
Laboratory analysis
All participants provided a nonfasting (50 mL) blood sample, and all samples were processed within 4 hours of collection. Analysis for routine clinical blood biochemistry profile and HbA1c was performed at the time of blood collection. HbA1c measurement was performed in participating hospital laboratories on the Bio-Rad Variant II Turbo analyzer (Bio-Rad Laboratory Inc., Hercules, CA) which is traceable to the International Federation for Clinical Chemistry reference method; results were reported in units of mmol/mol. Blood aliquots for B vitamin biomarkers were stored at −80°C until batch analysis.
All laboratory analysis for B vitamin biomarkers was centralized in research laboratories at Trinity College Dublin (vitamin B12, folate, homocysteine) or Ulster University (vitamin B6, riboflavin) via established methods. Plasma homocysteine was analyzed by fluorescence polarization immunoassay with the Abbot Imx Analyzer (Axis Shield, Düsseldorf, Germany) (23). Vitamin B12 status was determined by two direct measures: serum total vitamin B12 by microbiological assay with Lactobacillus leichmannii (24) and serum holotranscobalamin (holoTC) by microparticle enzyme immunoassay (AxSym Active-B12; Axis Shield, Dundee, Scotland) (25). In addition, the combined B12 index was calculated with three biomarkers (serum total vitamin B12, serum holoTC, and plasma homocysteine) in combination to provide a diagnostic indicator, with a score ≤−1 being defined as deficient status (26). Serum and red blood cell (RBC) folate were measured via microbiological assay with Lactobacillus casei (27). Vitamin B6 [plasma pyridoxal 5-phosphate (PLP)] was measured by reversed-phase, high-performance liquid chromatographic separation with fluorescence detection (28). Riboflavin status was assessed by erythrocyte glutathione reductase activation coefficient (EGRac), a functional assay in which the ratio of flavin adenine dinucleotide stimulated to unstimulated glutathione reductase activity is calculated; a higher EGRac ratio indicates a lower riboflavin status, with suboptimal status generally indicated by a coefficient of ≥1.30 (29).
For all B vitamin biomarkers, samples were analyzed blind and in duplicate. Quality controls were provided by repeated analysis of pooled samples. Interassay coefficients of variation were as follows: serum folate <11.0%, RBC folate <11.0%, serum total B12 <10.9%, holoTC <11.1%, EGRac <2.4%, PLP <7.3%, and plasma homocysteine <5.2%. For each B vitamin, deficiency was defined in terms of reference ranges from the analytical laboratory where the assay was performed: serum total B12 ≤148 pmol/L, plasma holoTC ≤35 pmol/L (30), and plasma PLP <30.0 nmol/L (31). For serum folate (<10 nmol/L) and RBC folate (≤340 nmol/L), internationally accepted reference ranges were used (32). Elevated plasma homocysteine was classified as ≥15 µmol/L (33).
Statistical analysis
Statistical analysis was performed in SPSS software (version 22.0; SPSS UK Ltd, Chersey, UK). Before analysis, variables were tested for normality and log-transformed as appropriate. Participants were identified as being normoglycemic if they had an HbA1c of <5.7% (<39 mmol/mol), hyperglycemic if they had an HbA1c of ≥5.7% (≥39 mmol/mol), prediabetic if they had an HbA1c of ≥5.7% to 6.4% (≥39 to 47 mmol/mol), and diabetic if they had an HbA1c of ≥6.5% (≥48 mmol/mol) according to the 2018 American Diabetes Association standards of care in diabetes (34). For numerical data, descriptive differences between normoglycemia, hyperglycemia, and metformin groups were examined via either one-way between-group ANOVA or analysis of covariance (ANCOVA) after adjustment for confounding factors with Tukey post hoc comparisons. For categorical data, differences between groups were examined via χ2 test. Logistic regression was used to assess the risk of B vitamin deficiency in relation to hyperglycemia and metformin use after adjustment for confounders: age, sex, body mass index (BMI), glomerular filtration rate (GFR), education, socioeconomic status [measured as area-level deprivation (35)], proton pump inhibitors (PPIs), H2 receptor antagonists, and glucose-lowering drugs (not including metformin). The latter category of drugs included sulfonylureas, dipeptidyl peptidase-4 inhibitors, glitazones, meglitinides, α-glucosidase inhibitors, glucagon-like peptide 1 receptor agonists and glucagon. The strength and direction of the relationships between relevant demographics, glycemic control, B vitamin status, and cognitive function for each of the participant subgroups (normoglycemic, prediabetic, and diabetic) were illustrated via weighted, undirected adjacency matrices generated from Pearson correlation coefficients. The networks were visualized in a circular layout in corrplot and qgraph packages from R (version 3.3.0; R Core Team 2016, Vienna, Austria; www.R-project.org). Logistic regression was used to assess the risk of cognitive dysfunction in those with hyperglycemia (with or without metformin use) after adjustment for confounders: age, education, and GFR. For all analyses, P <0.05 was considered statistically significant.
Results
Identification of the sample for analysis from the TUDA study cohort is illustrated in Fig. 1. Of the total cohort of 5186 TUDA study participants, 4160 met the inclusion criteria for the current analysis. Participants were classified as normoglycemic or hyperglycemic, HbA1c ≥5.7% (39 mmol/mol), either with or without metformin treatment. Characteristics of the participants relevant to diabetes are shown in Table 1. Given the statistically significant differences in general characteristics between the three groups (with the hyperglycemic group being older, more overweight, and with poorer renal function compared with normoglycemic participants), all other characteristics were adjusted for age, sex, BMI, and GFR. The majority of participants (72%) consumed foods fortified with B vitamins. Mean scores in each cognitive test in all three groups were found to be within normal ranges (i.e., MMSE score ≥25, FAB score >15, and RBANS score ≥80).
Characteristics of TUDA Study Participants in Relation to Relevance to Diabetes and Cognitive Health
| Normoglycemia, n = 1856 | Hyperglycemia | |||
|---|---|---|---|---|
| Not on Metformin, n = 1986 | On Metformin, n = 318 | P | ||
| General characteristics | ||||
| Age, y | 72.9 (72.5–73.3)a | 75.5 (75.2–75.9)b | 73.7 (72.7–74.7)a | <0.001 |
| Sex, n (% male) | 627 (34) | 639 (32) | 164 (52) | <0.001 |
| BMI, kg/m2 | 26.9 (26.7–27.1)a | 28.6 (28.4–28.9)b | 30.3 (29.7–31.0)c | <0.001 |
| Waist/hip ratio, cm | 0.91 (0.90–0.91)a | 0.92 (0.91–0.92)b | 0.93 (0.92–0.93)b | <0.001 |
| GFR, mL/min | 67.2 (66.7–67.7) | 66.8 (66.3–67.3) | 66.6 (65.3–67.9) | 0.41 |
| Creatinine, µmol/L | 86.4 (85.2–87.7)a | 87.3 (86.1–88.5)a | 81.1 (77.8–84.4)b | 0.003 |
| Health and lifestyle characteristics | ||||
| Age finished education, y | 16.1 (16.0–16.3)a | 15.8 (15.7–16.0)b | 15.6 (15.3–16.0)b | 0.001 |
| Current smoker, n (%) | 213 (12) | 252 (13) | 37 (12) | 0.50 |
| Alcohol, units/wkd | 9.0 (8.3–9.7)a | 7.3 (6.6–8.0)b | 5.4 (3.2–7.5)b | <0.001 |
| Fortified food consumer,e n (%) | 1338 (72) | 1435 (72) | 234 (74) | 0.85 |
| Hb, g/dL | 13.3 (13.3–13.4)a | 13.3 (13.2–13.3)a | 12.8 (12.7–13.0)b | <0.001 |
| Hypertensive, n (%) | 1611 (87) | 1812 (91) | 312 (98) | <0.001 |
| Systolic BP, mm Hg | 145.5 (144.5–146.5) | 144.8 (143.9–145.7) | 142.6 (139.9–145.2) | 0.14 |
| Diastolic BP, mm Hg | 79.0 (78.5–79.5)a | 78.0 (77.4–78.4)b | 76.7 (75.3–78.0)b | 0.001 |
| LDL cholesterol, mmol/L | 2.48 (2.44–2.52)a | 2.40 (2.37–2.44)b | 2.03 (1.92–2.13)c | <0.001 |
| HDL cholesterol, mmol/L | 1.51 (1.49–1.53)a | 1.43 (1.41–1.45)b | 1.33 (1.27–1.38)c | <0.001 |
| Triglycerides, mmol/L | 1.48 (1.45–1.52)a | 1.68 (1.65–1.72)b | 1.68 (1.58–1.79)b | <0.001 |
| Self-reported CVD, n (%) | 243 (13) | 374 (19) | 68 (21) | <0.001 |
| Self-reported diabetes, n (%) | 9 (1) | 223 (11) | 316 (99) | <0.001 |
| Cognitive and mental health | ||||
| MMSE | 27.0 (26.9–27.2) | 27.0 (26.9–27.1) | 27.1 (26.8–27.4) | 0.73 |
| RBANS | 85.4 (84.7–86.1)a | 84.2 (83.5–84.8)b | 84.0 (82.1–85.9)a,b | 0.04 |
| Frontal Assessment Battery | 15.2 (15.1–15.3) | 15.1 (15.0–15.3) | 15.1 (14.8–15.4) | 0.75 |
| CES-D | 6.1 (5.8–6.5) | 6.0 (5.7–6.3) | 6.6 (5.6–7.5) | 0.50 |
| Relevant medications n (%) | ||||
| Glucose-lowering drugs | 0 | 83 (4) | 132 (42) | <0.001 |
| Insulin | 0 | 57 (3) | 39 (12) | <0.001 |
| Antihypertensive agents | 1367 (74) | 1625 (82) | 304 (96) | <0.001 |
| Statins | 987 (53) | 1083 (55) | 216 (67) | <0.001 |
| PPI and/or H2-receptor antagonists | 654 (35) | 891 (45) | 129 (41) | <0.001 |
Data presented are adjusted means (95% CI) unless stated otherwise. χ2 for categorical variables; ANCOVA for continuous variables adjusted for age, sex, BMI, GFR, education, socioeconomic status [measured as area-level deprivation (35) and relevant drug use (PPIs, H2 receptor antagonists, and glucose-lowering drugs other than metformin] with Tukey post hoc comparisons.
Abbreviations: BP, blood pressure; CES-D, Centre for Epidemiological Studies Depression scale; CVD, cardiovascular disease; HDL, high-density lipoprotein; LDL, low-density lipoprotein.
Different letters within a given row denote statistically significant differences between any two specific groups for that variable.
Alcohol units per wk; 1 unit equates with 25 mL spirits, 220 mL beer, and 85 mL wine.
Participants who consumed foods fortified with B vitamins at least once per wk.
The impact of hyperglycemia and metformin use on B vitamin status was examined (Table 2). Serum total vitamin B12 concentrations were lower in metformin users than in the other two groups, after adjustment for age, sex, BMI, GFR, education, socioeconomic status, and relevant medications. Although concentrations of the other specific B12 biomarker (holoTC) showed no significant differences between the three groups, the prevalence of B12 deficiency, as detected by the combined B12 index based on total vitamin B12, holoTC, and homocysteine in combination, was higher in metformin users. Likewise, vitamin B6 status (as measured via plasma PLP) was lower, and the prevalence of deficiency higher, in participants on metformin treatment. Neither folate nor riboflavin biomarkers were associated with metformin treatment, although a higher prevalence of riboflavin deficiency was observed in participants on metformin. When these relationships were further examined via logistic regression, compared with normoglycemic controls, metformin use (but not hyperglycemia) was associated with a higher risk of deficiency of vitamin B12 (by 45%) and vitamin B6 (by 48%). No significant relationships of metformin use with the risk of folate or riboflavin deficiency were observed.
B Vitamin Status in Participants in Relation to Hyperglycemia and Metformin Use
| Normoglycemia, n = 1856 | Hyperglycemia | |||
|---|---|---|---|---|
| Not on Metformin, n = 1986 | On Metformin, n = 318 | P | ||
| Vitamin B12; serum total B12, pmol/L | 272 (266–277)a | 275 (269–280)a | 239 (224–254)b | <0.001 |
| Deficiency: ≤148 pmol/L, n (%) | 213 (12) | 244 (12) | 59 (19) | 0.005 |
| Plasma holoTC, pmol/L | 59.7 (58.4–61.1) | 61.2 (59.9–62.5) | 60.0 (56.4–63.5) | 0.30 |
| Deficiency: ≤35 pmol/L, n (%) | 323 (17) | 361 (18) | 67 (21) | 0.15 |
| Plasma homocysteine, µmol/L | 15.5 (15.2–15.7)a | 14.9 (14.7–15.2)b | 15.4 (14.7–16.0)a | 0.007 |
| Elevated: ≥15 µmol/L, n (%) | 697 (38) | 823 (41) | 147 (46) | 0.003 |
| cB12 indexc ≤−1, n (%) | 341 (18) | 389 (20) | 84 (26) | 0.005 |
| Folate; RBC,d nmol/L | 1009 (987–1031)a | 968 (947–989)b | 954 (894–1013)a,b | 0.02 |
| Deficiency: ≤340 nmol/L, n (%) | 53 (3) | 48 (2) | 5 (2) | 0.42 |
| Serum folate, nmol/L | 30.3 (29.3–31.2) | 29.6 (28.7–30.5) | 28.4 (25.9–31.0) | 0.34 |
| Deficiency: <10 nmol/L, n (%) | 219 (12) | 251 (13) | 38 (12) | 0.72 |
| Vitamin B6; plasma PLP, nmol/L | 68.6 (66.7–70.3)a | 66.3 (64.6–68.0)a | 59.8 (55.1–64.6)b | 0.003 |
| Deficiency: <30.0 nmol/L, n (%) | 234 (13) | 310 (16) | 68 (21) | <0.001 |
| Riboflavin; EGRace | 1.35 (1.34–1.36) | 1.36 (1.35–1.37) | 1.38 (1.35–1.40) | 0.23 |
| Deficiency: ≥1.40, n (%) | 536 (29) | 572 (29) | 114 (36) | 0.03 |
| Risk of B Vitamin Deficiency | |||||
|---|---|---|---|---|---|
| OR (95% CI) | P | OR (95% CI) | P | ||
| Vitamin B12 deficiency (cB12 index ≤ −1) | Reference category | 0.94 (0.79–1.12) | 0.50 | 1.45 (1.03–2.02) | 0.03 |
| Folate deficiency (RBC ≤340 nmol/L) | Reference category | 0.89 (0.58–1.37) | 0.60 | 0.85 (0.30–2.44) | 0.77 |
| Vitamin B6 deficiency (PLP <30 nmol/L) | Reference category | 1.05 (0.86–1.28) | 0.62 | 1.48 (1.02–2.15) | 0.04 |
| Riboflavin deficiency (EGRac ≥1.40) | Reference category | 1.04 (0.90–1.21) | 0.60 | 1.28 (0.95–1.73) | 0.11 |
Data presented are adjusted means (95% CI) unless stated otherwise. χ2 for categorical variables; ANCOVA for continuous variables adjusted for age, sex, BMI, GFR, education, socioeconomic status [measured as area-level deprivation (35) and relevant drug use (PPIs, H2-receptor antagonists, and glucose-lowering drugs other than metformin] with Tukey post hoc comparisons. Binary logistic regression model (outcome: risk of B vitamin deficiency) adjusted for covariates.
Abbreviation: cB12, combined B12.
Different letters within a given row denote statistically significant differences between any two specific groups for that variable.
cB12 index was calculated with serum total vitamin B12, plasma holoTC, and plasma homocysteine values in combination to provide a diagnostic indicator, with a score ≤−1 being defined as deficient status (26).
For serum folate <10 nmol/L and RBC folate ≤340 nmol/L, an internationally accepted reference range was used (32). For other B vitamin biomarkers, reference ranges from analytical laboratory where assay was performed; for serum total B12 ≤148 pmol/L, plasma holoTC ≤35 pmol/L (30), plasma PLP <30.0 nmol/L (31). Elevated plasma homocysteine was classified as ≥15 µmol/L (33).
Riboflavin status was assessed with the EGRac; a higher EGRac ratio indicates a lower riboflavin status, with deficient status generally indicated by a coefficient of ≥1.40 (29).
Relationships between relevant participant demographics, glycemic control, B vitamin status, and cognitive function were observed to be moderate to strong in participants with normoglycemia, prediabetes, and diabetes (Fig. 2). B vitamin biomarkers were more strongly correlated with measures of cognitive function in the normoglycemia (Fig. 2a) compared with prediabetes and diabetes (Fig. 2b and 2c) groups. Of note, plasma homocysteine was inversely associated, and vitamin B6 positively associated, with all three measures of cognitive function. Metformin use in diabetes was inversely associated with vitamin B12 and, to a lesser extent, vitamin B2 (i.e., riboflavin; metabolically closely linked with vitamin B6 and required for the generation of the active B6 form, PLP, in tissues) (Fig. 2c). Fortified foods were positively associated with all B vitamin biomarkers, and the strength of the relationship was similar across all three subgroups.
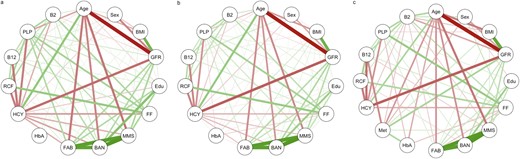
Network analysis illustrating Pearson correlations between participant demographics, glycemic control, B vitamin status, and cognitive function for (a) normoglycemia (n = 1856), (b) prediabetes (n = 1712), and (c) diabetes (n = 592) subgroups. Positive and inverse associations indicated by green and red lines, respectively. Strength of association indicated by line thickness. BAN, Repeatable Battery for the Assessment of Neuropsychological Status; Edu, education; FF, fortified food consumption; HbA, glycosylated hemoglobin; HCY, homocysteine; Met, metformin use; RCF, red blood cell folate.
The risk of cognitive dysfunction in relation to hyperglycemia, with or without metformin treatment, was examined (Table 3). Relative to normoglycemic participants (the reference category), metformin treatment was associated with an increased risk of cognitive dysfunction (by 34% to 36%) on the FAB or RBANS tests of cognitive performance, whereas no significant effect of metformin was observed via MMSE. Furthermore, diabetes (HbA1c ≥6.5%; 48 mmol/mol) was associated with a higher risk of cognitive dysfunction after adjustment for age, education, and GFR (data not shown), and this risk was exacerbated by metformin use, as measured by FAB (OR 1.44; 95% CI, 1.08 to 1.92) and RBANS (OR 1.41; 95% CI, 1.04 to 1.90) tests, whereas no significant relationship of diabetes with cognitive dysfunction was observed via MMSE.
Risk of Cognitive Dysfunction in Relation to Diabetes and Metformin Use
| Risk of Cognitive Dysfunction | ||||||
|---|---|---|---|---|---|---|
| MMSE | FAB | RBANS | ||||
| OR (95% CI) | P | OR (95% CI) | P | OR (95% CI) | P | |
| Model 1 | ||||||
| Total cohort, n = 4160 | ||||||
| Normoglycemia (reference category), n = 1856 | ||||||
| Hyperglycemiaa and not on metformin, n = 1986 | 0.98 (0.80–1.20) | 0.83 | 1.08 (0.94–1.25) | 0.28 | 1.04 (0.90–1.21) | 0.60 |
| Hyperglycemiaa and on metformin, n = 318 | 1.02 (0.68–1.51) | 0.93 | 1.35 (1.04–1.76) | 0.02 | 1.38 (1.05–1.81) | 0.02 |
| Model 2 | ||||||
| Hyperglycemiaa and not on metformin, n = 1986 | 0.96 (0.78–1.18) | 0.71 | 1.04 (0.90–1.20) | 0.56 | 1.04 (0.89–1.21) | 0.64 |
| Hyperglycemiaa and on metformin, n = 318 | 1.04 (0.70–1.55) | 0.85 | 1.34 (1.03–1.74) | 0.03 | 1.36 (1.03–1.80) | 0.03 |
Binary logistic regression (outcome: risk of cognitive dysfunction) adjusted for age, education, and GFR. Model 2 additionally adjusted for serum B12 and plasma PLP concentrations.
Hyperglycemia classification includes participants with prediabetes (HbA1c ≥5.7%–6.4%; 39–47 mmol/mol) and diabetes (HbA1c ≥6.5%; 48 mmol/mol) (34).
B vitamin biomarker status was examined in relation to fortified food intake (Table 4). Regular intake of fortified food (i.e., five or more portions of fortified food per week) was associated with significantly higher biomarker status of all relevant B vitamins, among both hyperglycemic patients and normoglycemic controls. Hyperglycemic patients who were nonregular consumers of fortified food (i.e., zero or less than five portions of fortified food per week) had the lowest B vitamin concentrations and the highest rates of B vitamin deficiency. Among hyperglycemic patients, B vitamin deficiency rates were 27% vs 17% (for B12) and 25% vs 11% (for B6) in nonregular compared with regular consumers of fortified food (Table 4).
B Vitamin Status in Participants With Hyperglycemia by Fortified Food Intake
| Normoglycemic Controls | Hyperglycemic Cases | P | |||
|---|---|---|---|---|---|
| Fortified Food Consumptiona | Fortified Food Consumptiona | ||||
| Nonregular, n = 658 | Regular, n = 1157 | Nonregular, n = 860 | Regular, n = 1396 | ||
| Age, y | 72.9 (72.2–73.5)b | 72.7 (72.3–73.2)b | 75.1 (74.5–75.6)c | 75.5 (75.1–76.0)c | <0.001 |
| Sex, n (% male) | 230 (35) | 383 (33) | 293 (34) | 494 (35) | 0.66 |
| B-vitamin biomarker status | |||||
| Serum total vitamin B12, pmol/L | 251 (242–260)b | 281 (274–288)c | 252 (244–260)b | 281 (256–287)c | <0.001 |
| Plasma holoTC, pmol/L | 53.7 (51.6–56.0)b | 63.0 (61.3–64.7)c | 55.7 (53.7–57.6)b | 64.1 (62.6–65.6)c | <0.001 |
| RBC folate, nmol/L | 798 (765–831)b | 1107 (1082–1132)c | 774 (745–803)b | 1064 (1041–1087)c | <0.001 |
| Serum folate, nmol/L | 19.4 (18.0–20.9)b | 35.8 (34.7–36.8)c | 20.7 (19.4–22.0)b | 34.1 (33.1–35.1)c | <0.001 |
| Plasma PLP, nmol/L | 55.2 (52.3–58.0)b | 75.4 (73.2–77.6)c | 56.5 (54.0–59.0)b | 71.3 (69.3–73.2)c | <0.001 |
| Riboflavin; EGRac (ratio) | 1.40 (1.38–1.41)b | 1.33 (1.32–1.34)c | 1.40 (1.39–1.42)b | 1.33 (1.32–1.34)c | <0.001 |
| Plasma homocysteine, µmol/L | 17.0 (16.5–17.4)b | 14.7 (14.4–15.0)c | 16.1 (15.7–16.4)d | 14.4 (14.1–14.6)c | <0.001 |
| B vitamin deficiency,e n (%) | |||||
| Combined B12 indexf (≤−1) | 172 (26) | 158 (14) | 231 (27) | 235 (17) | <0.001 |
| Folate (RBC ≤340 nmol/L) | 33 (5) | 18 (2) | 35 (4) | 18 (1) | <0.001 |
| Vitamin B6 (PLP <30.0 nmol/L) | 127 (19) | 106 (9) | 212 (25) | 154 (11) | <0.001 |
| Riboflaving (EGRac ≥1.40) | 249 (38) | 277 (24) | 309 (36) | 357 (26) | <0.001 |
Data presented are adjusted mean (95% CI) unless stated otherwise. χ2 for categorical variables; ANCOVA for continuous variables adjusted for age, sex, BMI, GFR, education, socioeconomic status [measured as area-level deprivation (35) and relevant drug use (PPIs, H2 receptor antagonists, glucose-lowering drugs, and metformin] with Tukey post hoc comparisons.
Participants were classed as nonregular (0 or ≤4 portions per week) or regular (≥5 portions per week) consumers of fortified foods. A small number of participants (n = 89; 2.1%) could not be classified as regards fortified food intake and are not included in this analysis.
Different letters within a given row denote statistically significant differences between any two specific groups for that variable.
For serum folate <10 nmol/L and RBC folate ≤340 nmol/L, an internationally accepted reference range was used (32). For other B vitamin biomarkers, reference ranges from analytical laboratory where assay was performed; for serum total B12 ≤148 pmol/L, plasma holoTC ≤35 pmol/L (30), plasma PLP <30.0 nmol/L (31). Elevated plasma homocysteine was classified as ≥15 µmol/L (33).
Combined B12 index was calculated with serum total vitamin B12, plasma holoTC, and plasma homocysteine values in combination to provide a diagnostic indicator, with a score ≤−1 defined as deficient status (26).
Riboflavin status was assessed with the EGRac ratio; a higher ratio indicates a lower riboflavin status, with deficient status generally indicated by a coefficient of ≥1.40 (29).
Discussion
This study assessed the impact of hyperglycemia and metformin on the biomarker status of all relevant B vitamins within one-carbon metabolism and investigated associations with cognitive health. The findings showed that hyperglycemia with metformin is associated with an increased risk of cognitive dysfunction in older adults, and we provide some evidence that specific B vitamin deficiencies may contribute, at least in part, to this risk. Our results showed an increased risk of vitamin B6 deficiency with metformin use, and we confirmed with greater accuracy the findings of previous studies that linked metformin use with deficient vitamin B12 status.
Very few previous studies have assessed vitamin B6 status in relation to hyperglycemia (36, 37), and none have considered the impact of metformin on vitamin B6 status. Compared with normoglycemic controls, vitamin B6 status (plasma PLP) was lower in participants on metformin treatment. Correspondingly, metformin use (but not hyperglycemia) was associated with a higher risk of vitamin B6 deficiency, by an estimated 48%. More studies are needed to investigate the mechanisms whereby metformin use could lead to vitamin B6 depletion.
In this study, metformin use was associated with a higher risk of vitamin B12 deficiency. Previous studies have reported similar effects of metformin treatment in patients with type 2 diabetes (38) and in large cohorts of older Americans (6, 7, 39). These, like other reports (8, 40), have relied solely on measurement of total vitamin B12 concentrations, and their findings are complicated by the use of different cutoff points for defining deficiency. Given inherent limitations with various B12 biomarkers, more than one biomarker is now recommended to accurately diagnose B12 deficiency (13, 41), with the recent emergence of approaches that identify deficient status by combining results from two or more biomarkers (26). The current study measured B12 status by using two direct biomarkers (total vitamin B12 and holoTC) and one functional biomarker (homocysteine) and combining these three biomarkers to calculate the combined B12 index. Although holoTC (the metabolically active fraction of total B12) when used alone is reported to be a more sensitive indicator than total vitamin B12 (14), the current study provides no evidence to support this notion, and unlike one previous study (40), this study found no significant relationship between metformin use and holoTC concentrations. The suggested mechanism leading to vitamin B12 deficiency may involve metformin causing B12 malabsorption by tying up free calcium necessary for absorption of the B12–intrinsic factor complex (9, 42) or causing a redistribution of B12 from plasma haptocorrin to the cell compartment (43). In any case, this and previous studies show an adverse effect of metformin on vitamin B12 status and suggest that B12 biomarkers should be monitored more closely in older adults being prescribed metformin.
Metformin use was not significantly associated with biomarker status of folate or riboflavin, the other B vitamins closely linked to vitamins B12 and B6 within one-carbon metabolism. Limited research investigating these vitamins in relation to diabetes has been previously conducted, but one recent study also reported no association of metformin use with folate status (44). In contrast, interventions with metformin (ranging 16 weeks to 4 years) were found to decrease folate concentrations modestly by 4% to 5% (45, 46). The inconsistent findings regarding folate may relate to differences between studies of dietary intakes of fortified foods, known to provide a highly bioavailable folate form, folic acid (32). In the current cohort, >70% of participants were identified as consumers of fortified foods, and thus biomarker status of folate was generally high, which may have been sufficient to overcome any small effect of metformin on folate status or limit the ability to detect it. Only one previous study has examined riboflavin in relation to diabetes (but not metformin) and reported lower biomarker status in diabetic patients (n = 100) vs healthy controls (37). A recent systematic review of 12 randomized controlled trials linked higher dosages of metformin with elevated homocysteine (a biomarker that is inversely related to folate, and to a lesser extent vitamins B12 and B6) and suggested that B vitamin treatment could lower homocysteine concentrations caused by metformin treatment (47). No significant association of metformin use with plasma homocysteine was found in the current analysis, a finding that is in general agreement with the lack of significant effect on folate status, although the dosage of metformin was not considered.
Cognitive dysfunction and dementia are comorbidities of diabetes, but the role of metformin in this relationship is unclear from existing evidence. In this analysis, metformin use was associated with an elevated risk of cognitive dysfunction (by 34% to 36%) according to the FAB and RBANS tests of cognitive performance. The FAB tool is designed to assess frontal lobe executive functioning (relevant to frontotemporal dementia), whereas RBANS is an age-adjusted tool for assessing global cognitive function. Although no significant effect of metformin on cognitive function was observed on the MMSE, this finding was not unexpected. The MMSE is the most widely used and internationally recognized screening tool for cognitive function, but it is criticized for its ceiling and floor effects and may lack the sensitivity to detect mild cognitive impairment in better educated people (48). Diabetes and metformin use were associated with poorer cognitive performance or increased risk of Alzheimer’s disease in previous studies including the PRIME cohort in Australia (n = 1354) (19) and in 71,433 patients with diabetes in Taiwan (49). However, the evidence in relation to metformin is inconsistent, because metformin treatment was previously reported to lower the risk of neurodegenerative diseases in one large study (50), whereas the US Diabetes Prevention Program Outcomes Study found no significant association of metformin with cognition (20). The mechanisms linking diabetes or metformin with cognitive dysfunction and dementia are unclear, but alterations in insulin, glucose, and amyloid metabolism may be implicated in the pathophysiology (51–53). Also, other comorbidities of diabetes including obesity and metabolic syndrome, considered independent risk factors for dementia, could be involved (54). One-carbon metabolism and related B vitamins are known to play important roles in cognition in older age (55), and the current results, showing specific B vitamin deficiencies in older adults with hyperglycemia, exacerbated by metformin, indicate that low B vitamin status may be an important factor contributing to the higher risk of cognitive dysfunction in patients with diabetes. Generally consistent with this interpretation, a recent study using MRI showed gray matter atrophy in B12-deficient older adults with diabetes (56). The current findings suggest that vitamin B6, along with vitamin B12 as previously suggested (19), could have roles in maintaining better cognitive health in older patients being treated with metformin.
Regular dietary intake of fortified food (i.e., five or more portions of fortified food per week) was associated with a higher biomarker status of all relevant B vitamins in hyperglycemic patients and normoglycemic controls in this analysis. This is in agreement with our previous observations in younger and older Irish adults (57, 58) and evidence from various countries worldwide also demonstrating a positive impact of B vitamin–fortified foods (59). Irrespective of metformin or other drug usage and even in the face of apparently adequate intakes, however, low vitamin B12 status can commonly occur in older age as a result of food-bound B12 malabsorption caused by atrophic gastritis, an age-related disorder reported to affect up to 30% of older adults (60). In the case of folate, regardless of age, poor bioavailability from natural food sources limits the achievement of optimal status (32). The current results indicate that fortified foods can overcome these challenges by providing a highly bioavailable source of B vitamins, potentially offering a practical means of offsetting any adverse effect on B vitamin status of metformin treatment, as shown here. Our findings may be particularly relevant in most European countries, where fortification of foods is on a voluntary basis or very limited (32) and micronutrient supplementation is minimal. Based on the current evidence, health professionals caring for patients with diabetes should specifically address B vitamin needs and could promote fortified foods (such as high-fiber breakfast cereals) as a source of bioavailable B vitamins, especially among those (>85% in the TUDA cohort) not choosing to take a B vitamin supplement. This recommendation is important in practical terms because patients with diabetes are often advised to replace fortified breakfast cereals with nonfortified sources such as porridge for improved glycemic control.
The current study has a number of strengths. The data were provided from one large and well-characterized cohort of older adults, recruited from two health jurisdictions in Europe (i.e., Ireland and the United Kingdom) with identical protocols. Also, whereas most previous studies in this area have typically relied on the MMSE test only, a particular strength of the current study was the use of three independent tests of cognitive performance, including the RBANS, a sensitive neuropsychiatric battery for global cognitive function. In addition, this study not only investigated the impact of hyperglycemia and metformin use on all B vitamins necessary for one-carbon metabolism but also assessed vitamin B12 via three biomarkers of status, whereas previous studies were limited by relying on the use of a single B12 biomarker. In addition, hyperglycemia and diabetes were defined on the basis of HbA1c results (rather than relying on self-reported diabetes only), thereby enabling an investigation of B vitamin status in people with existing, as well as those at risk of, diabetes. The main limitation was the cross-sectional design of the study; the results therefore cannot confirm causal relationships of diabetes and metformin use with B vitamin deficiency or prove that the B vitamin deficiencies observed are implicated in cognitive outcomes in diabetic patients. Furthermore, classification of diabetes as type 1 or type 2 was not available for this cohort, and duration of metformin treatment was classified only as lasting <6 months or >6 months.
In conclusion, use of metformin by older adults is associated with poorer cognitive performance. Deficiency of specific B vitamins (B6 and B12), found in hyperglycemia with metformin treatment, may be implicated. Fortified foods can provide a bioavailable source of B vitamins and may be beneficial for maintaining better cognitive health in older adults with, or at risk of diabetes, but this benefit must be confirmed in an intervention trial. Research is warranted to further investigate the interrelationships of diabetes, B vitamin status, and cognitive health in aging.
Acknowledgments
The authors thank the TUDA study participants throughout the island of Ireland and the wider TUDA research teams in both jurisdictions who made this study possible.
Financial Support: The TUDA study was supported by government funding from the Irish Department of Agriculture, Food and the Marine and Health Research Board (under the Food Institutional Research Measure, to H.M.) and from the Northern Ireland Department for Employment and Learning (under its Strengthening the All-Island Research Base initiative); the latter funding body also provided a PhD studentship for K.M.P.
Clinical Trial Information: ClinicalTrials.gov no. NCT02664584 (27 January 2016).
Author Contributions: H.M., M.W., C.F.H., and L.H. conceived and designed the study. K.M.P. and C.F.H. analyzed the data, and A.M. completed the network analysis. A.M.M. and A.M. were responsible for laboratory biomarkers and their interpretation. C.C., M.O., M.C.C., F.T., and K.M. provided clinical expertise and supervision. K.M.P wrote the original manuscript, and H.M., M.W., C.F.H., and L.H. contributed to the manuscript preparation. All authors reviewed and edited the final manuscript. H.M. and M.W. are the guarantors of the work and as such had full access to the data and take responsibility for the integrity of the data and the accuracy of the data analysis.
Disclosure Summary: The authors have nothing to disclose.
Abbreviations:
- ANCOVA
analysis of covariance
- BMI
body mass index
- EGRac
erythrocyte glutathione reductase activation coefficient
- FAB
Frontal Assessment Battery
- GFR
glomerular filtration rate
- holoTC
holo-transcobalamin
- MMSE
Folstein Mini–Mental State Examination
- PLP
pyridoxal 5-phosphate
- PPI
proton pump inhibitor
- RBANS
Repeatable Battery for Assessment of Neuropsychological Status
- RBC
red blood cell
- TUDA
Trinity, Ulster and Department of Agriculture
