


Abstract
We investigated potential interactions between body mass index (BMI) and genotypes of human leukocyte antigen (HLA), TCF7L2-rs7903146, and FTO-rs9939609 in relation to the risk of latent autoimmune diabetes in adults (LADA) and type 2 diabetes.
We pooled data from two population-based studies: (i) a Swedish study with incident cases of LADA [positive for glutamic acid decarboxylase autoantibodies (GADA); n = 394) and type 2 diabetes (negative for GADA; n = 1290) and matched controls without diabetes (n = 2656) and (ii) a prospective Norwegian study that included incident cases of LADA (n = 131) and type 2 diabetes (n = 1901) and 886,120 person-years of follow-up. Analyses were adjusted for age, sex, physical activity, and smoking. Interaction between overweight (BMI ≥ 25 kg/m2) and HLA/TCF7L2/FTO high-risk genotypes was assessed by attributable proportion due to interaction (AP).
The combination of overweight and high-risk genotypes of HLA, TCF7L2, and FTO was associated with pooled relative risk (RRpooled) of 7.59 (95% CI, 5.27 to 10.93), 2.65 (95% CI, 1.97 to 3.56), and 2.21 (95% CI, 1.60 to 3.07), respectively, for LADA, compared with normal-weight individuals with low/intermediate genetic risk. There was a significant interaction between overweight and HLA (AP, 0.29; 95% CI, 0.10 to 0.47), TCF7L2 (AP, 0.31; 95% CI, 0.09 to 0.52), and FTO (AP, 0.38; 95% CI, 0.15 to 0.61). The highest risk of LADA was seen in overweight individuals homozygous for the DR4 genotype [RR, 26.76 (95% CI, 15.42 to 46.43); AP, 0.58 (95% CI, 0.32 to 0.83) (Swedish data)]. Overweight and TCF7L2 also significantly interacted in relation to type 2 diabetes (AP, 0.26; 95% CI, 0.19 to 0.33), but no interaction was observed with high-risk genotypes of HLA or FTO.
Overweight interacts with HLA high-risk genotypes but also with genes associated with type 2 diabetes in the promotion of LADA.
Overweight is by far the most influential environmental risk factor for type 2 diabetes (1). Accumulating evidence indicates that excessive weight may also promote autoimmune diabetes in both children (2) and adults (3). We recently showed that obesity increased the risk of latent autoimmune diabetes in adults (LADA) three- to sixfold and that the risk was particularly high in those with a combination of overweight and family history of diabetes (4). This suggests that genetic susceptibility may modify the influence of overweight on the development of LADA.
LADA is described as a hybrid form of diabetes with a pathogenesis that includes autoimmune destruction of β cells as well as insulin resistance (5). Similar to type 1 diabetes, the genetic susceptibility to LADA is strongly linked to the human leukocyte antigen (HLA) gene complex, in particular DRB1 and DQB1, with the HLA-DRB1*04-DQB1*0302 and HLA-DRB1*0301-DQB1*0201 haplotypes conferring the highest risk (6–8). LADA has also been associated with variants increasing the risk of type 2 diabetes, such as in the transcription factor 7–like 2 (TCF7L2) gene in some (9–11) but not in all (12, 13) studies, including a recent genome-wide association study (GWAS) (8), as well as with variants in the fat mass and obesity-associated FTO gene in the Nord-Trøndelag Health Study (HUNT) (12).
To clarify the influence of overweight on the development of LADA, we investigated the risk of LADA compared with type 2 diabetes in relation to interaction between overweight and (i) HLA high-risk genotypes and (ii) risk variants in the TCF7L2 and FTO loci. For this purpose, we used data from two large population-based Scandinavian studies with incident cases of LADA and type 2 diabetes.
Materials and Methods
ESTRID
ESTRID (Epidemiological Study of Risk Factors for LADA and Type 2 Diabetes; https://ki.se/imm/estrid) is a population-based case-control study described in detail previously (14). It is a substudy of ANDIS (All New Patients with diabetes in Scania; http://andis.ludc.med.lu.se), a large-scale diabetes registry and biobank aiming at recruiting and characterizing all new cases of diabetes in the county of Scania in southern Sweden by means of clinical and genetic information (15). To ESTRID we have invited all incident cases of LADA registered in ANDIS since 2010, together with a random sample of incident cases of type 2 diabetes. Nondiabetic controls within ESTRID provide questionnaire information but no laboratory data (n = 1938). We included data for nondiabetic controls from EIRA (Epidemiological Investigation of Rheumatoid Arthritis; http://eirasweden.se) (16), an ongoing case-control study based on similar methods and questionnaire but also including biobank data. These controls are randomly selected from the Swedish population register and matched to the cases by age and sex. Analyses presented in this paper are based on all cases of LADA (n = 394) and type 2 diabetes (n = 1290) participating in ESTRID between 2010 and July 2017 and controls (inclusion criteria were age ≥ 35 years and no diabetes or rheumatoid arthritis; n = 2656), recruited to EIRA between 1996 and 2014, with information on body mass index (BMI), all covariates, and at least one of the genotypes of interest. All participants provided written informed consent, and the Regional Ethical Review Board in Stockholm approved the study.
In ANDIS, blood samples were taken at diagnosis and diabetes classification was based on age at diagnosis, glutamic acid decarboxylase autoantibodies (GADA), and fasting C-peptide. Analyses of GADA were performed by using ELISA (RSR Ltd., Cardiff, United Kingdom). Values >250 IU/mL are censored at 250 IU/mL, and the assay has a sensitivity of 84% and specificity of 98% for a cutoff level of 10.7 IU/mL (17). C-peptide was determined by using the Cobas e 601 analyzer (Roche Diagnostics, Mannheim, Germany) or IMMULITE 2000 (Siemens Healthcare Diagnostics Product Ltd., Llanberis, United Kingdom). LADA was defined as age at diabetes diagnosis ≥ 35 years, GADA positivity (≥10 IU/mL), and C-peptide level above the lower limit of the normal range [≥0.2 nmol/L (IMMULITE) or ≥0.3 nmol/L (Cobas)]. The LADA definition is in line with previously used criteria (5) with the exception of C-peptide, which has been suggested to be a more objective marker of remaining insulin production than the most commonly adopted insulin criterion (i.e., free of insulin treatment 3 to 12 months after diagnosis) (18). Criteria for type 2 diabetes were age ≥ 35 years, GADA negativity (<10 IU/mL), and C-peptide > 0.6 nmol/L (IMMULITE) or >0.72 nmol/L (Cobas).
DNA samples from the ANDIS biobank were analyzed at the Lund University Diabetes Centre using iPLEX Gold technology (Sequenom Laboratories, San Diego, CA). Imputation for missing genotypes was performed on a subset by using Infinium CoreExome v1.1 (Illumina, San Diego, CA), based on the Haplotype Reference Consortium (version r1.1 2016; http://www.haplotype-reference-consortium.org/) reference panel. DNA samples from the EIRA biobank were analyzed with the Illumina Global Screening array or an Infinium Illumina 300K immunochip custom array (Illumina). For the current study we used single nucleotide polymorphisms (SNPs) in the HLA region (rs3104413, rs2854275, rs9273363), the TCF7L2 gene (rs7903146), and the FTO gene (rs9939609). The HLA DRB1 and DQB1 genotypes associated with high (DR4/4, DR3/3, DR3/4, DR3/4-DQ8, DR4/4-DQ8, DR4/X-DQ8) or low/intermediate (DR4/X, DR3/X, DRX/X, DR4-DQ7) risk for type 1 diabetes were imputed from the SNP genotypes based on a previously described method validated with an overall accuracy of 99.3% (19).
Information on BMI and covariates was collected by questionnaire for all cases and controls at inclusion (median, 5 months after diagnosis for cases). Self-reported BMI was calculated as weight in kilograms divided by the square of height in meters, which shows high correlation with BMI based on clinical measurements from time of diagnosis (patients only) [r = 0.92; P < 0.0001 (mean ± SD, 30.4 ± 5.5 for self-reports vs 30.8 ± 5.6 for medical records; n = 1622 [LADA, n = 376; type 2 diabetes, n = 1246])]. Detailed information on smoking history was used to categorize individuals as never, former, or current smokers. Physical activity was assessed with validated questions on leisure time activity (20) during the preceding year, categorized as sedentary, low, moderate, or high activity.
HUNT
HUNT (21) consists of three health surveys (HUNT1, 1984 to 1986; HUNT2, 1995 to 1997; HUNT3, 2006 to 2008) conducted in the Norwegian county of Nord-Trøndelag. The surveys target all residents age ≥ 20 years and include detailed questionnaires on lifestyle and health, clinical examinations, anthropometric measurements, and blood sampling. For the current study, the analytical sample comprised all individuals free of diabetes at baseline, who participated in at least two surveys with baseline information on BMI, age, sex, physical activity, and smoking, as well as genotypes for HLA, TCF7L2, or FTO (n = 48,599). Participants provided informed consent, and the Norwegian Data Protection Authority and the Regional Committee for Medical and Health Research Ethics approved the study.
Incident cases of diabetes were identified by self-report at HUNT2 or HUNT3 [concordance with diagnosis from medical records was high; >95% (22)]. At screening, all cases with self-reported diabetes were invited to a follow-up examination at which fasting blood samples were collected (median, 4 years after diagnosis). Serum C-peptide measurements (not from time of diagnosis) were analyzed by radioimmunoassay (Diagnostic Systems Laboratories, Webster, TX). Serum GADA measurements were performed by immunoprecipitation radioligand assay by using translation labeled 3H-GAD65 (Novo Nordisk, Bagsværd, Denmark) and expressed as an index value relative to standard serum. In the Islet Autoantibody Standardization Program 2003 workshop, the assay had a sensitivity of 0.64 and a specificity of 1.00 at the cutoff antibody index ≥ 0.08 used in the current study, which equals ≥43 IU/mL according to the World Health Organization standard (23). LADA (n = 131) was defined as age ≥ 35 years at diagnosis and GADA positivity, and type 2 diabetes (n = 1901) was defined as age ≥ 35 years and GADA negativity. With these criteria, the LADA group will inevitably include also patients with adult-onset type 1 diabetes. However, the proportion is likely to be small; among those with information on treatment (87.8%, n = 115), most (81.7%) GADA-positive patients with adult onset reported that they were without insulin treatment during the first year after diagnosis.
DNA was extracted for all participants in HUNT2 and HUNT3 with available blood samples and was genotyped for SNPs associated with HLA-DRB1 and HLA-DQB1, TCF7L2 (rs7903146), and FTO (rs9939609) at the Norwegian University of Science and Technology Genomic Core Facility, Trondheim, by HumanCoreExome, Illumina Inc. (San Francisco, CA; https://www.ntnu.no/hunt/gwas-data). Imputation was performed using Minimac3 (v2.0.1, http://genome.sph.umich.edu/wiki/Minimac3) and a customized Haplotype Reference Consortium release 1.1 (HRC v1.1). Three SNPs tagging the HLA region were available in HUNT (rs2854275, rs9273363, rs9272346), of which two (rs2854275 and rs9273363) were the same as in ESTRID. Participants with at least one of the risk genotypes [rs2854275 (TT/TG), rs9273363 (AA), or rs9272346 (AA)] were considered to have a HLA high-risk genotype. Selection of the included SNPs was based on publicly available results from LADA and type 1 diabetes studies (13, 15, 19) and the availability in our data.
Weight and height from the baseline clinical examination were used to calculate BMI(weight in kilograms divided by height in meters squared). Baseline questionnaire information was used to classify individuals into never, former, or current smokers and to determine level of leisure time physical activity as sedentary, low, moderate, or high activity.
In both cohorts, fasting C-peptide and glucose were used to calculate homeostasis model assessment indices (24) of insulin resistance (HOMA-IR) and β-cell function (HOMA-B).
Statistical analyses
Differences in baseline characteristics were assessed with two-sided P values, calculated with Student t test for means (SD), Kruskal-Wallis for medians (interquartile range) of non–normally distributed variables (normality was assessed by visual evaluation of the distribution), and χ2 for proportions. The association between genotype and LADA/type 2 diabetes was assessed by ORs with 95% CIs derived by conditional logistic regression for case-control data and hazard ratios with CIs calculated by proportional Cox regression for prospective data, modeled with age as the underlying time scale. For convenience, we will use the term "relative risk" (RR) to describe the effect estimates in present study. In HUNT, person-years were calculated from age at baseline until age at onset of diabetes, death, or age at follow-up (in HUNT2 or HUNT3), whichever came first. Time-dependent variables were used, meaning that for individuals participating in both HUNT1 and HUNT2, information on exposure and covariates was updated at the second time of participation. All analyses were adjusted for age and sex (conditional variables in the case-control study) and, where specified, additionally for physical activity and smoking. Additional adjustment for education (primary school, upper secondary school, or university) and alcohol consumption (abstainers or low, moderate, or high consumers) did not influence the effect estimates (<10% change), and these variables were not included in the final model. Study-specific RRs were calculated and pooled using the inverse variance method (25). Both TCF7L2-rs7903146 (TT/TC vs CC) and FTO-rs9939609 (AA/AT vs TT) were analyzed with a dominant model. In the specific HLA DR-DQ genotype analyses, only Swedish data were used because we did not have SNPs tagging the DR4 genotype in HUNT. Patients with LADA were stratified by median GADA level [206 IU/mL (ESTRID) and 151 IU/mL (HUNT)], from here on referred to as LADAhigh and LADAlow. In HUNT, we also performed sensitivity analyses based on a stricter definition of LADA (i.e., no insulin treatment during the first year of diagnosis). Interaction between overweight and genotype, defined as departure from additivity of effects (superadditive associations), was assessed with attributable proportion (AP) due to interaction using the following formula: ([RR11 – RR10 – RR01 + 1]/RR11) (26), where RR11 is the risk among those with overweight and the high-risk genotype, RR10 is the risk among those with overweight and the low/intermediate-risk genotype, and RR01 is the risk among those with normal weight and the high-risk genotype. The reference group was normal-weight individuals without the genetic risk variant of interest. In an additional interaction analysis, we raised the cutoff for BMI to ≥30 kg/m2 to assess the impact of the genotypes in obese vs nonobese individuals. All statistical calculations were performed with SAS software, version 9.4 (SAS Institute, Cary, NC).
Results
Characteristics
In ESTRID (Table 1), individuals with LADA were leaner and younger, had lower insulin secretion (C-peptide and HOMA-B), but were less insulin resistant (HOMA-IR) than those with type 2 diabetes. The controls were younger and more often female than the patients; this difference was handled by postmatching in the subsequent analyses. In HUNT, patients with LADA and type 2 diabetes differed less than in ESTRID, but the patients with LADA had lower levels of C-peptide and were more often treated with insulin.
Characteristics of Study Participants
| Characteristic | ESTRID | HUNT | ||||||
|---|---|---|---|---|---|---|---|---|
| Controls | LADA | Type 2 Diabetes | P Valuea | No Diabetes | LADA | Type 2 Diabetes | P Valuea | |
| Participants, n | 2656 | 394 | 1290 | 46,567 | 131 | 1,901 | ||
| Men, % | 27.6 | 53.0 | 60.1 | 0.0132 | 46.7 | 48.9 | 52.8 | 0.3864 |
| Mean age at diagnosisb, y (SD) | 56.6 (9.4) | 58.6 (12.3) | 63.2 (10.3) | <0.0001 | – | 59.5 (11.2) | 60.7 (10.9) | 0.1914 |
| Mean age at baseline (HUNT), y (SD) | – | – | – | – | 48.9 (15.8) | 54.0 (11.4) | 54.6 (11.0) | 0.5418 |
| Mean BMI, kg/m2 (SD) | 25.5 (4.1) | 27.9 (5.2) | 31.2 (5.3) | <0.0001 | 25.9 (3.8) | 29.1 (4.8) | 29.8 (4.5) | 0.1066 |
| Overweight, % | 47.5 | 70.1 | 93.4 | <0.0001 | 56.2 | 82.4 | 88.3 | 0.0456 |
| With insulin treatment, % | – | 47.4 | 5.8 | <0.0001 | – | 45.8 | 15.0 | <0.0001 |
| Median GADA, IU/mL (IQR) | – | 206 (27–250) | – | – | – | 151 (59–613) | – | – |
| Median C–peptide, nmol/L (IQR)c | – | 0.66 (0.42–1.10) | 1.20 (0.95–1.60) | <0.0001 | – | 0.53 (0.18–0.91) | 0.86 (0.60–1.20) | <0.0001 |
| Median HOMA–B (IQR)c | – | 34.2 (13.3–65.1) | 68.1 (42.5–92.8) | <0.0001 | – | 58.5 (36.6–81.9) | 65.3 (43.8–92.9) | 0.2696 |
| Median HOMA–IR (IQR)c | – | 2.70 (1.80–4.40) | 3.60 (2.70–4.80) | <0.0001 | – | 2.05 (1.10–2.70) | 2.20 (1.60–3.10) | 0.0547 |
| High–risk HLA, % | 33.0 | 61.2 | 31.4 | <0.0001 | 42.5 | 60.3 | 40.7 | <0.0001 |
| TCF7L2–rs7903146, %d | 45.8 | 51.8 | 52.1 | 0.7795 | 44.2 | 44.3 | 54.9 | 0.0186 |
| FTO–rs9939609, %e | 64.33 | 66.3 | 67.5 | 0.5156 | 65.9 | 76.3 | 69.2 | 0.0847 |
P value for difference between LADA and type 2 diabetes.
Age at inclusion for control participants in ESTRID.
Clinical information was available for 100% of the patients in ESTRID and 70% of patients in HUNT (LADA, n = 104; type 2 diabetes, n = 1316).
Proportion with the TT/TC genotype.
Proportion with the AA/AT genotype. HLA high-risk: DR4/4, DR3/3, DR3/4, DR3/4-DQ8, DR4/4-DQ8 or DR4/X-DQ8.
Genotype and risk of LADA and type 2 diabetes
As expected, HLA high-risk genotypes were associated with LADA in both cohorts, for a pooled RR (RRpooled) of 2.74 (95% CI, 2.23 to 3.36). TCF7L2 was associated with LADA only in ESTRID [ESTRID vs. HUNT: RR, 1.30 (95% CI, 1.03 to 1.64) vs. 1.00 (95% CI, 0.71 to 1.41); RRpooled, 1.20 (95% CI, 0.99 to 1.45)], whereas FTO was significantly associated with LADA only in HUNT [RR, 1.11 (95% CI, 0.86 to 1.42) vs. RR, 1.65 (95% CI, 1.10 to 2.46); RRpooled, 1.24 (95% CI, 1.00 to 1.53)] (Fig. 1). Stratifying the analyses by median GADA level indicated that the association with HLA was stronger for LADAhigh than for LADAlow, whereas the association with TCF7L2 and FTO was restricted to LADAlow (27). When we restricted the analysis to LADAlow, the results regarding TCF7L2 and FTO were more consistent across studies (27). Use of a stricter LADA definition in HUNT (i.e., no insulin treatment) did not change the results (27). The highest risk for LADA was seen in those homozygous for the HLA DR4 allele (OR, 13.73; 95% CI, 9.35 to 20.18), of whom 91% also had the DQ8 risk genotype (ESTRID) (27). In both studies, type 2 diabetes was associated with TCF7L2 and FTO but not with HLA (Fig. 1).
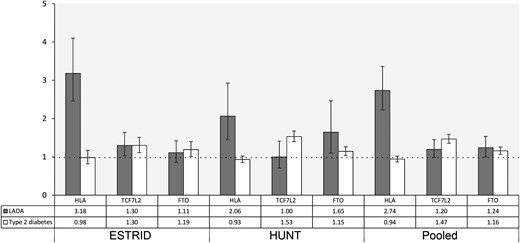
RRs and 95% CIs for LADA and type 2 diabetes by genotypes of HLA (high risk vs low/intermediate risk), TCF7L2 (TT/TC vs CC), and FTO (AA/AT vs TT). Adjusted for age and sex.
Gene-overweight interaction and risk for LADA
Individuals with a combination of overweight (BMI ≥ 25 kg/m2) and HLA high-risk genotypes had an almost eightfold increased risk for LADA (RRpooled, 7.59; 95% CI, 5.27 to 10.93) (Table 2), and a combination of DR4/4 and overweight appeared most detrimental [RR, 26.76; 95% CI, 15.42 to 46.43 (ESTRID)] (Fig. 2) (27). In comparison, the combination of overweight with TCF7L2 and FTO risk alleles yielded an RRpooled of 2.65 (95% CI, 1.97 to 3.56) and 2.21 (95% CI, 1.60 to 3.07), respectively.
RRs and APs Due to Interaction With 95% CIs in Relation to LADA for Different Combinations of BMI and Genotypes of HLA, TCF7L2, and FTO
| BMI Categories | Genotypes | ESTRID | HUNT | Pooled | ||||
|---|---|---|---|---|---|---|---|---|
| Cases (n) | Controls (n) | RR (95% CI) | Cases (n) | Person-Years | RR (95% CI) | RR (95% CI) | ||
| BMI ≥ 25 | HLA high risk | |||||||
| − | − | 42 | 637 | 1 (Reference) | 8 | 251,825 | 1 (Reference) | 1 (Reference) |
| + | − | 111 | 587 | 2.57 (1.69–3.92) | 44 | 258,428 | 3.86 (1.81–8.26) | 2.83 (1.96–4.09) |
| – | + | 76 | 325 | 3.84 (2.43–6.05) | 15 | 186,239 | 2.55 (1.08–6.01) | 3.51 (2.35–5.25) |
| + | + | 165 | 277 | 7.56 (4.97–11.50) | 64 | 189,628 | 7.67 (3.65–16.09) | 7.59 (5.27–10.93) |
| AP (95% CI) | 0.28 (0.05–0.52) | 0.29 (0.00–0.59) | 0.29 (0.10–0.47) | |||||
| BMI ≥ 25 | TCF7L2 TT/TC | |||||||
| – | − | 58 | 756 | 1 (Reference) | 18 | 241,094 | 1 (Reference) | 1 (Reference) |
| + | − | 121 | 672 | 1.91 (1.34–2.73) | 55 | 251,403 | 2.10 (1.22–3.61) | 1.97 (1.46–2.65) |
| – | + | 55 | 631 | 1.19 (0.79–1.80) | 5 | 196,969 | 0.34 (0.13–0.91) | 0.43 (0.36–0.51) |
| + | + | 137 | 576 | 2.67 (1.88–3.79) | 53 | 196,654 | 2.60 (1.51–4.47) | 2.65 (1.97–3.56) |
| AP (95% CI) | 0.21 (–0.07 to 0.49) | 0.45 (0.11–0.78) | 0.31 (0.09–0.52) | |||||
| BMI ≥ 25 | FTO AA/AT | |||||||
| – | − | 47 | 475 | 1 (Reference) | 9 | 156,631 | 1 (Reference) | 1 (Reference) |
| + | − | 78 | 387 | 1.61 (1.06–2.44) | 22 | 144,128 | 1.91 (0.87–4.16) | 1.67 (1.16–2.42) |
| – | + | 66 | 794 | 0.80 (0.53–1.22) | 14 | 281,432 | 0.87 (0.38–2.02) | 0.81 (0.56–1.18) |
| + | + | 180 | 761 | 1.93 (1.33–2.79) | 86 | 303,929 | 3.58 (1.79–7.15) | 2.21 (1.60–3.07) |
| AP (95% CI) | 0.27 (–0.06 to 0.59) | 0.50 (0.17–0.83) | 0.38 (0.15–0.61) | |||||
Adjusted for age, sex, smoking, and physical activity. HLA high risk: DR4/4, DR3/3, DR3/4, DR3/4–DQ8, DR4/4–DQ8 or DR4/X–DQ8.

RRs and 95% CIs for LADA in relation to different combinations of BMI and genotypes of HLA DRB1 in ESTRID. *Reference is normal-weight individuals with low/intermediate-risk HLA genotypes. Adjusted for age, sex, smoking, and physical activity.
Moreover, there was a significant interaction between overweight and all genotypes; pooled AP (APpooled) was 0.29 (95% CI, 0.10 to 0.47) for HLA; 0.31 (95% CI, 0.09 to 0.52) for TCF7L2, and 0.38 (95% CI, 0.15 to 0.61) for FTO, suggesting that ∼29% to 38% of the LADA cases exposed to both risk factors might be prevented by maintaining a normal weight (Table 2). Overall, these results were consistent across cohorts (Table 2). The interaction between overweight and HLA was primarily observed for LADAhigh and the interaction with TCF7L2 primarily with LADAlow (27).
The combination of obesity (BMI ≥ 30 kg/m2) and risk genotypes yielded an even higher risk for diabetes (27); notably, individuals with obesity and HLA risk genotypes had an RRpooled for LADA of 9.20 (95% CI, 6.53 to 12.96), with an estimated pooled AP of 0.41 (95% CI, 0.21 to 0.62).
Gene-overweight interaction and risk for type 2 diabetes
Interaction was observed between overweight and the TCF7L2 risk allele; the joint exposure increased the risk 10-fold (RRpooled, 10.14; 95% CI, 8.42 to 12.22), which corresponded to an APpooled of 0.26 (95% CI, 0.19 to 0.33) (Table 3). No interaction was observed between overweight (Table 3) and either FTO or HLA. Findings were similar in obese vs nonobese individuals (27).
RRs and APs Due to Interaction With 95% CIs in Relation to Type 2 Diabetes for Different Combinations of BMI and Genotypes of HLA, TCF7L2, and FTO
| BMI Categories | Genotypes | ESTRID | HUNT | Pooled | ||||
|---|---|---|---|---|---|---|---|---|
| Cases (n) | Controls (n) | RR (95% CI) | Cases (n) | Person-Years | RR (95% CI | RR (95% CI) | ||
| BMI ≥ 25 | HLA high risk | |||||||
| − | − | 57 | 637 | 1 (Reference) | 124 | 251,825 | 1 (Reference) | 1 (Reference) |
| + | − | 825 | 587 | 16.49 (11.42–23.81) | 1004 | 258,428 | 5.61 (4.65–6.77) | 7.01 (5.93–8.29) |
| − | + | 27 | 325 | 1.48 (0.85–2.58) | 98 | 186,239 | 1.06 (0.82–1.39) | 1.13 (0.89–1.43) |
| + | + | 376 | 277 | 15.51 (10.50–22.90) | 675 | 189,628 | 5.16 (4.25–6.26) | 6.42 (5.39–7.63) |
| AP (95% CI) | –0.09 (–0.34 to –0.15) | –0.10 (–0.22 to 0.02) | –0.10 (–0.21 to 0.01) | |||||
| BMI ≥ 25 | TCF7L2 TT/TC | |||||||
| − | − | 40 | 756 | 1 (Reference) | 95 | 241,094 | 1 (Reference) | 1 (Reference) |
| + | − | 556 | 672 | 14.73 (10.01–21.68) | 763 | 251,403 | 5.46 (4.40–6.77) | 6.91 (5.72–8.34) |
| − | + | 43 | 631 | 1.64 (1.00–2.70) | 127 | 196,969 | 1.63 (1.25–2.12) | 1.63 (1.29–2.06) |
| + | + | 606 | 576 | 18.78 (12.74–27.69) | 916 | 196,654 | 8.43 (6.82–10.43) | 10.14 (8.42–12.22) |
| AP (95% CI) | 0.18 (0.03–0.33) | 0.28 (0.20–0.36) | 0.26 (0.19–0.33) | |||||
| BMI ≥ 25 | FTO AA/AT | |||||||
| − | − | 30 | 475 | 1 (Reference) | 76 | 156,631 | 1 (Reference) | 1 (Reference) |
| + | − | 375 | 387 | 12.52 (8.01–19.58) | 510 | 144,128 | 5.23 (4.10–6.66) | 6.38 (5.15–7.90) |
| − | + | 53 | 794 | 1.07 (0.64–1.79) | 146 | 281,432 | 1.08 (0.82–1.43) | 1.08 (0.84–1.38) |
| + | + | 787 | 761 | 14.23 (9.24–21.92) | 1169 | 303,929 | 5.72 (4.53–7.22) | 7.13 (5.77–8.82) |
| AP (95% CI) | 0.12 (–0.06 to 0.29) | 0.07 (–0.04 to 0.18) | 0.08 (–0.01 to –0.18) | |||||
Adjusted for age, sex, smoking and physical activity. HLA high risk: DR4/4, DR3/3, DR3/4, DR3/4–DQ8, DR4/4–DQ8 or DR4/X–DQ8.
Discussion
We found a striking interaction between overweight/obesity and high-risk HLA genotypes in relation to the risk for LADA. Furthermore, the risk conferred by excess weight was especially high in those with the DR4/4 genotype. We also present results suggesting that excess weight interacts with TCF7L2 and FTO risk alleles in the promotion of LADA but only with TCF7L2 in promoting type 2 diabetes.
We confirm that HLA is strongly associated with the risk for LADA (6–8). The association with TCF7L2 and FTO was much weaker and primarily seen for LADA with low GADA levels. Previous studies on LADA and FTO (12, 13, 28) and TCF7L2 (9–13, 29) have yielded inconsistent results, including a recent GWAS that did not find an association with either genotype (8). The lack of association may reflect limited power, especially in the GWAS, where the nominal P value was significant, but not at the genome-wide significance level. It may also reflect the heterogeneity of LADA, as shown here and in previous analyses of TCF7L2 in relation to high and low GADA levels (11, 12, 29). With regard to type 2 diabetes, we confirm earlier studies indicating that the risk is associated with TCF7L2 and FTO but not HLA (5).
The highest risk for LADA was seen in individuals with a combination of overweight/obesity and high-risk HLA genotypes. The HLA complex is responsible for regulating the immune system and polymorphisms in this region are associated with development of insulin deficiency, presumably through autoimmune destruction of the pancreatic β cells (30). The influence of excess weight on LADA risk may be mediated by insulin resistance (4). One can hypothesize that when insulin resistance increases the need for insulin and β cells fail to compensate for this need because of genetically determined insulin deficiency, the risk for diabetes escalates. This fits with the accelerator hypothesis, which proposes that both type 2 diabetes and autoimmune diabetes are the result of disequilibrium between insulin sensitivity and insulin production (31). Another possibility is that high BMI promotes autoimmunity and adds to the genetically induced autoimmune reactivity. In support of that suggestion, Rolandsson et al. (32) found a positive association between BMI and GADA levels in a sample of nondiabetic individuals. Moreover, higher BMI has been associated with higher expression of the GAD2 gene in β cells of nondiabetic persons (33). In apparent contrast to these observations, several studies have shown an inverse association between BMI and GADA levels among patients with LADA (4, 5, 34); however, one study showed that antibodies to a fragment of IA2 [protein tyrosine phosphatase islet antigen-2 (256-760)]was associated with obesity in patients with LADA (35). However, this inverse association between two risk factors of LADA may reflect collider bias because the study sample was restricted to patients with LADA (36).
The strongest interaction was observed in overweight individuals with the DR4/DR4 genotype, which to our knowledge has not been investigated previously. In this context, it is noteworthy that a significant interaction between HLA-DRB1*15 and adolescent obesity is observed in relation to the risk for multiple sclerosis (37). Further support is found in studies of type 1 diabetes in children; a Swedish case-only study (38) found a significant synergistic effect between overweight and HLA high-risk genotypes and results from the TEDDY study suggests that obesity could mediate the effect of HLA-DQ2/2 genotype on diabetes risk (39).
We also observed interaction between overweight and TCF7L2 in relation to both LADA and type 2 diabetes. The TCF7L2 locus is involved in the function of β cells, and the rs7903146 risk variant is associated with increased gene expression in islets and reduced insulin secretion in a nonautoimmune fashion (40). Consequently, the excess risk seen in those exposed to both risk factors could be explained by failure of the β cells in carriers of TCF7L2 to compensate for obesity-induced insulin resistance in a similar way as described above. We found no previous reports of the combined effect of high BMI and TCF7L2 on LADA or type 2 diabetes. However, if we recalculate the numbers presented in Table 1 in the Hungarian LADA study by Lukacs et al. (10), there is no interaction, and, in contrast to our findings, no overall association between overweight and LADA is seen. These inconsistences may relate to differences in the populations or in study design (e.g., the Hungarian study was based on prevalent cases that were both younger and leaner than those included in this study). However, in keeping with our results are data from Cauchi et al. (41); when we recalculate the numbers in Table 1, the results indicate additive interaction between obesity and the TCF7L2 TT/TC genotype with AP estimated to 18.4%.
Similarly, a significant interaction between overweight and FTO was seen in LADA. The FTO gene is suggested to affect energy homeostasis control, with increased hunger and increased body fat in those with the risk variant (42). It has also been suggested that diet and eating behavior modulate the effect of FTO (42). A mechanistic explanation may be that environmental risk factors exaggerate the risk of overweight and subsequent insulin resistance and diabetes in genetically susceptible individuals. Clearly these findings need confirmation, especially because we did not find any interaction for type 2 diabetes.
The strengths of this study include the possibility of replicating our findings in two large independent populations, the enrollment of incident cases, and the detailed information on potential confounders. The self-reported information on weight and height in ESTRID is a drawback that may have led to an underestimation of the association between BMI and LADA/type 2 diabetes (43). We were able to validate the self-reports of the patients and found the correlation with information from their medical records to be high. In HUNT we had the advantage of using anthropometric measurements. In ESTRID, cases were matched to controls from another study population. The validity of this approach is supported by the fact that the results regarding LADA/type 2 diabetes and BMI were similar to those of a previous report in which we used the controls recruited within ESTRID, for whom we did not have genetic information (4).
Related to control sampling is also the fact that different assays were used for genotyping the cases and controls; thus, a possible batch effect could have influenced these results. Such an effect is most likely minor because our findings agree with what has been reported previously (5, 10–12).
With regard to diagnostic criteria, LADA was distinguished from type 2 diabetes by only one autoantibody. This implies that some patients with autoimmune diabetes may have been included in the type 2 diabetes group. The proportion is likely to be small because GADA is the most common autoantibody in LADA; 90% of patients with LADA in the Action LADA study and 99% in a substudy of HUNT were positive for GADA (44, 45). In addition, some patients with LADA may have converted to seronegativity after diagnosis in HUNT, in which GADA were assessed several years after diagnosis (45). Importantly, the lack of association between HLA risk genotypes and type 2 diabetes indicates that the proportion of misclassified autoimmune diabetes patients was small. In addition, the risk associated with TCF7L2 was similar in those with low and high GADA levels in ESTRID and in a previous study from Finland (11), although not in HUNT. Moreover, even though specificity of the GADA assay was high, it is possible that some patients with type 2 diabetes were misclassified as having LADA. Notably we observed a strong association with HLA high-risk genotypes and LADA, including LADAlow, which indicates that we did manage to isolate an autoimmune patient group.
The criteria used to distinguish between LADA and type 1 diabetes with adult onset differed across studies; we used C-peptide levels in ESTRID and lack of insulin treatment within the first year following diagnosis in HUNT (sensitivity analysis). Although the LADA population in HUNT by definition is enriched by patients with type 1 diabetes, the proportion of GADA-positive patients in that age group is likely to be small. This is supported by the fact that they tended to have a more type 2–like phenotype than the patients with LADA in ESTRID with higher HOMA-B levels, higher mean BMI, and a stronger association with the FTO risk variant. This points at the heterogeneous nature of LADA (46).
In this context it is important to note that results regarding interaction between BMI and HLA in relation to LADA risk were consistent across studies. Insulin treatment was more common in ESTRID than in HUNT but this most likely reflects differences in treatment strategies than in phenotype; although debated (46), early intervention with insulin has been suggested to preserve endogenous insulin secretion in LADA (18), and this could explain the frequent insulin treatment of the Swedish patients. With respect to generalizability, this report is based on Scandinavian populations; hence, replications in other populations with different ethnic and genetic backgrounds are warranted to expand the generalizability of the findings.
Conclusions
Our study suggests that overweight strongly interacts with HLA high-risk genotypes but also with risk variants of TCF7L2 and FTO in LADA, indicating that excessive weight is a particularly strong risk factor for LADA in individuals with genetic susceptibility. As such, our data put forward that lifestyle modification to maintain a healthy weight may be particularly important for prevention of LADA among people with HLA risk alleles.
Acknowledgments
We thank all administrative and laboratory personnel, nurses and research team members and all study participants from ESTRID, EIRA, ANDIS, and HUNT for generously contributing to the study.
Financial Support: ESTRID (S.C.) received funding from the Swedish Research Council, the Swedish Research Council for Health, Working life and Welfare, AFA Insurance Company, the Swedish Diabetes Association, and the Novo Nordisk Foundation. Funding for EIRA (L.A.) was provided by the Swedish Research Council; the Swedish Research Council for Health, Working Life and Welfare; the Swedish Rheumatic Foundation; the AFA Insurance Company; and Stockholm County Council. Financial support for ANDIS (L.G.) came from the Swedish Research Council and the European Research Council Advanced Researcher grant (GA 269045) (L.G.) and ALF (the Swedish Research Council funding for clinical research). The HUNT study is a collaboration between the HUNT Research Centre (Faculty of Medicine and Health Sciences, Norwegian University of Science and Technology), Nord-Trøndelag County Council, Central Norway Regional Health Authority, and the Norwegian Institute of Public Health. GlaxoSmithKline Norway financially supported the diabetes study at HUNT2 and HUNT3 through the Norwegian University of Science and Technology. The genotyping in the HUNT study was financed by the National Institutes of Health, University of Michigan, The Research Council of Norway, and Central Norway Regional Health Authority and the Faculty of Medicine and Health Sciences, Norwegian University of Science and Technology. Genotype quality control and imputation were conducted by the K.G. Jebsen Center for Genetic Epidemiology, Department of Public Health and Nursing, Faculty of Medicine and Health Sciences, Norwegian University of Science and Technology.
Additional Information
Author Contributions: All authors contributed to the interpretation of the results and critically revised and approved the final version of the manuscript. Contributions to the data collection was made by S.C., R.H., J.E.L. and T.A. (ESTRID), L.A. (EIRA), L.G., E.A., T.T. (ANDIS), E.P.S., V.G. and B.O.Å. (HUNT). J.E.L. contributed to the data analysis. T.A. contributed with statistical expertise. S.C. was responsible for the conceptualized research objectives and designed the study and thoroughly revised the manuscript. R.H. developed the objectives of the study and was responsible for drafting of the manuscript and analyzing the data and takes full accountability for the accuracy of the analyses and the work as a whole.
Disclosure Summary:
The authors have nothing to disclose.
Data Availability: Restrictions apply to the availability of data generated or analyzed during this study to preserve patient confidentiality or because they were used under license. The corresponding author will on request detail the restrictions and any conditions under which access to some data may be provided.
Abbreviations:
- ANDIS
All New Patients with diabetes In Scania
- AP
attributable proportion
- APpooled
pooled attributable proportion
- BMI
body mass index
- EIRA
Epidemiological Investigation of Rheumatoid Arthritis
- ESTRID
Epidemiological Study of risk factors for LADA and Type 2 Diabetes
- GADA
glutamic acid decarboxylase autoantibodies
- GWAS
genome-wide association study
- HLA
human leukocyte antigen
- HOMA-B
homeostasis model assessment of β-cell function
- HOMA-IR
homeostasis model assessment of insulin resistance
- HUNT
Nord-Trøndelag Health Study
- LADA
latent autoimmune diabetes in adults
- RR
relative risk
- RRpooled
pooled relative risk
- SNP
single nucleotide polymorphism
