


Abstract
There are scant reports on the pathological changes of the exocrine and endocrine pancreas in fulminant type 1 diabetes mellitus (FT1DM).
To clarify the distinct pathological changes in the exocrine as well as the endocrine pancreas shortly after onset of diabetes in FT1DM.
The exocrine and endocrine pancreases of 3 patients with FT1DM and 17 nondiabetic controls were immunohistochemically examined for islet and exocrine tissue inflammation, infiltrating mononuclear cell (MNC) CD subtype, enterovirus capsid protein 1 (VP1) localization, and CXC chemokine ligand 10 (CXCL10) and CXC chemokine receptor 3 (CXCR3) expressions.
The median frequency of insulitis in the 3 FT1DM pancreases was 60%. In the nondiabetic control pancreases, no insulitis was observed. In the islets of FT1DM, the numbers of CD45+, CD3+, CD8+, CD68+, and CD11c+ MNCs were significantly higher than those of the control group. In the exocrine pancreas of FT1DM, the numbers of CD3+ T cells, CD8+ T cells, CD68+ macrophages, and CD11c+ dendritic cells were significantly higher than those of the control group. Infiltrating CD8+ T cells, CD68+ macrophages, and CD11c+ dendritic cells were observed around exocrine acinar cells in FT1DM. There was a close association between VP1 and CXCL10 expression in pancreatic exocrine ductal cells and acinar cells as well as islet cells in FT1DM. CXCL10+ exocrine cells were surrounded by CXCR3+ T cells.
The pathological findings suggested that suppression of the activated CXCL10–CXCR3 axis in the exocrine as well as the endocrine pancreas is a novel therapeutic target in FT1DM and possibly in enterovirus-associated acute-onset type 1 diabetes.
Fulminant type 1 diabetes mellitus (FT1DM) is characterized by extensive destruction of pancreatic β cells, followed by rapid hyperglycemia, diabetic ketoacidosis, and coma (1–4). Serological studies have reported an association between high titers of IgA antibody (Ab) against enterovirus (5) and the expression of enterovirus capsid protein 1 (VP1) in autopsied pancreatic islets (6). In addition to rapid destruction of islet β and α cells, destruction of exocrine cells is also suggested; therefore, serum levels of pancreatic exocrine enzymes, such as amylase and lipase, are elevated at onset (1, 2), and pancreatic swelling is detected radiologically in FT1DM (3). We previously reported that autoantibodies against amylase α-2A in the serum of patients with FT1DM were detected at a high frequency (7). However, reports of pathological changes in the exocrine and endocrine pancreas shortly after the onset of diabetes are scarce in FT1DM. This may be due to the fact that inflammatory changes of the pancreas in FT1DM subside a few weeks after onset of diabetes (2, 4). This study aimed to clarify the pathological changes of the exocrine as well as the endocrine pancreas in FT1DM subjects who died within 1 week after the onset of diabetes.
Materials and Methods
Subjects
Pancreatic tissue acquisition and data collection were performed between 1982 and 2014 (4, 6, 8, 9). The pancreatic samples were obtained from Toranomon Hospital (Tokyo, Japan), the University of Yamanashi (Yamanashi, Japan), Saitama Social Insurance Hospital (Saitama, Japan), and Tokyo Saiseikai Central Hospital (Tokyo, Japan). Three pancreases from patients with FT1DM and 17 pancreases from nondiabetic controls were examined. All subjects were of Japanese ethnic origin. This report presents the results from pancreases obtained from autopsied samples. The mean age of the three patients with FT1DM was 23 ± 8 years, all men (Table 1). Duodenal mucosa, which was coincidently found to be attached to pancreatic tissue in the paraffin block of one case with FT1DM (case 1), was also studied. All patients with FT1DM were negative for glutamic acid decarboxylase (GAD) autoantibodies, and serum C-peptide was depleted at onset (Table 1). All patients with FT1DM died 2 to 5 days after onset due to diabetic ketoacidosis (6). Patients with programmed cell death 1 (PD-1) Ab–related FT1DM were excluded. The causes of death of the 17 nondiabetic controls were: pneumonia (n = 1), chronic renal failure (n = 2), cerebral infarction (n = 1), acute myocardial infarction (n = 1), retroperitoneal tumor (n = 1), intestinal bleeding (n = 1), duodenal cancer (n = 4), gastrinoma (n = 1), colon cancer (n = 1), and biliary cancer (n = 4). No patients received treatment with glucocorticoids. The average age of the control group, which consisted of nine men and eight women, was 66 ± 7 years.
Clinical Characteristics of the Subjects With FT1DM and Nondiabetic Controls
| Case Subject | Age, y | Sex | Duration of Diabetes, d | GADAb, U/mL/ICA, JDF U | Pancreatic Weight, g | Blood C-Peptide, ng/mL | Serum Elastase I, ng/mL | BMI, kg/m2 | Treatment of Diabetes | Noninsulin Requiring Period, y | Cause of Death |
|---|---|---|---|---|---|---|---|---|---|---|---|
| FT1DM | |||||||||||
| FT-1 | 14 | M | 5 d | Negative/negative | nd | <0.02 | — | nd | Insulin | 0 | DKA |
| FT-2 | 25 | M | 2 d | Negative/nd | nd | <0.02 | 679a | nd | Insulin | 0 | DKA |
| FT-3 | 29 | M | 2 d | Negative/nd | nd | <0.02 | — | nd | Insulin | 0 | DKA |
| Mean ± SD | 23 ± 8 | M/F: 3/0 | 3 ± 2 | Negative | nd | 0 | — | nd | 0 | ||
| Range | 14–29 | 2-5 | |||||||||
| Non-DC | |||||||||||
| ND-1–17b | — | — | |||||||||
| Mean ±SD | 66 ± 7 | M/F: 9/8 | — | Negative/nd | 78.8 ± 9.2 | nd | — | 21.5 ± 3.0 | — | ||
| Range | 53–74 | 63.1–95.1 | 16.4–27.3 | — | — | See text |
Abbreviations: DKA, diabetic ketoacidosis; F, female; JDF U, Juvenile Diabetes Foundation units; M, male; nd, not detected, non-DC, nondiabetic control.
Normal range, 12 to 221 ng/dL.
Nondiabetic control.
Tissue preparation and histochemical and immunohistochemical analyses
The tail and body regions of each pancreas were obtained for pathological analyses of islet morphology. Quantification analyses including β cell area, frequency of insulitis, and mononuclear cell (MNC) subtyping in islets and exocrine pancreatic tissues were performed on pancreatic tissues from the midpoint of the pancreas to the position one-fourth the distance to the end of the pancreatic tail, as this region is regarded as being representative of the morphometric parameters of the entire pancreas (10). Pancreatic tissues were 4% formalin-fixed and paraffin-embedded. Immunohistochemical analyses of MNCs for CD subtyping, enterovirus VP1 protein localization, CXC chemokine ligand 10 (CXCL10) and CXC chemokine receptor 3 (CXCR3) expressions, and morphometric analysis of β and α cells were performed using the immunoperoxidase method, and marking of islets (insulin and glucagon) was performed using an immunofluorescence method in all sections (4, 6, 8). Primary and secondary antisera and dilution ratios are listed in an online repository (11). To confirm the validity of our immunohistochemical staining for pancreatic enterovirus VP1 using 5D8/1, we conducted the following preliminary experiments. We first examined whether 5D8/1 antiserum (1:400) was absorbed by VP1 protein (antibodies-online.com, Aachen, Germany) at 10 and 20 μg/mL. 5D8/1 antiserum incubated with VP1 protein overnight completely lost immunoreactivity for VP1 in FT1DM islet and exocrine pancreas (11). Next, we examined whether 5D8/1 antiserum was absorbed by creatine kinase B (Sigma-Aldrich, St. Louis, MO), which potentially interferes with specific immunolabeling for VP1 (12), at a concentration of 10 and 20 μg/mL overnight prior to VP1 staining. However, VP1 staining was not affected. Finally, we confirmed positive immunostaining for VP1 using another Ab, which recognizes coxsackievirus types B1, B2, B3, B4, B5, and B6 (LC-C 79834; LSBio, Seattle, WA). Using this Ab, some islet cells and pancreatic exocrine cells were stained densely for VP1 similar to the pattern of VP1 stained by 5D8/1 Ab. Freshly cut/prepared pancreatic sections were used for VP1 immunolabeling. The islet was judged as VP1+ when at least one of islet cells tested stained positive for VP1. Two independent assessments were performed in a double-blind manner.
Assessment of islet inflammation, insulitis, and pseudoatrophic islets
To minimize possible sampling bias for counting CD marker+ MNCs in the islets, MNC counting was performed using serial sections (4 μm thick) stained by triple immunostaining: β and α cells were stained by immunofluorescence, and CD marker+ MNCs were stained by immunoperoxidase staining. Principally, >10 islets with long diameters of ≥50 μm and with >10 α cells were acquired in the captured images at ×200 magnification (DP73; Olympus, Tokyo, Japan). Principally, surface markers for CD45, CD3, CD8, CD4, CD20, CD11c, CD68, VP1, CXCL10, and CXCR3 were stained on the serial pancreatic sections (8). In the captured images, the number of CD+ cells stained by immunoperoxidase in islet areas marked by glucagon-positive cells was counted. Insulitis was defined as: 1, presence of ≥15 CD45+ cells immediately adjacent to or within three or more islets; 2, predominant lymphocytic infiltration; and 3, presence of pseudoatrophic islets (insulin-negative) (13). The association between VP1+ islets and immune cell infiltration (insulitis) represented by the concordance rate was calculated as follows: concordance rate (insulitis/VP1) = (frequencies of islets with insulitis/frequencies of VP1+ islets in each case) × 100. The association between VP1+ islets and CXCL10+ islets represented by the concordance rate was calculated as follows: concordance rate (CXCL10/VP1) = (frequencies of islets positive for CXCL10/frequencies of VP1+ islets in each case) × 100. Pseudoatrophic islets were defined as islets devoid of β cells having a long diameter of >50 μm.
Estimation of islet β and α cell areas
The β and α cell areas were measured morphometrically using cellSens software (version 1.16; Olympus, Tokyo, Japan). At least five pancreatic sections were measured, and the average values were expressed as percentages of the total section area (percentage β cell area, α cell area).
Examination of pancreatic exocrine tissues
The numbers of CD45+, CD3+, CD8+, CD4+, CD68+, and CD11c+ MNCs in pancreatic exocrine cells were counted in five randomly selected images of pancreatic sections (1.4 × 1.1 mm2; ×100 magnification) using cellSens software. The average number of CD45+, CD3+, CD8+, CD4+, CD68+, and CD11c+ cells in the exocrine tissues was used as an individual sample for further statistical analysis.
Assay methods for GAD Ab and islet cell Ab
Levels of GAD Ab were measured using fluid phase RIA (RSR, Cardiff, UK), and GAD Ab titers of ≥1.5 U/mL or higher were judged to be positive (14). The sensitivity and specificity of the GAD Ab assay were 80% and 100%, respectively, as reported in the Second International Glutamic Acid Decarboxylase Antibody Workshop (15). Islet cell Abs (ICAs) were assayed by immunofluorescence methods (16). Our laboratory participated in the second through fifth international workshops on standardization of the ICA assay, in which our laboratory B was in the highest quality class (detection limit <5 Juvenile Diabetes Foundation units, precision score of 0.65, and specificity of 100%) (17).
Ethics
Written, informed consent was obtained from the next of kin on behalf of the autopsied patients. All procedures used in this study were approved by the ethics committees of the University of Yamanashi and Toranomon Hospital.
Statistical analysis
A Fisher exact test was used to evaluate the frequencies of lesions. Comparisons between groups were performed using the Mann–Whitney U test. Values are expressed as means (SD) or medians depicted by box-and-whisker plots. P values <0.05 were considered significant.
Results
Frequency of insulitis, β and α cell volumes, and pseudoatrophic islets
The median frequency of defined insulitis observed in the 3 FT1DM pancreases was 60.0% (Fig. 1A). In comparison, no insulitis was observed in the 17 nondiabetic control pancreases. The β cell area in FT1DM pancreases was markedly decreased, whereas in the control group the β cell area was well preserved, 1.39% (Fig. 1B). For α cell area, the values in control pancreases (median, 0.42%) tended to be higher than those in FT1DM pancreases (median, 0.28%); however, no significant difference was observed (P = 0.26) (Fig. 1C). The frequency of pseudoatrophic islets in the pancreas was 10% in one case of FT1DM, but in the other two cases, values were ≥95%. In contrast, no pseudoatrophic islets were found in the nondiabetic control group (Fig. 1D).
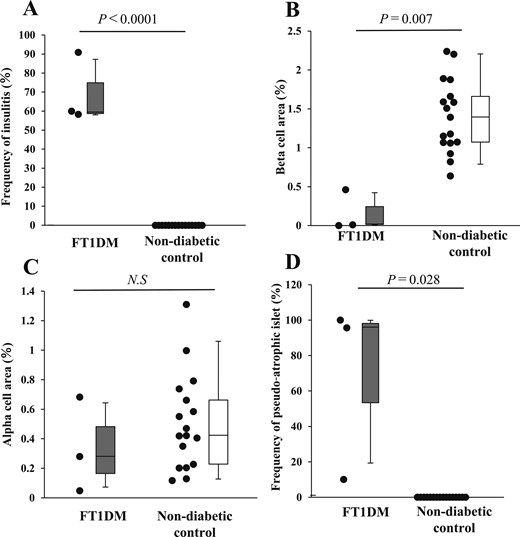
Frequency of insulitis, β and α cell areas, and frequency of pseudoatrophic islets in FT1DM. (A) Frequency of insulitis in FT1DM and nondiabetic control group as shown by box-and-whisker plots. The gray box indicates the upper and lower quartiles of the frequency of insulitis in FT1DM, and the median is indicated by a short black line within the box. The whisker on the box indicates the 95% quartile, and that under the box indicates the 5% quartile. (B) β Cell area per pancreatic section in FT1DM and control groups. (C) α Cell area per pancreatic section in FT1DM and control groups. (D) Frequency of pseudoatrophic islets in FT1DM and control groups. N.S., not significant.
Number of CD+ cell subsets in the islets of FT1DM
In the islets of FT1DM, all subset populations stained for CD45, CD3, CD8, CD68, and CD11c were significantly higher than for the control group (Fig. 2A; Table 2). Infiltrating CD45+ MNCs were observed within and at the periphery of the islets, and also around the pancreatic ducts of FT1DM (Fig. 2B). Regarding CD3+ T cells in serial sections, similar to CD45+ MNCs, they were observed to infiltrate the interior and periphery of the islets of FT1DM and around the pancreatic ducts (Fig. 2C). Similarly, CD8+ T cells were found in the interior and periphery of the islets and exocrine pancreatic tissues (Fig. 2D). Compared with CD4+ T cells, the number of CD8+ T cells was higher, suggesting that the infiltration of CD8+ T cells to the islets is dominant among the T cell subsets in FT1DM. CD68+ macrophages also infiltrated the interior and periphery of the islets in FT1DM as well as the exocrine pancreatic acinar cells (Fig. 2E). Regarding CD11c+ dendritic cells, they were found to characteristically occur more frequently at the periphery of islets in FT1DM (Fig. 2F). Infiltration of CD+ MNCs to islets was rare in the control group (11).
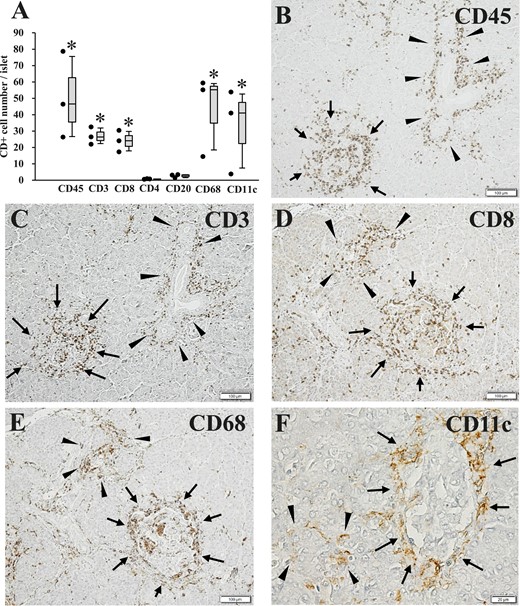
Number of CD+ MNCs in the islets of FT1DM, as well as pathological changes of islets, pancreatic ducts, and exocrine acinar tissues in FT1DM. (A) Number of CD+ cell subsets in the islets of FT1DM. *P < 0.05 for cell numbers in FT1DM compared with the nondiabetic control group. Increased MNC subsets are mainly composed of CD8+ T cells, CD68+ macrophages, and CD11c+ dendritic cells. (B) Extensive CD45 (leukocyte common antigen)+ MNC infiltration in and around the islets (arrows) and pancreatic ducts (arrowheads) in FT1DM. Immunoperoxidase staining. Original magnification, ×100; scale bar, 100 μm. (C) CD3+ T cells infiltrating in and around the islets (arrows) and pancreatic ducts (arrowheads) of FT1DM. Serial section with (B). Immunoperoxidase staining. Original magnification, ×100; scale bar, 100 μm. (D) CD8+ T cells infiltrating in and around the islets (arrows) and exocrine acinar tissue (arrowheads) of FT1DM. Immunoperoxidase staining. Original magnification, ×100; scale bar, 100 μm. (E) CD68+ macrophages infiltrating in and around the islets (arrows) and exocrine acinar tissues (arrowheads) in FT1DM. Serial section with (D). Immunoperoxidase staining. Original magnification, ×100; scale bar, 100 μm. (F) CD11c+ dendritic cells showing characteristic infiltration around the islets (arrows) and partial infiltration around pancreatic acinar tissues (arrowheads) in FT1DM. Immunoperoxidase staining. Original magnification, ×500; scale bar, 20 μm.
Percentage Insulitis, Percentage β and α Cell Area, Percentage Pseudoatrophic Islets, and CD+ Cell Number in and Around the Islets in Case 1, Case 2, and Case 3
| Case 1 (n)a | Case 2 (n)a | Case 3 (n)a | Mean ± SD | |
|---|---|---|---|---|
| Frequency of insulitis, % | 51.7 (29) | 66.7 (15) | 70.0 (20) | 62.8 ± 9.7 |
| β Cell area, % | 0.01 ± 0.009 (8) | 0.5 ± 0.6 (15) | 0 (3) | 0.2 ± 0.3 |
| α Cell area, % | 0.7 ± 0.1 (8) | 0.3 ± 0.4 (15) | 0.05 ± 0.02 (3) | 0.3 ± 0.3 |
| Frequency of pseudoatrophic islets, % | 95.7 (46) | 10 (30) | 100 (22) | 68.6 ± 50.8 |
| VP1+ islet, % | 100 (12) | 100 (10) | 77.0 (13) | 92.3 ± 13.3 |
| CD45+ cell number per islet | 24.4 ± 14.1 (11) | 78.6 ± 45.6 (11) | 46.4 ± 12.4 (12) | 49.8 ± 27.3 |
| CD3+ cell number per islet | 26.3 ± 15.8 (15) | 32.4 ± 16.8 (15) | 21.9 ± 12.4 (15) | 26.9 ± 5.3 |
| CD8+ cell number per islet | 17.2 ± 22.6 (19) | 24.0 ± 20.6 (28) | 30.4 ± 37.0 (11) | 23.9 ± 6.6 |
| CD4+ cell number per islet | 0.7 ± 1.0 (10) | 0.5 ± 0.7 (10) | 0.8 ± 1.2 (12) | 0.7 ± 0.2 |
| CD20+ cell number per islet | 1.4 ± 1.5 (12) | 3.3 ± 5.2 (12) | 3.1 ± 2.6 (13) | 2.6 ± 1.0 |
| CD68+ cell number per islet | 14.4 ± 11.8 (10) | 59.3 ± 22.3 (10) | 55.1 ± 24.6 (10) | 42.9 ± 24.8 |
| CD11c+ cell number per islet | 40.9 ± 28.5 (10) | 53.8 ± 35.3 (11) | 3.8 ± 3.9 (12) | 32.6 ± 26.0 |
Counted islets.
Enterovirus-related VP1 protein and association with insulitis
FT1DM islet cells were positive for VP1, especially the β cells, in which some were densely stained and others were stained faintly (Fig. 3A and 3B). The concordance rates of VP1+ islets and immune cell infiltration in the islets (insulitis), insulitis/VP1, were 50% (6/12), 70% (7/10), and 77% (10/13) in case 1, case 2, and case 3, respectively. Some pancreatic exocrine acinar cell clusters were positive for VP1, with a strong signal (Fig. 3C). Furthermore, pancreatic duct epithelial cells were positive for VP1 (Fig. 3D). The duodenal mucosal cells of case 1 were stained densely positive for VP1 (Fig. 3E), and absorption of the VP1 Ab by VP1 protein was observed at 20 μg/mL (Fig. 3F). In contrast, VP1+ cells were not observed in the control group pancreas.
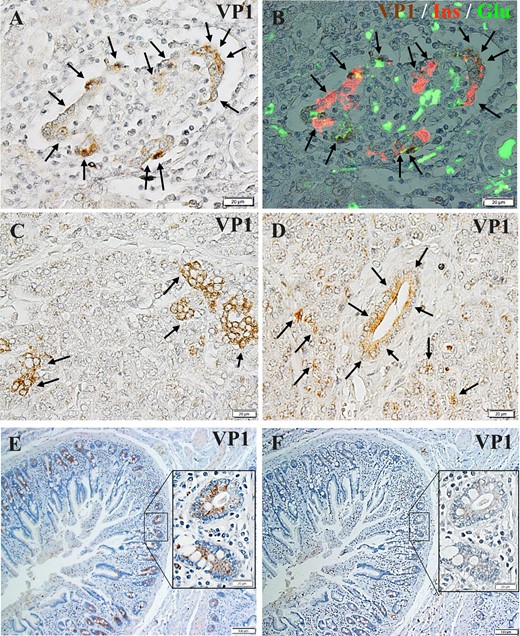
Enterovirus-related protein VP1 expression in islet cells, exocrine acinar cells, and pancreatic ductal cells. (A) Islets of FT1DM were positive for VP1 (arrows). Immunoperoxidase staining. Original magnification, ×500; scale bar, 20 μm. (B) Triple immunostained merged image of islets stained for VP1 (brown), insulin (Ins, red), and glucagon (Glu, green). Original magnification, ×500; scale bar, 20 μm. (C) Pancreatic acinar cells of FT1DM were positive for VP1 (arrows). Immunoperoxidase staining. Original magnification, ×500; scale bar, 20 μm. (D) Pancreatic duct epithelial cells and acinar cells around ducts of FT1DM were positive for VP1 (arrows). Immunoperoxidase staining. Original magnification, ×500; scale bar, 20 μm. (E) VP1 (brown) was stained densely in the duodenal mucosa with FT1DM (case 1). Immunoperoxidase staining. Original magnification, ×500; scale bar, 20 μm. (F) VP1 staining was abolished by absorption of an excessive concentration (20 μg/mL) of VP1 protein. Serial section of (E). Original magnification, ×500; scale bar, 20 μm.
CD+ MNC infiltration to exocrine pancreatic tissues, pancreatic exocrine cell destruction, and VP1 localization in FT1DM
The exocrine acinar tissue was surrounded and infiltrated by MNCs and was focally necrotic in all three cases (Fig. 4A–4C). In case 3, interstitial edema with vascular congestion was remarkable (Fig. 4C). Additionally, amylase staining of acinar cells was weak in some lobes, representing degranulation of amylase granules from damaged acinar cells in all three cases (Fig. 4D). Pancreatic acinar cells were surrounded by CD8+ T cells, CD68+ macrophages, and CD11c+ dendritic cells (Fig. 4E–4G). Immunostaining on serial pancreatic sections of FT1DM showed that VP1+ exocrine ductal and acinar cells were surrounded by CD11c+, CD45+, and CD3+ MNCs (Fig. 4G–4K). VP1 was faintly stained in necrotic and eosinophilic acinar cells and ductal cells, which were surrounded by CD45+ and CD3+ MNCs (Fig. 4I–4K). In contrast, VP1 was densely stained in intact basophilic acinar cells (Fig. 4J and 4L). Amylase expression was not found in necrotic acinar and ductal cells, in which VP1 was faintly stained (Fig. 4J, 4L, and 4M).


Exocrine pancreatic inflammation, amylase expression, and localization of enterovirus VP1 in FT1DM. (A–C) Pancreatic exocrine tissues in case 1 (A), case 2 (B), and case 3 (C) stained by hematoxylin and eosin. Eosinophilic exocrine tissues (*) represent cell necrosis. MNC infiltration shows acute pancreatitis in (A), (B), and (C). Vascular congestion (arrows) and edematous changes (*) of exocrine pancreas were remarkable in case 3 (C). Original magnification, ×200; scale bars, 50 μm. (D) Amylase staining of exocrine pancreas in case 2. Some acinar tissues are surrounded by MNCs, and the tissues show faint or negative amylase staining (arrows). Immunoperoxidase staining. Original magnification, ×100; scale bar, 100 μm. (E) Infiltrating CD8+ T cells (brown) around pancreatic exocrine acinar cells (*) in FT1DM. Immunoperoxidase staining. Original magnification, ×500; scale bar, 20 μm. (F) Infiltrating CD68+ macrophages around pancreatic exocrine acinar cells (*) in FT1DM. Serial section with (E). Immunoperoxidase staining. Original magnification, ×500; scale bar, 20 μm. (G and H) Serial pancreatic sections stained for CD11c (C) and VP1 (D). CD11c+ dendritic cells surrounding the islet (marked by I) and exocrine ductal and acinar cells (*) that were positive for VP1 (arrows). Immunoperoxidase staining. Original magnification, ×500; scale bars, 20 μm. (I–M) Serial sections stained for CD45 (I), VP1 (J), and CD3 (K). (L) Hematoxylin and eosin staining. (M) immunostaining for amylase. VP1+ acinar cell lobe (J, arrows) was surrounded by CD45+ MNCs (I) and CD3+ T cells (K). Note that VP1 was faintly stained (J, arrows) in necrotic acinar and ductal cells (L, arrows), which were surrounded and infiltrated by CD45+ MNCs and CD3+ MNCs. In contrast, VP1 was densely stained in intact basophilic acinar cells (J, arrowheads), which were not surrounded and infiltrated by CD45+ MNCs and CD3+ MNCs. (M) Amylase expression was lost in necrotic acinar and ductal cells (arrows). Original magnification, ×200, scale bars, 50 μm.
The numbers of CD3+ T cells, CD8+ T cells, CD4+ T cells, CD68+ macrophages, and CD11c+ dendritic cells in the exocrine pancreas of FT1DM were significantly higher than those of the nondiabetic control (Fig. 5). These results indicate that advanced immune responses to enteroviral infection and cell damage occurred in acinar and ductal cells of the pancreas in FT1DM.
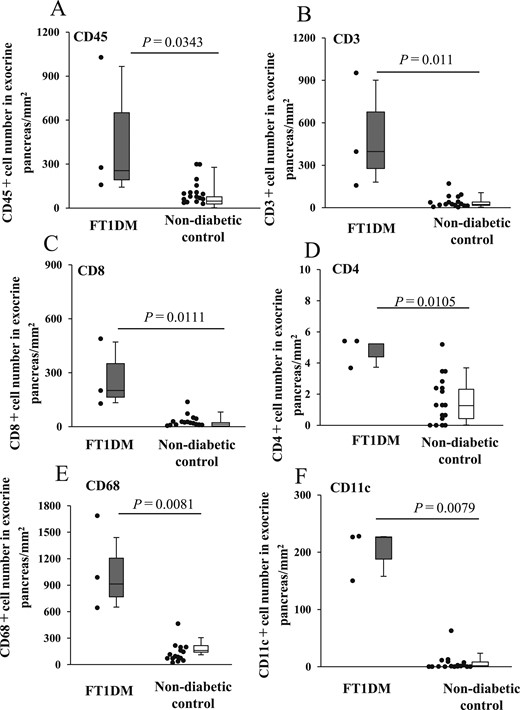
Number of infiltrating MNC subsets to exocrine pancreatic tissues and islets of FT1DM and nondiabetic control. (A) Number of CD45+ MNCs in the exocrine pancreas of FT1DM and control groups. (B) Number of CD3+ T cells in the exocrine pancreas of FT1DM and control groups. (C) Number of CD8+ T cells in the exocrine pancreas of FT1DM and control groups. (D) Number of CD4+ T cells in the exocrine pancreas of FT1DM and control groups. (E) Number of CD68+ macrophages in the exocrine pancreas of FT1DM and control groups. (F) Number of CD11c+ dendritic cells in the exocrine pancreas of FT1DM and control groups.
Association between enterovirus-VP1 and CXCL10 expression and CXCR3+ MNC infiltration in exocrine pancreatic tissues and islets in FT1DM
Immunohistochemical staining of serial sections of FT1DM pancreases demonstrated that CXCL10 was expressed in small ductal cells (Fig. 6A). CXCL10+ small ductal cells were surrounded by activated T cells containing the receptor for CXCL10, named CXCR3 (Fig. 6B). CXCL10+ acinar cells were negative for insulin and glucagon staining and were confirmed not to be α or β cells (Fig. 6C).
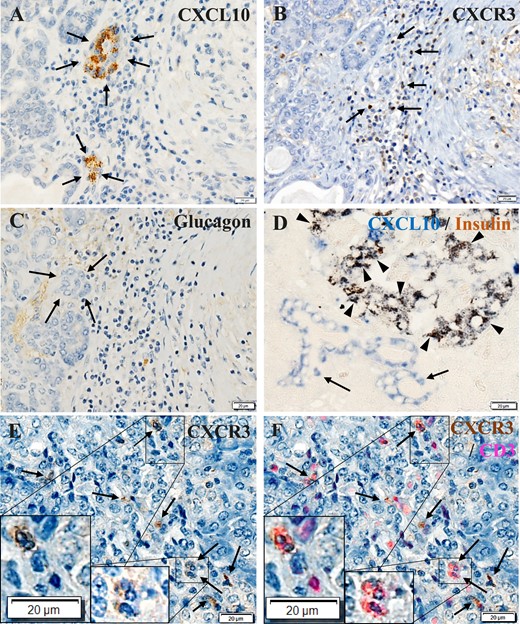
CXCL10 and CXCR3 expression in pancreatic exocrine tissues in FT1DM. (A) CXCL10 (brown) was expressed in small ductal cells (arrows). Immunoperoxidase staining. Original magnification, ×500; scale bar, 20 μm. (B) CXCR3+ (brown) cells located around the CXCL10+ exocrine cells (arrows). Serial section with (A). Immunoperoxidase staining. Original magnification, ×500; scale bar, 20 μm. (C) The serial section was negative for glucagon staining, confirming that CXCL10+ cells are not endocrine cells (arrows). Immunoperoxidase staining. Original magnification, ×500; scale bar, 20 μm. (D) Double immunostained merged image of islets and pancreatic ductal cells stained for CXCL10 (blue) and insulin (brown) in FT1DM. Most β cells were positive for CXCL10 (arrowheads), and some pancreatic ductal cells were positive for CXCL10 (blue, arrows). Immunoperoxidase staining. Original magnification, ×500; scale bar, 20 μm. (E) Immunostaining of FT1DM pancreas for CXCR3 (brown). Some CXCR3+ MNCs infiltrated the islets and exocrine cells (arrows). Immunoperoxidase staining. Original magnification, ×500; scale bar, 20 μm. (F) Merged image of CXCR3 (E) stained by immunoperoxidase staining (brown) and CD3 (red) staining by an immunofluorescence method. A high proportion of CD3+ T cells infiltrating the islets were positive for CXCR3 (arrows). Insets show a magnified view. Original magnification, ×500; scale bar, 20 μm.
CXCL10 was highly expressed in islet β cells as well as in exocrine ductal cells (Fig. 6D), and CXCR3+CD3+ MNCs infiltrated the islets (Fig. 6E and 6F). The association between VP1+ islets and CXCL10+ islets represented by the concordance rate, CXCL10/VP1, were 95% (11/12), 100% (10/10) and 91% (11/13) in case 1, case 2, and case 3, respectively. To identify an association between enterovirus VP1 and inflammation and CXCL10/CXCR3 expression in exocrine pancreas and islets of FT1DM, we stained serial pancreatic sections for VP1, CD68, CD8, CXCL10, insulin, and CXCR3. The topographic sites of VP1, inflammation, and CXCL10/CXCR3 expression were also concordant, as a close association became apparent between VP1+ exocrine acinar cells, islets, and CD68+ MNCs, CD8+ MNC infiltration, cytoplasmic CXCL10 expression, and CXCR3+ MNC infiltration (Fig. 7, magnified view) (11).

Correlation between the presence of enterovirus VP1 and inflammatory cell infiltration to acinar cells/islets and CXCL10/CXCR3 expression in the FT1DM pancreas. (A–F) Serial sections. Original magnification, ×100; scale bars, 50 μm (20 μm in each inset). See the magnified and detailed images of insets in an online repository (11). (A) VP1 in the FT1DM pancreas. Inset 1 shows VP1 in exocrine acinar tissues (brown, arrows). Inset 2 shows VP1 in islets (brown, arrows). (B) CD68+ macrophages (brown) infiltrate to the exocrine pancreatic tissues (inset 1, arrows) and islets (inset 2, arrows). (C) CD8+ T cells (brown) infiltrate to the exocrine pancreatic tissues (inset 1, arrows) and islets (inset 2, arrows). (D) A few β cells were densely stained for insulin (brown) in FT1DM islets (inset 2, arrows). Some β cells are stained faintly. (E) CXCL10 (brown) in exocrine pancreatic tissues (inset 1, arrows) surrounded by MNCs are stained faintly, and islets cells (inset 2, arrows) are densely stained for CXCL10. Remaining islet cells are faintly stained for CXCL10. (F) CXCR3+ MNCs (brown) infiltrate around the exocrine pancreatic tissues (inset 1, arrows) and islets (inset 2, arrows).
Discussion
Few reports are available that focus on pathological changes of the exocrine pancreas in FT1DM. Additionally, there were no reports on the quantitative analysis of inflammatory changes in pancreatic islets and exocrine tissues in FT1DM (6, 8). The following findings were obtained in this study.
First, there was a close association between enterovirus VP1 and CXCL10 expression in pancreatic exocrine ductal cells and acinar cells as well as islet cells in FT1DM pancreas. It is possible to conclude from the current study that enterovirus infection induced CXCL10 expression in exocrine pancreas as well as in islets. CXCL10 attracts CXCR3+ T cell infiltration to the exocrine pancreas and induces acute pancreatitis with elevated serum levels of pancreatic digestive enzymes, including amylase and elastase I. Additionally, enterovirus tropism to acinar cells and host-dependent chemokine/cytokine and inflammatory responses to enterovirus infection will determine the phenotype of pancreatic pathology (18, 19). Pathological findings in this study, including acinar cell necrosis, amylase degranulation, and edematous congestion in our cases (Fig. 4A–4D), were consistent with clinical elevation of serum levels of pancreatic-specific enzymes (2), pancreatic swelling, and pancreatic exocrine tissue injury in FT1DM at onset (3). Exocrine pancreatic inflammation in acute-onset type 1 diabetes was also reported (20).
Second, the predominant CD phenotypes of MNCs in endocrine pancreatic islets were CD11c+ dendritic cells, CD68+ macrophages, and CD8+ T cells in FT1DM (Fig. 2). The phenotypes of MNCs were the same in the inflamed exocrine and endocrine pancreas in FT1DM. This suggests that inflammation occurred in the exocrine as well as the endocrine pancreas through common mechanisms (6, 8).
Third, VP1, which is indicative of enterovirus infection (21, 22), was positive in the islets, exocrine acinar/ductal cells, and in duodenal mucosal cells of FT1DM. The presence of enterovirus-positive duodenal mucosal cells, pancreatic duct epithelial cells (23), acinar cells, and islet cells in FT1DM may suggest that the enterovirus infection can extend from the main focus of duodenal mucosa to the pancreatic ductal cells, acinar cells, and islets through blood vessels, the lymphatic system, and/or the pancreatic ductal system. The presence of enterovirus VP1 in gut mucosa was reported in acute-onset type 1 diabetes (24). It was also suggested that the VP1 staining pattern of the pancreatic tissues was dependent on host cell viability and was affected by enterovirus/inflammation in FT1DM. More detailed studies on the pancreatic and intestinal pathology of various kinds of fetal acute virus infection (25) in children and adults are needed.
Based on the results of this study, we propose the following mechanism of FT1DM. Enterovirus infection of pancreatic exocrine pancreas and islets will be followed by activation of innate immune mechanisms involving type I IFN and inflammatory cytokines (8). This inflammatory condition will lead to hyperexpression of MHC class I and activation of the CXCL10–CXCR3 axis, leading to adaptive immune-mediated mechanisms with subsequent destruction of the endocrine and exocrine pancreas (6, 26).
Therefore, suppression of the CXCL1–CXCR3 axis is one of the main therapeutic targets of FT1DM. In fact, diabetes in NOD mice was reversed by neutralizing treatment of CXCL10 (27). However, as a different mechanism of β cell destruction from the CXCL10–CXCR3 axis, Coppieters et al. (28) reported that neither CXCL10 nor CXCR3 was required for full antiviral responsiveness and viral clearance in the lymphocytic choriomeningitis virus system. Inflammation due to enterovirus infection of the pancreatic exocrine acinar cells suggests the production of autoantibodies against the exocrine pancreas. We reported amylase α-2A autoantibodies in the serum of patients with autoimmune pancreatitis and patients with FT1DM (7). Although the timing of enterovirus infection prior to the clinical onset of FT1DM is unclear, it may be clinically useful to evaluate the presence or absence of amylase α-2A autoantibodies in the relatives of patients as a potentially predictive marker for FT1DM development.
A limitation of this study is the small number of patients with FT1DM. The observations found in this study will be further bolstered by increasing the number of patients longitudinally studied. FT1DM-like cases occurring during anti–PD-1 therapy have been reported (29). Further studies on the pancreas and PD-1 and the PD-ligand 1 axis, which is another potential mechanism of FT1DM, are warranted.
Acknowledgments
The thank the late Taro Maruyama, Saitama Social Insurance Hospital, for generous assistance in obtaining the study samples, Harumi Masuda for excellent technical assistance with immunostaining of samples, and Fumie Takano, Okinaka Memorial Institute for Medical Research, for excellent secretarial work.
Financial Support: This work was supported by Japan Society for the Promotion of Science KAKENHI Grant 2459319.
Author Contributions: M.T., E.J., and T. F. conducted the immunohistochemical staining and discussed, reviewed, and edited the manuscript. K.A. contributed to the analysis of the immunostained sample data and discussions. S.Y. contributed to the planning and discussions and edited the manuscript. T.F., A.S., and Y.O. sampled autopsied pancreases and participated in discussions. J.M. and T.B. contributed to the analysis of the data, discussions, and reviewed the manuscript. T.K. planned the study, sampled autopsied pancreases, analyzed data, and wrote and edited the manuscript. All authors approved the final version for publication. T.K. is the guarantor of this work and takes responsibility for the integrity of the data and the accuracy of the data analysis.
Disclosure Summary: The authors have nothing to disclose.
Abbreviations:
- Ab
antibody
- CXCL10
CXC chemokine ligand 10
- CXCR3
CXC chemokine receptor 3
- FT1DM
fulminant type 1 diabetes mellitus
- GAD
glutamic acid decarboxylase
- ICA
islet cell Ab
- MNC
mononuclear cell
- PD-1
programmed cell death 1
- VP1
enterovirus capsid protein 1
