


Abstract
Offspring of women with gestational diabetes (O-GDM) or type 1 diabetes mellitus (O-T1DM) have been exposed to hyperglycemia in utero and have an increased risk of developing metabolic disease in adulthood.
In total, we recruited 206 adult offspring comprising the two fetal hyperglycemic groups, O-GDM and O-T1DM, and, as a control group, offspring from the background population (O-BP). Subcutaneous fat biopsies were obtained and preadipocyte cell cultures were established from adult male O-GDM (n = 18, age 30.1 ± 2.5 years), O-T1DM (n = 18, age 31.6 ± 2.2 years), and O-BP (n = 16; age, 31.5 ± 2.7 years) and cultured in vitro.
First, we studied in vivo adipocyte histology. Second, we studied in vitro preadipocyte leptin secretion, gene expression, and LEP DNA methylation. This was studied in combination with in vitro preadipocyte lipogenesis, lipolysis, and mitochondrial respiration.
We show that subcutaneous adipocytes from O-GDM are enlarged compared with O-BP adipocytes. Preadipocytes isolated from male O-GDM and O-T1DM and cultured in vitro displayed decreased LEP promoter methylation, increased leptin gene expression, and elevated leptin secretion throughout differentiation, compared with adipocytes established from male O-BP. In addition, the preadipocytes demonstrated functional defects including decreased maximal mitochondrial capacity with increased lipolysis and decreased ability to store fatty acids when challenged with 3 days of extra fatty acid supply.
Taken together, these findings show that intrinsic epigenetic and functional changes exist in preadipocyte cultures from individuals exposed to fetal hyperglycemia who are at increased risk of developing metabolic disease.
A suboptimal prenatal environment is increasingly being recognized as a risk factor for metabolic diseases in adult life (1–3). Both gestational diabetes mellitus (GDM) and type 1 diabetes (T1DM) during pregnancy is characterized by maternal hyperglycemia, resulting in an increased placental transport of glucose from the mother to the fetus, often resulting in fetal macrosomia and increased risk of developing metabolic disorders including overweight, insulin resistance, and type 2 diabetes (T2D) in the offspring (4–7). The mechanisms underlying the association between fetal exposure to maternal hyperglycemia and increased disease risk in adult life are unknown, but epigenetic mechanisms permanently changing cellular functions in diabetes target tissues, including adipose tissue, are thought to play a key role (8). In a recent study, we found that preadipocytes isolated from individuals born with low birth weight displayed decreased leptin secretion and gene expression; these were interestingly accompanied with decreased LEP DNA methylation (9, 10). DNA methylation can be sensitive to environmental stimuli (11, 12), but may also be stable over time and even passed on to the next generation (13, 14). DNA methylation is generally associated with repression of gene transcription because high methylation (usually in the promoter region of the gene) leads to low expression of the encoded messenger RNA (mRNA) (15).
One of the most important functions of adipocytes is to store fat. Adipocyte fat accumulation is determined by the balance between fat synthesis (lipogenesis) and fat breakdown (lipolysis/fatty acid oxidation). Alterations in lipolysis are frequently associated with obesity, and increased rates of lipolysis may contribute to the development of insulin resistance (16, 17). Adipocyte lipolysis is controlled through integration of multiple hormonal and biochemical signals (18). Appropriate expandability of adipose tissue is necessary for preventing ectopic deposition of lipids and their metabolites in other tissues such as muscle, liver, and pancreas, with consequent development of insulin resistance (19, 20). Adipose tissue expandability can occur by two mechanisms: adipocyte hypertrophy, a mechanism by which each adipocyte increases in size to contain a larger lipid droplet, and adipocyte hyperplasia, a mechanism by which more adipocytes are recruited and differentiated from precursor cells within the adipose tissue compartment. In addition to their primary function of energy storage and release, adipocytes secrete a variety of adipokines involved in energy homeostasis, feeding, behavior, insulin sensitivity, and inflammation. Leptin plays a major role in whole-body metabolism and is widely recognized for its role in appetite regulation (21).
In this study, we investigate the impact of exposure to fetal hyperglycemia on preadipocyte function in adult life. By comparing isolated preadipocytes from adult offspring representing the background population (O-BP) with low genetic predisposition to T2D and no exposure to fetal hyperglycemia, with offspring of women with GDM (O-GDM) presenting both a genetic predisposition to T2D (22) and exposure to fetal hyperglycemia, and with offspring of women with T1DM (O-T1DM) only being exposed to fetal hyperglycemia and having a low genetic predisposition to T2D, we are able to evaluate the role of maternal hyperglycemia alone or in combination with genetic predisposition on the function of preadipocytes.
Subjects and Methods
Study participants and establishing cell culture
Two groups exposed to maternal diabetes in utero were included: offspring of women with gestational diabetes (O-GDM; age, 30.1 ± 2.5 years) and offspring of women with type 1 diabetes mellitus (O-T1DM; age, 31.6 ± 2.2 years). O-BP served as a control group (age, 31.5 ± 2.7 years). Abdominal subcutaneous adipose tissue biopsies were obtained using a Bergström biopsy needle with suction (23) after an overnight fast, fasting venous blood sampling, a 2-hour 75-g oral glucose tolerance test (OGTT), anthropometric measurements, and a dual x-ray absorptiometry scan were performed on all subjects from the human cohort [Fig. 1(a)]. The study was approved by the regional ethical committee and all procedures were performed according to the Declaration of Helsinki. To avoid sex difference, only preadipocyte cell cultures from males were included in the cell study (24, 25). Because of a limitation of cell cultures (n = 20) in the O-BP group, it was decided to aim for 20 cell cultures in each of the three groups (see Supplemental Material for isolation of adipose precursor cells and culturing). Upon differentiation, eight cultures did not display adipocyte morphology and were consequently excluded; therefore, the final cell study was completed with preadipocytes from 18 O-BP, 18 O-GDM, and 16 O-T1DM [Fig. 1(c)]. To determine the purity of the isolated preadipocyte cell cultures, they were characterized by fluorescence-activated cell sorting (Supplemental Material). Data from the human cohort, including both females and males, are presented in the first follow-up by Clausen et al. (6) and in the second follow-up by Kelstrup et al. (26).
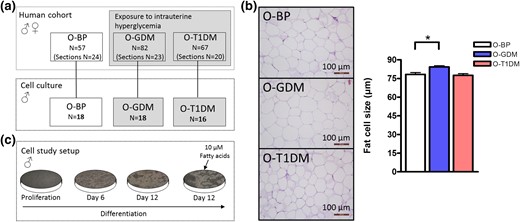
Flowchart and in vivo adipocyte size. (a) Overview of the individuals included in the entire human cohort study (on top) and individuals only included in the cell studies (bottom). Twenty cultures were grown from each group, but a few cultures did not show adipogenic potential and were consequently excluded, thereby ending up with cell cultures from O-BP (n = 18), O-GDM (n = 18), and O-T1DM (n = 16). (b) Adipose tissue slides were stained with hematoxylin and eosin to assess adipocyte morphology and size. For each subject, the size (micrometer) of 100 adipocytes from each section was determined (magnification ×100). Histology was performed in male and female O-BP (n = 24), O-GDM (n = 23), and O-T1DM (n = 20). (c) Cell study setup. The cells were harvested during proliferation, day 6, day 12, and day 12 with addition of 10 μM fatty acids. Data are shown as mean ± standard error of the mean. *P < 0.05 (t test).
Adipocyte histology
To determine mature adipocyte cell size in the adipose tissue, part of the subcutaneous adipose biopsy was immediately fixed in paraformaldehyde and later embedded in paraffin. Subsequently, paraffin slides were stained with hematoxylin and eosin to assess the morphology under a light microscope. For each subject, the size (micrometer) of 100 adipocytes from each section was determined under the microscope (magnification ×100), using Leica QWin Pro software. All slides were blind-analyzed to avoid bias. Adipose biopsies slides were analyzed on a subgroup (O-BP, n = 24; O-GDM, n = 23; and O-T1DM, n = 20) from the human cohort when the size of the biopsy allowed preparation of high-quality histology sections.
Preadipocyte adipokine secretion
Adipokine secretion into the media was evaluated using the Meso Scale Discovery platform (Meso Scale Diagnostics, Rockville, MD) (Supplemental Material).
Fatty acids supply and Oil Red O assay
To investigate the effect of increased levels of fatty acids on adipocyte metabolism and lipid accumulation, the cultured cells were stimulated with 10 μM fatty acids the last 3 days of the differentiation protocol. The fatty acids were a mix of oleic acid, linoleic acid, and palmitic acid (2:1:1 ratio) conjugated to human serum albumin (albumin:fatty acids, 1:3 ratio) in differentiation medium without rosiglitazone. Fatty acids and medium was replaced every 24 hours throughout the last 3 days of differentiation. At day 12, an Oil Red O assay was performed to quantify lipid accumulation and a glycerol assay kit was performed to analyze lipolysis (Supplemental Material).
RNA isolation and reverse transcription polymerase chain reaction analysis
Total RNA was extracted from the adipocytes using TRIzol reagent (Invitrogen, Taastrup, Denmark) and analyzed by quantitative real-time polymerase chain reaction (PCR) (Supplemental Material).
Protein determination and Western blot
Protein was harvested from fully mature adipocytes at day 12 (Supplemental Material). The following antibodies were used: adipose triglyceride lipase (ATGL; #ab99532), hormone-sensitive lipase (HSL; #ab17652), and fatty acid binding protein 4 (FABP4; #ab92501) all from Abcam (Cambridge, UK), and β-actin (#4967) from Cell Signaling (Danvers, MA).
DNA isolation and DNA methylation
Genomic DNA was extracted and bisulfite converted. A primer assay was designed to cover CpG sites of interest in the LEP promoter. PCR and pyrosequencing of the PCR product were performed and quantified (Supplemental Material).
XFe96 extracellular flux analyzer
To evaluate mitochondrial respiration, preadipocytes were plated and differentiated on an XF96-well microplate. Oxygen consumption rate was measured according to the manufacturer’s protocols. Assay medium was prepared using XF Base Medium supplemented with 1 mM pyruvate, 2 mM glutamine, and 10 mM glucose, and pH was adjusted to 7.4 with 0.5 M NaOH. Oligomycin (2 µM), carbonyl cyanide p-trifluoromethoxyphenylhydrazone (FCCP; 0.75 µM), and antimycin A/rotenone (0.75 µM) were sequentially added to the cells as modulators of the electron transport chain in the mitochondria. The XF96-well microplates were analyzed using the Seahorse Bioscience XFe96 Extracellular Flux Analyzer.
Statistical analysis
Statistical analyses were performed using SAS software, version 9.1.3 (SAS Institute Inc.). Only differences between the control group and the two hyperglycemic groups (O-BP vs O-GDM and O-BP vs O-T1DM) were analyzed. Data lacking a normal distribution were logarithmically transformed before analysis. Nontransformed data are used in the graphs. To evaluate the effect of group and time/fat, a two-way analysis of variance (ANOVA) for repeated measures was performed. If an interaction was found to be statistically significant, it was included in the figure. The residuals obtained from the ANOVA models were evaluated and the model was accepted only if the residuals were normally distributed. An unpaired Student t test was applied when difference between O-BP and one of the hyperglycemic exposure groups (O-GDM or O-T1DM) was investigated. Tables are means ± standard deviation and figures are means ± standard error of the mean (SEM). P < 0.05 was considered statistically significant.
Results
Flowchart and clinical characteristics of the study population
The physiological characteristics of the participants included in the human cohort are described by Kelstrup et al. (26). This cohort included both male and female offspring. The number of participants in each group is shown in the upper panel of Fig. 1(a). The number of available tissue sections is shown in the parentheses below the total number of participants in the cohort [Fig. 1(a)]. Adipocytes from O-GDM showed a larger cell size compared with O-BP adipocytes (P = 0.0022). No difference was observed for O-T1DM [Fig. 1(b)].
The clinical characteristics of the male preadipocyte donors are shown in Table 1. We found no difference in adult age, height, body mass index (BMI), fat mass (percent), fat mass (kilograms), lean body mass (percent), and waist/hip ratio among the three groups. Furthermore, we observed no difference between groups when analyzing fasting plasma levels of hemoglobin A1C, insulin, glucose, low-density lipoprotein, triglycerides, or cholesterol. However, O-GDM had significantly lower body weight and decreased lean body mass (kilograms) compared with O-BP, whereas O-T1DM had higher fasting plasma high-density lipoprotein levels compared with O-BP. Participants from the O-GDM group showed borderline increased plasma glucose levels 30 minutes after exposure to a 2-hour OGTT compared with O-BP (P = 0.053). No group difference in plasma glucose levels was found 120 minutes after the glucose load (Supplemental Fig. 1).
Clinical Characteristics of Adult Offspring
| O-BP (n = 18) | O-GDM (n = 18) | O-T1DM (n = 16) | |
|---|---|---|---|
| Age, y | 31.5 ± 2.7 | 30.1 ± 2.5 | 31.6 ± 2.2 |
| Weight, kg | 87.0 ± 11.1 | 78.0 ± 9.7a | 82.2 ± 15.6 |
| Height, cm | 1.84 ± 0.05 | 1.80 ± 0.07 | 1.82 ± 0.11 |
| BMI, kg/m2 | 25.7 ± 2.8 | 24.1 ± 3.3 | 24.5 ± 2.9 |
| Fat mass, % | 25.4 ± 6.0 | 23.8 ± 5.2 | 24.0 ± 6.7 |
| Fat mass, kg | 24.4 ± 5.9 | 22.8 ± 5.1 | 23.0 ± 6.5 |
| Lean body mass, % | 71.7 ± 5.6 | 73.2 ± 4.8 | 73.0 ± 6.2 |
| Lean body mass, kg | 62.0 ± 5.8 | 56.9 ± 6.1a | 59.3 ± 9.2 |
| Waist/hip ratio | 0.87 ± 0.04 | 0.87 ± 0.05 | 0.85 ± 0.04 |
| Fasting plasma HbA1C, mmol/mol | 34.0 ± 2.7 | 34.2 ± 2.5 | 35.3 ± 2.2 |
| Fasting plasma insulin, pmol/L | 55.7 ± 24.7 | 51.6 ± 26.6 | 51.3 ± 27.3 |
| Fasting plasma glucose, mmol/L | 5.01 ± 0.27 | 4.83 ± 0.39 | 5.07 ± 0.36 |
| Fasting plasma LDL, mmol/L | 2.77 ± 0.66 | 2.66 ± 0.72 | 3.03 ± 0.80 |
| Fasting plasma HDL, mmol/L | 1.15 ± 0.31 | 1.22 ± 0.22 | 1.44 ± 0.32a |
| Fasting plasma triglycerides, mmol/L | 1.23 ± 0.69 | 1.00 ± 0.38 | 0.93 ± 0.35 |
| Fasting plasma cholesterol, mmol/L | 4.55 ± 0.78 | 4.45 ± 0.79 | 5.01 ± 0.80 |
Data are shown as mean ± standard deviation.
Abbreviations: HbA1C, hemoglobin A1C; HDL, high-density lipoprotein; LDL, low-density lipoprotein.
P < 0.05 with Student t test between O-BP vs O-GDM and O-BP vs O-T1DM.
Similar cell composition and differentiation status in the cultured preadipocytes
A fraction of the isolated cells was used to determine adipogenic purity. By flow cytometry analysis, we confirmed that all included preadipocyte cell cultures were negative for CD45 (a hematopoietic cell-surface marker) and CD31 (an endothelial cell-surface marker). All three groups were close to 100% positive for the adipogenic markers CD90 and CD166, with no difference between groups—O-BP 98.8% ± 1.4%, O-GDM 96.9% ± 7.0% (P = 0.3000), and O-T1DM 98.0% ± 2.6% (P = 0.2851) [Supplemental Fig. 2(A–D)]—thereby documenting nearly pure adipogenic cell cultures. To study differentiation status of the cells, mRNA levels of selected adipocyte transcription factors and adipogenic markers were measured. No difference in the early differentiation marker, C/EBPδ, and late differentiation markers, PPARγ and GLUT4, was found between O-BP and the two hyperglycemic groups O-GDM and O-T1DM [Supplemental Fig. 2(E–J)], thus assuring equal preadipocyte differentiation degree among the three groups.
Altered gene expression, secretion, and methylation of leptin in O-GDM and O-T1DM
To investigate the endocrine function of the adipocytes, we analyzed leptin secretion throughout preadipocyte differentiation. Leptin has a large impact on glucose regulation in adult life, suggesting that its regulation could be altered because of dysregulated glucose regulation in fetal life. Both leptin secretion [Fig. 2(a)] and leptin gene expression [Fig. 2(b)] were markedly increased in O-GDM and O-T1DM at the investigated time points, compared with O-BP. This led us to investigate the methylation status of central CpG sites in the LEP promoter. We analyzed methylation of seven CpG sites in the LEP promoter [Fig. 2(c)]. The average methylation of these CpG sites was significantly decreased in both O-GDM and O-T1DM throughout differentiation [Fig. 2(d)]. In addition, we found a significant and positive correlation (P = 0.0087) between intracellular lipid accumulation and leptin secretion in the mature adipocytes [Fig. 2(e)]. Because impaired leptin regulation could be central to the altered phenotype of adipocytes from O-GDM and O-T1DM, we decided to examine the correlation between leptin secretion and basal glycerol release at day 12. We found a significant positive correlation (P = 0.0097) [Fig. 2(f)].
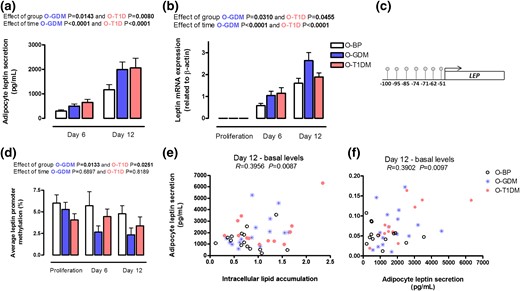
Leptin regulation. Preadipocytes from O-BP (n = 18), O-GDM (n = 18), and O-T1DM (n = 16) were cultured until maturity on day 12. Cells were harvested during proliferation, at day 6, and at day 12. (a) Adipocyte leptin secretion into the cell media. (b) Leptin mRNA expression. (c) Investigated CpG sites in the LEP promoter. (d) Average DNA methylation of the investigated CpG sites. (e) Relationship between basal intracellular lipid accumulation and adipocyte leptin secretion at day 12. (f) Relationship between adipocyte leptin secretion and glycerol release into the cell media. Data are shown as mean ± SEM. The time and group effect was analyzed by repeated ANOVA.
Average CpG methylation of the LEP promoter was correlated to leptin gene expression at different time points throughout differentiation in the three groups; no major tendency of the correlations was found (Supplemental Table 2).
We subsequently investigated the secretion of two proinflammatory cytokines, interleukin-6 and tumor necrosis factor-α. We found no differences between the groups for interleukin-6 secretion throughout differentiation [Supplemental Fig. 3(A)]. However, O-T1DM adipocytes secreted more tumor necrosis factor-α throughout differentiation compared with O-BP [Supplemental Fig. 3(B)].
Deficient lipogenesis in O-GDM and O-TIDM after fatty acid overfeeding
We further investigated the ability of the differentiated adipocytes to accumulate fat by an Oil Red O assay [Fig. 3(a)]. At basal levels, we found that adipocytes from the O-T1DM group had a tendency toward increased (P = 0.0788) fat accumulation compared with the O-BP group (t test O-T1DM vs O-BP). To challenge the cells, we supplemented them with 10 µM fatty acids for the last three days of the differentiation protocol [Fig. 1(b)]. After fatty acid supply, only O-BP adipocytes accumulated significantly more fat (51.7%) compared with basal levels (t test, P < 0.05), whereas O-GDM increased lipid accumulation with 42.3% and O-T1DM with 16.9%, suggesting that adipocytes of those from the O-T1DM group tend to take up more fat in the basal state, but have a slightly lower ability to take up lipids in the overfeed state [Fig. 3(b)]. The gene expression and protein level of FABP4, which mediates fatty acid transportation in the adipocyte, was not different between groups [Fig. 3(c–e)].
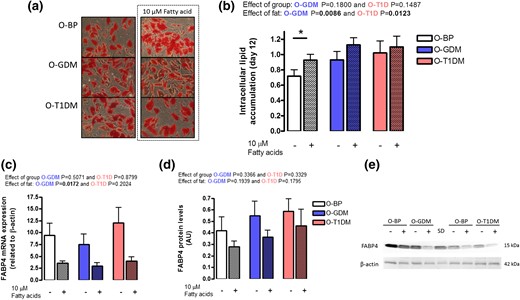
Adipocyte lipid accumulation. Preadipocytes from O-BP (n = 18), O-GDM (n = 18), and O-T1DM (n = 16) were cultured until maturity on day 12; in the final 3 days of differentiation, the cultured adipocytes were supplied with either vehicle or 10 µM fatty acids. (a) Pictures of intracellular lipid content by Oil Red O staining. (b) Estimation of intracellular lipid content. (c) FABP4 mRNA expression. (d) FABP4 protein levels. (e) Representative Western blot of FABP and β-actin. Hatched bars indicate 10 μM fatty acid supply. Data are shown as mean ± SEM. The fat and group effect was analyzed by repeated ANOVA. *P < 0.05 (t test).
Increased lipolysis after fatty acid over supply in O-T1DM
To investigate the cells’ ability to break down fat, we again challenged the cells by supplementing them with 10 µM fatty acids for the last 3 days of the differentiation protocol. We analyzed lipolysis in the mature adipocytes (day 12) by measuring glycerol release to the cell media. Glycerol release was overall significantly increased in adipocytes from O-T1DM compared with O-BP [Fig. 4(a)]. Investigating basal glycerol release and fatty acid supplement, respectively, we found no difference in lipolysis between groups at day 12 without fatty acid supplement; however, when fatty acids were added to the adipocytes for 3 days both O-GDM (P = 0.0363) and O-T1DM (P = 0.0009) had markedly higher lipolysis compared with O-BP adipocytes [Fig. 5(a)]. We next measured gene expression and protein levels of selected rate limiting proteins in adipocyte lipolysis; ATGL and HSL, which are synthesized in adipocytes and involved in releasing fatty acids from the glycerol backbone of triglyceride molecules [Fig. 4(b)]. ATGL gene expression [Supplemental Fig. 4(A)] did not differ between groups; however, ATGL protein expression was borderline increased (P = 0.0510) in O-T1DM adipocytes [Figure 5(c) and 5(e)], suggesting that an increased ATGL protein level could contribute to the increased lipolysis in O-T1DM cells upon stimulation with fatty acids. HSL gene expression [Supplemental Fig. 4(B)], and protein levels were not significantly different between groups and not affected by fatty acid overfeeding [Fig. 5(d) and 5(e)].
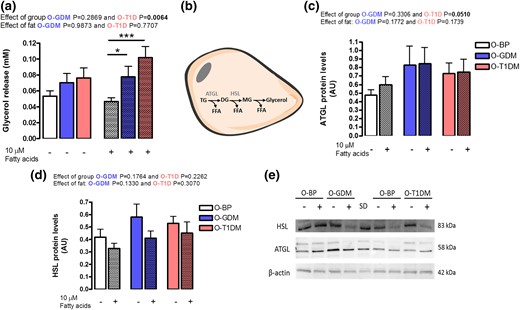
Adipocyte lipolysis. Preadipocytes were established from O-BP (n = 18), O-GDM (n = 18), and O-T1DM (n = 16) and cultured until maturity. Media, RNA, and protein were harvested at day 12 with and without 3 days of 10 µM fatty acid supply. (a) Lipolysis estimated by glycerol release into the cell media. (b) Overview of regulation of lipolysis. (c) ATGL protein levels. (d) HSL protein levels. (e) Western blot of HSL, ATGL, and β-actin. Hatched bars indicate 10 μM fatty acid supply. Data are shown as mean ± SEM. The time and fat effect was analyzed by repeated ANOVA. *P < 0.05, ***P < 0.001 (t test). DG, diglycerides; FFA, free fatty acids; MG, monoglycerides; TG, triglycerides.

Mitochondrial respiration. A subgroup of preadipocytes O-BP (n = 11), O-GDM (n = 9), and O-T1DM (n = 10) were cultured in a seahorse plate until day 12 and oxygen consumption rate (OCR) was measured. (a) Basal respiration was first inhibited with oligomycin (O, inhibitor of oxidative phosphorylation), followed by treatment with FCCP (F, uncoupler of mitochondrial oxidative phosphorylation) and then antimycin A (A)/rotenone (R, inhibitor of mitochondrial respiratory chain). (b) Relative OCR given in percentage. Data are shown as mean ± SEM. *P < 0.05 (t test).
Decreased maximum mitochondrial respiration in O-GDM
To investigate changes in one of the major energy producing pathways, we measured oxygen consumption rate, an indicator of mitochondrial respiration, using Seahorse XF96 extracellular flux analyzer. This was performed in a subgroup of cells: 11 O-BP, 9 O-GDM, and 10 O-T1DM. No difference was observed for oxygen consumption rate (picomole per minute) at basal respiration [Fig. 5(a)]. In addition, oxygen consumption rate (percent) was calculated in relation to basal respiration just before the first agent injection [Fig. 5(b)]. We found a significantly decreased response to FCCP, an electron transport chain uncoupling agent, in the O-GDM group compared with the O-BP response [Fig. 5(b)], suggesting a decrease in the maximal capacity of the mitochondria upon stimulation.
Discussion
In this study, we demonstrated that preadipocytes isolated from two adult human groups exposed to hyperglycemia in utero, O-GDM and O-T1DM, displayed decreased LEP promoter methylation, increased leptin gene expression, and elevated leptin secretion throughout differentiation. Moreover, the adipocytes from O-GDM and O-T1DM also displayed decreased expandability potential and dysregulated lipid turnover when challenged with 3 days of extra fatty acid supply. These data suggest that a hyperglycemic fetal environment may influence key metabolic functions of preadipocytes, which may link O-GDM and O-T1DM to the increased offspring risk of developing adult disease. This was apparently independent of the increased genetic risk factor in the O-GDM group, emphasizing that it is the hyperglycemic environment that underlies the alterations found in this study. Moreover, this study shows that intrinsic epigenetic and functional changes exist in fat cell cultures from young individuals who are at increased risk of developing metabolic disease, but who are still healthy, suggesting that detrimental changes in the preadipocytes preclude the development of metabolic diseases.
Leptin is a well-known adipokine and an obvious candidate for metabolic disorders because it is secreted by adipose tissue and is involved in energy metabolism and insulin sensitivity (27). Interestingly, we found that both leptin secretion and gene expression were significantly increased in O-GDM and O-T1DM. Epigenetic mechanisms have been proposed as a possible explanation for the link between exposure to an adverse fetal environment and development of adult disease. We found that average LEP promoter methylation was significantly downregulated in O-GDM and O-T1DM, which could contribute to the observed increased leptin gene expression and secretion. In fetal life, increased glucose flow to the fetus might program the adipocytes to have an intrinsic upregulation of leptin, suggesting that the adipocytes have an “epigenetic memory” of the fetal life. According to the Pedersen hypothesis, the increased glucose flow to the fetus, leading to fetal hyperinsulinemia, could also possibly modify the growth and development of the fetus and its cells (28). It is likely that a combined effect of changes in the fetal insulin levels, placental glucose delivery, and other factors associated to gestational GDM and T1DM mediates the observed alterations in the preadipocytes. Additional evidence for insulin and glucose regulating leptin production is provided by the finding that hyperinsulinemic euglycemic clamps of different durations increase serum leptin concentrations (29–31). Both humans and animals exposed to GDM or increased blood glucose concentrations during fetal life showed increased plasma leptin levels independently of adiposity (32–34), further suggesting that leptin is a central protein in fetal programming of disease across tissues and blood. Interestingly, we previously investigated cultured preadipocytes established from adults born with a low birth weight, representing an unfavorable fetal environment, and found an opposite regulation of leptin, with decreased secretion and gene expression and increased methylation (9). Together, these findings suggest that leptin is a target for bidirectional regulation during fetal programming of preadipocytes, affected in opposite manners by either excess glucose or a lack of nutrition in fetal life.
We found increased in vivo fat cell size in adipose tissue sections from O-GDM compared with O-BP, demonstrating that O-GDM have larger adipocytes. This was despite no differences in BMI and fat mass (% and kilograms), suggesting that the cells are intrinsically coded to take up more lipids or have a genetic predisposition to become larger. Studies have shown that large adipocytes are associated with dyslipidemia, glucose and insulin abnormalities (35, 36), and insulin resistance (37). Indeed, the O-GDM group had a tendency toward increased glucose levels after 30 minutes of the OGTT, in line with previous Danish findings reporting an eightfold increased risk of developing T2D for O-GDM subjects (6). Together, this suggests that larger adipocytes are part of the pathophysiology involved in the increased risk of developing T2D in O-GDM. An intact ability to increase the adipose tissue in periods of excessive nutrient intake is important to avoid deposition of ectopic fat in, for example, muscle and liver (20). In our cultured preadipocytes, we found that the O-T1DM group (P = 0.0788) had a tendency toward increased lipid accumulation in the basal state, again suggesting that the adipocytes are programmed to grow disproportionately, even in times of stable energy supply. Interestingly, only O-BP could accumulate significantly more fat, when challenged with 3 days of fatty acid supply, suggesting a better capability to handle overnutrition in times of overnutrition.
Basal intracellular lipid accumulation in the cultured cells correlated significantly with leptin secretion. Leptin release has been found to increase in response to an increasing amount of intracellular lipids, which then stimulates lipolysis (38). Overall, O-T1DM adipocytes had increased lipolysis. Looking specifically at basal lipolysis and fatty acid supplemented lipolysis, respectively, we found that basal lipolysis did not differ between the groups; however, when challenged with a fatty acid supply for 3 days, we found substantial upregulation of glycerol in the cell media in both O-GDM and O-T1DM compared with O-BP. This suggests that cultured adipocytes from the two hyperglycemic groups have decreased lipid accumulation and increased glycerol release when the cells are challenged with fatty acids. Altogether, our findings point toward a more generalized dysregulation in fatty acid turnover in adipocytes, which could potentially be associated with an altered regulation of leptin and its promoter methylation. Indeed, in this study, we found a positive correlation between adipocyte leptin secretion and glycerol release. A direct relation between leptin and lipolysis has previously been shown; both long-term and short-term administration of leptin in rats results in a nine- to 16-fold increase in rates of lipolysis (39). Increased expression of the leptin gene in adipocytes and increased circulating levels of leptin may also contribute to enhanced lipolysis in obesity (40). It is therefore possible that an altered leptin methylation and consequently altered leptin production is central for the dysregulation of fatty acid turnover in O-GDM and O-T1DM adipocytes.
When fatty acids are made available by lipolysis, they can be metabolized in the adipocyte itself or be transported to another cell. Adipocyte fatty acid oxidation takes place inside mitochondria, of which white adipocytes typically have few (41). Studies in humans and animals with significantly altered fat mass, such as in obesity, indicate that impaired adipocyte mitochondrial function may be linked to the development of metabolic diseases such as insulin resistance and diabetes (41). We found no difference in basal oxygen consumption rate between the groups, but when stimulated with FCCP (which stimulates respiration in the mitochondria by uncoupling adenosine triphosphate synthesis from electron transport), the O-BP adipocytes responded superiorly and were able to increase their maximal mitochondrial capacity significantly more than O-GDM.
Overall, this study has a great strength in having two groups exposed to hyperglycemia in utero, with a high (O-GDM) or a low (O-T1DM) genetic predisposition to T2D. In this study, we find many similar alterations in the two hyperglycemic exposure groups compared with the control group, with alterations that are sometimes being more pronounced in O-T1DM than in O-GDM. We therefore believe that hyperglycemia rather than genetic predisposition mediates many of the differences we found in the two hyperglycemic exposure groups. That T1DM mothers suffer from more severe hyperglycemia throughout the entire pregnancy may explain the slightly worse phenotype of the O-T1DM cells. Also, the alterations we found in the adipocytes in the two hyperglycemic groups cannot be explained by group differences in whole-body BMI and fat percentage, which could affect the preadipocytes in the body. The observed differences could instead be due to defects in the intrinsic preprogramming of the adipocytes, which happened in utero.
Our study is of great importance because maternal diabetes and gestational diabetes increase the risk of diabetes in the following generations by creating a vicious cycle of “diabetes begetting diabetes.” Importantly for public health, risk factor modifications during pregnancy may be possible to implement and have the potential to prevent disease not only in the mothers but also in their children.
Abbreviations:
- ANOVA
analysis of variance
- ATGL
adipose triglyceride lipase
- BMI
body mass index
- FABP4
fatty acid binding protein 4
- FCCP
carbonyl cyanide p-trifluoromethoxyphenylhydrazone
- GDM
gestational diabetes mellitus
- HSL
hormone-sensitive lipase
- mRNA
messenger RNA
- O-BP
offspring from the background population
- O-GDM
offspring of women with gestational diabetes
- OGTT
oral glucose tolerance test
- O-T1DM
offspring of women with type 1 diabetes mellitus
- PCR
polymerase chain reaction
- SEM
standard error of the mean
- T1DM
type 1 diabetes mellitus
- T2D
type 2 diabetes.
Acknowledgments
Anne Andersen (Teilum Building, Rigshospitalet, Copenhagen, Denmark) is acknowledged for her help with creating adipocyte tissue slides and staining them. Henning Laursen and Helle Broholm (Department of Neuropathology and Pathology, Rigshospitalet, Copenhagen, Denmark) are acknowledged for their analytical assistance of the adipocyte histology slides.
The study was funded by Rigshospitalet, Danish PhD School of Molecular Metabolism, The Danish Council for Independent Research, European Foundation for the Study of Diabetes, and Aase and Ejnar Danielsens Fond. The Centre for Physical Activity Research (CFAS) is supported by a grant from TrygFonden. During the study period, the Centre of Inflammation and Metabolism (CIM) was supported by a grant from the Danish National Research Foundation (DNRF55). CIM/CFAS is a member of DD2 - the Danish Center for Strategic Research in Type 2 Diabetes (the Danish Council for Strategic Research, Grants 09-067009 and 09-075724). The Novo Nordisk Foundation Center for Basic Metabolic Research (http://www.metabol.ku.dk) is supported by an unconditional grant from the Novo Nordisk Foundation to University of Copenhagen.
Author contributions: A.V. and C.B. are the guarantors of this work and, as such, had full access to all the data in the study and take responsibility for the integrity of the data and the accuracy of the data analysis. N.S.H., K.S.S., A.V., C.S., and C.B. designed the cell study; L.K., T.D.C., and P.D. designed the human cohort study; N.S.H., K.S.S., L.H., M.S., H.S.S., L.K., A.H.-Ø., and C.B. performed the experiments; N.S.H., K.S.S., L.H., H.S.S., and C.B. analyzed the data; N.S.H., K.S.S., A.V., and C.B. interpreted the results of the experiments; N.S.H and H.S.S. prepared the figures; N.S.H., K.S.S., A.V., and C.B. drafted the manuscript; N.S.H, K.S.S., L.H., L.K., A.H.-Ø., M.S., H.S.S., C.S., B.K.P., C.L., T.D.C., P.D., A.V., and C.B. edited and revised the manuscript. All authors approved the final version of the manuscript.
Disclosure Summary: A.V. and H.S.S. are stockholders in Novo Nordisk. The remaining authors have nothing to disclose.
References
Author notes
Address all correspondence and requests for reprints to: Ninna Schiøler Hansen, MSc, Department of Endocrinology, Diabetes and Metabolism, Rigshospitalet–Section 7652, Tagensvej 20, DK-2200 Copenhagen, Denmark. E-mail: [email protected].
