


Abstract
Vitamin D deficiency disproportionately affects nonwhite individuals. Controversy persists over how to best restore low 25D levels, and how to best define vitamin D status [total (protein bound plus free) vs free 25D].
To assess the effects of vitamin D3 (cholecalciferol, or D3) vs 25-hydroxyvitamin D3 (calcifediol, or 25D3) on total and free 25D in a multiethnic cohort of adults, and whether change in parathyroid hormone (PTH) is more strongly associated with total vs free 25D.
Sixteen-week randomized controlled trial. Biochemistries at 0, 4, 8, and 16 weeks.
Academic medical center.
Thirty-five adults ≥18 years of age with 25D levels <20 ng/mL.
Sixty micrograms (2400 IU)/d of D3 or 20 μg/d of 25D3.
Total and free 25D, and PTH.
Baseline total (16.2 ± 3.7 vs 17.0 ± 2.5 ng/mL; P = 0.4) and free (4.2 ± 0.8 vs 4.7 ± 1.0 pg/mL; P = 0.2) 25D were similar between D3 and 25D3 groups, respectively; 25D3 increased total (+25.5 vs +13.8 ng/mL; P = 0.001) and free (+6.6 vs +3.5 pg/mL; P = 0.03) 25D more than D3. By 4 weeks, 87.5% of 25D3 participants had total 25D levels ≥30 ng/mL, compared with 23.1% of D3 participants (P = 0.001). Change in PTH was associated with both total (P = 0.01) and free 25D (P = 0.04).
25D3 increased total and free 25D levels more rapidly than D3, regardless of race/ethnicity. Free and total 25D were similarly associated with change in PTH.
Low serum 25-hydroxyvitamin D (25D) is associated with adverse skeletal health outcomes. In particular, low 25D leads to decreased intestinal calcium absorption, increased parathyroid hormone (PTH) secretion, and increased bone resorption (1). At the present time, controversy persists over (1) how to best raise low serum 25D levels, and (2) whether vitamin D status is best assessed by measuring serum concentrations of total (protein bound plus free) vs free 25D.
When serum total 25D levels are low, clinicians generally recommend supplementation with either ergocalciferol (D2) or cholecalciferol (D3) (2). Most studies report that orally administered D3 raises 25D levels to a greater extent than does D2 (3–7), but even supplementation with currently recommended D3 doses may not reliably increase total 25D levels to >30 ng/mL (2). Whereas a 25D level of >20 ng/mL is likely adequate for the general population (8), a threshold of ≥30 ng/mL may be advisable for individuals with osteoporosis, especially if antiresorptive therapy is used (2, 9). Although bolus D2 and D3 are generally effective at raising total 25D levels to ≥30 ng/mL, the safety of this approach has recently been called into question because of its association with increased risk of falls in elderly populations (10, 11). An alternative approach may therefore be required. Presumably owing to its ability to bypass carbon-25 hydroxylation in the liver and its relative affinity for the circulating vitamin D binding protein (DBP), pharmacologic 25-hydroxyvitamin D3 (calcifediol, or 25D3) more rapidly and robustly raises serum 25D levels than does parent D3 (12-18). Administration of 25D3 also suppresses PTH secretion, whereas D3 does not (18). All recent human trials comparing D3 with 25D3 were conducted in predominantly white study populations (16–18). However, given that low 25D is more prevalent among individuals with increased skin pigmentation (1, 2), it is important to identify optimal approaches for restoring 25D stores to adequate levels in individuals of all racial/ethnic backgrounds.
In addition to questions relating to the optimal approach to vitamin D supplementation, another area of intensive research focuses on whether total vs free 25D represents a superior marker of vitamin D status in vivo. In serum, 25D is primarily bound to DBP and albumin, with <1% of total 25D circulating in its free (unbound) form (19). In classical vitamin D physiology, DBP-bound 25D is internalized by the renal epithelial cell via megalin (a DBP receptor), and then activated to 1,25-dihydroxyvitamin D (1,25D) by the 1-α hydroxylase, CYP27B1 (20). The 1,25D then acts in an endocrine fashion to facilitate intestinal calcium absorption (21). On the basis of this information, one would theorize that total 25D represents a better marker of vitamin D status of classical vitamin D bioactivity. In nonclassical vitamin D physiology involving tissues that do not express megalin, it has been proposed that free 25D is internalized by the target cell via simple diffusion, and then converted to 1,25D by locally expressed CYP27B1 (19, 22). On the basis of this concept, one would hypothesize that free 25D represents a better marker of vitamin D status of nonclassical vitamin D bioactivity.
The aforementioned paradigm, however, may be an oversimplification. In particular, it remains unclear whether 25D enters only megalin-expressing tissues bound to DBP, or if some 25D enters the target cell in free unbound form. For example, DBP−/− mice placed on a vitamin d–containing diet maintain normal serum PTH levels and develop normal skeletons (23). If 25D only enters megalin-expressing renal epithelial cells bound to DBP, one would expect these mice to be incapable of producing adequate amounts of 1,25D, which would lead to secondary hyperparathyroidism and osteomalacia. This, however, was not seen, suggesting to us that, at least in mice, both DBP-bound and free 25D enter the megalin-expressing renal epithelial cell in vivo. In human clinical trials, PTH is frequently used as a biomarker of classical vitamin D physiology. Some cross-sectional analyses report that bioavailable or free 25D is more strongly associated with PTH (24, 25), whereas other studies do not (26–28). Importantly, there are limited longitudinal studies assessing the associations between total vs free 25D and change in PTH. Finally, there are no data reporting the effects of 25D3 supplementation on circulating free 25D concentrations.
This study was therefore designed to address the two following questions: (1) What are the comparative effects of D3 vs 25D3 on total and directly measured free 25D levels in a multiethnic cohort of healthy adults, and (2) does free 25D represent a superior in vivo marker of vitamin d–mediated bioactivity in maintenance of normal calcium balance above and beyond total 25D?
Materials and Methods
Study subjects
We recruited a total of 35 individuals from the University of California, Los Angeles (UCLA) student body, staff, and patient population. Recruitment was carried out through e-mail advertisements, social media postings, and direct patient contact. Inclusion criteria were age ≥18 years and a baseline 25D level <20 ng/mL. Exclusion criteria included history of hypercalcemia, hypercalciuria, nephrolithiasis, intestinal malabsorption, or dysregulated vitamin D metabolism (from underlying comorbidity or medication). Participants agreed to refrain from changing their dietary calcium intake and from taking self-prescribed calcium or vitamin D supplements for the study duration. All participants provided informed consent. The study was approved by the UCLA Institutional Review Board and was registered on ClinicalTrials.gov under identifier NCT02091219.
Study intervention
Study participants were randomly assigned in blocks of four (stratified by race/ethnicity) to either D3 [60 μg (2400 IU)/d] or 25D3 (20 μg/d) for 16 weeks. The 20 μg/d dose of 25D3 was selected because it effectively and safely raises 25D levels from <20 ng/mL to ≥30 ng/mL (16–18). The 60 μg/d dose of D3 was selected because it represents a bioequivalent dose (17) and corresponds to a daily intake level that, in dose-response studies, maintains 25D levels ≥30 ng/mL (29). D3 and 25D3 were obtained from DSM Nutritional Products in powder form. These were compounded by the UCLA Investigational Pharmacy into capsules for distribution to study participants. Expected D3 and 25D3 content was confirmed by liquid chromatography–mass spectrometry (LC/MS/MS) (Heartland Assays). Participants were evaluated at baseline and at 4, 8, and 16 weeks after initiation of D3 or 25D3 (four visits total). At each visit, participants were asked about possible adverse events. Adherence was assessed by pill count.
Measurements
Biochemical assessment was performed at all four study visits. Serum measurements included total 25D, free 25D, total 1,25D, calcium, and intact PTH. Urinary measurements included a calcium:creatinine excretion ratio from an early morning fasting sample. Total 25D was measured by chemiluminescence immunoassay (Diasorin; Liaison) in the UCLA Department of Pathology and Laboratory Medicine; this laboratory participates in the College of American Pathologists Accuracy-Based Vitamin D Survey. Intra- and interassay coefficients of variation (CVs) were 2.1% to 2.2% and 4.0% to 4.5%, respectively. Total 1,25D was measured by chemiluminescence immunoassay (Diasorin; Liaison). Intra- and interassay CVs were 2.4% to 3.9% and 4.5% to 7.8%, respectively. Although LC/MS/MS represents the gold standard for measuring vitamin D metabolites, the Diasorin (Liaison) assay has acceptable performance for measuring D3 metabolites (relevant to this study) when compared with LC/MS/MS (30). Free 25D was measured using an antibody-based assay from Future Diagnostics, as previously described (28). The assay limit of detection is 1.9 pg/mL. In the range of concentrations measured, the CV was ≤7%. PTH was measured by electrochemiluminescence immunoassay (Cobas; Roche). Intra- and interassay CVs were 0.8% to 1.5% and 1.5% to 1.8%, respectively.
Statistical analyses
Descriptive statistics of relevant continuous clinical covariates and biochemical measurements were generated and assessed for normality. Differences in baseline characteristics between D3 and 25D3 groups were assessed by the independent samples t test (continuous variables) or χ2 test (categorical variables). Changes in biochemical measurements within D3 and 25D3 treatment groups were examined by the paired t test. Differences in biochemical measurements at 4, 8, and 16 weeks between D3 and 25D3 groups were assessed by the independent samples t test. Associations between total or free 25D (primary predictor in separate analyses) and change in PTH from time of 25D measurement to next follow-up visit (outcome variable) were assessed using repeated-measures, mixed-effects regression. All models were adjusted for factors that could influence change in PTH, including serum calcium, age, body mass index (BMI), race/ethnicity, and supplementation regimen.
Results
Patient characteristics
A total of 16 and 19 subjects were randomly assigned to receive D3 and 25D3, respectively. Age, race/ethnicity, and BMI were not significantly different between D3 and 25D3 groups. Baseline total 25D [16.2 ± 3.7 (D3) vs 17.0 ± 2.5 (25D3); P = 0.5], free 25D [4.2 ± 0.8 (D3) vs 4.7 ± 1.0 (25D3); P = 0.2], 1,25D, calcium, and PTH were also similar between groups (Table 1).
Baseline Characteristics
| Cholecalciferol (D3) (n = 16) | Calcifediol (25D3) (n = 19) | P Value | |
|---|---|---|---|
| Age, y | 36.9 (12.7) | 34.8 (8.6) | 0.6 |
| Race/ethnicity | |||
| White | 2 (12.5) | 3 (15.8) | 0.8 |
| African American | 6 (37.5) | 5 (26.3) | 0.5 |
| Asian American | 6 (37.5) | 6 (31.6) | 0.7 |
| Hispanic/Latino | 2 (12.5) | 5 (26.3) | 0.3 |
| BMI, kg/m2 | 25.7 (6.1) | 27.4 (7.4) | 0.5 |
| Total 25D, ng/mL | 16.2 (3.7) | 17.0 (2.5) | 0.4 |
| Free 25D, pg/mL | 4.2 (0.8) | 4.7 (1.0) | 0.2 |
| 1,25D, pg/mL | 51.8 (14.2) | 58.8 (17.6) | 0.2 |
| Calcium, mg/dL | 9.3 (0.4) | 9.6 (0.3) | 0.1 |
| Urinary calcium:creatinine | 0.06 (0.04) | 0.05 (0.04) | 0.6 |
| PTH, pg/mL | 40.1 (18.6) | 34.6 (13.9) | 0.3 |
Continuous variables presented as mean (standard deviation). Categorical variables presented as count (percentage).
Effects of D3 vs 25D3 on serum vitamin D metabolites
At the 16-week follow-up, total 25D increased to a greater extent with 25D3 (+25.5 ng/mL) than with D3 (+13.8 ng/mL) (P = 0.008). Final total 25D was 42.4 ± 15.9 ng/mL with 25D3 supplementation, compared with 29.6 ± 4.1 ng/mL with D3 (P = 0.007). Along these lines, free 25D also increased to a greater extent with 25D3 (+6.9 pg/mL) than with D3 (+3.6 pg/mL) (P = 0.03). Final free 25D was 11.6 ± 5.6 pg/mL with 25D3 supplementation, compared with 7.8 ± 1.9 pg/mL with D3 (P = 0.02) (Fig. 1). Total and free 25D were highly correlated (Fig. 2). Highlighting the rapidity with which 25D3 restores 25D levels, total and free 25D were already significantly higher in the 25D3 group by 4 weeks (P = 0.004 for total 25D; P = 0.02 for free 25D). Furthermore, by 4 weeks, mean total 25D was >30 ng/mL in the 25D3 group (34.5 ± 10.4 ng/mL), but not in the D3 group (25.4 ±4.3 ng/mL). In fact, by 4 weeks, 14 of 16 25D3 participants had achieved total 25D levels ≥30 ng/mL, compared with only 3 of 19 D3 participants (P = 0.001). Of note, at 16 weeks, mean total 25D remained ≤30 ng/mL in the D3 group (29.6 ± 4.1 ng/mL). All trends were similar across race/ethnic groups.
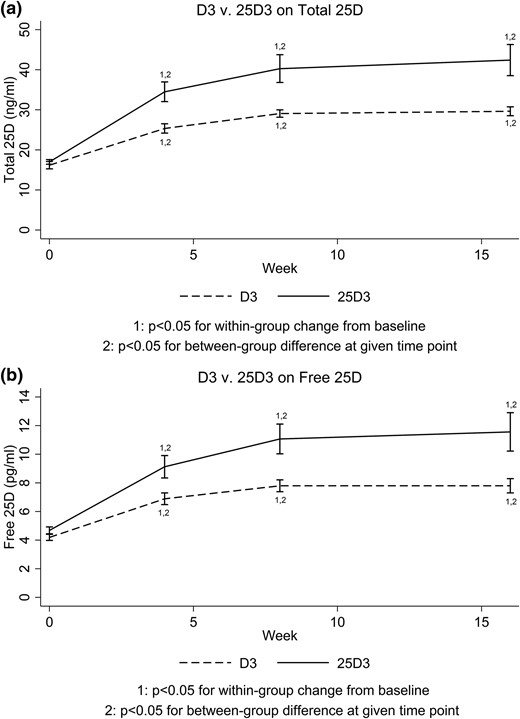
Changes in vitamin D metabolites with D3 vs 25D3. (a) Total 25D and (b) free 25D.
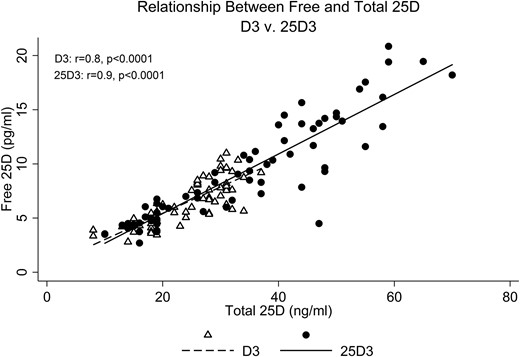
Relationship between free and total 25D levels, stratified by supplementation regimen.
From baseline to 16 weeks, total 1,25D increased with both D3 (+15 pg/mL; P = 0.005) and 25D3 (+11.5 pg/mL; P = 0.09). Final 1,25D concentrations were similar between groups [66.8 ± 13.9 (D3) vs 70.3 ± 23.4 (25D3) pg/mL; P = 0.6].
Association between change in PTH and vitamin D metabolites
The associations between higher total vs free 25D and subsequent decrease in PTH were examined in adjusted mixed-effects regression models (Table 2). After adjusting for covariates that could influence PTH level (i.e., age, BMI, race/ethnicity, serum calcium, and supplementation regimen), we found that both higher total and free 25D were significantly associated with declines in PTH from the time of 25D measurement to the next follow-up visit. More specifically, for every nanogram per milliliter increase in total 25D, PTH decreased by 0.8% over the ensuing 4 weeks (P = 0.01). Along the same lines, for every picogram per milliliter increase in free 25D, PTH decreased by 2.5% over the ensuing 4 weeks (P = 0.04). Of note, PTH did not decrease significantly over the course of the study with either supplementation regimen (P > 0.6 for all). However, PTH was already relatively low at study baseline [40.1 ± 18.6 (D3) vs 34.6 ± 13.9 (25D3) pg/mL; P = 0.4]. Higher 1,25D was not significantly associated with decrease in PTH.
Adjusteda Associations Between Total vs Free 25D and Percent Decrease in PTH From Time of 25D Measurement to Next Follow-Up Visit
| Percent Decrease in PTH per Unit Increase in Total vs Free 25D | ||
|---|---|---|
| β coefficientb (95% CI) | P Value | |
| Total 25D | 0.804 (1.475–0.134) | 0.01 |
| Free 25D | 2.512 (4.976–0.048) | 0.04 |
| Percent Decrease in PTH per Unit Increase in Total vs Free 25D | ||
|---|---|---|
| β coefficientb (95% CI) | P Value | |
| Total 25D | 0.804 (1.475–0.134) | 0.01 |
| Free 25D | 2.512 (4.976–0.048) | 0.04 |
Adjusted for serum calcium, age, BMI, race/ethnicity, and supplementation regimen.
The β coefficient should be interpreted as follows: For each nanogram per milliliter increase in total 25D or picogram per milliliter increase in free 25D, PTH decreases by “β” percent.
Adherence
Adherence to supplementation was determined by pill count. Adherence was 90.1% and 91.9% in the D3 and 25D3 groups, respectively.
Safety
Serum calcium and urinary calcium excretion did not change significantly from baseline to 16 weeks with either D3 or 25D3 (P > 0.4 for all). There were no reports of hypercalcemia, hypercalciuria, or nephrolithiasis.
Discussion
The aims of this 16-week study were to (1) compare the effects of D3 vs 25D3 on circulating levels of total and free 25D in a multiethnic cohort of healthy adults, and (2) determine if increases in total or free 25D are more strongly associated with decrease in PTH, a marker of vitamin D bioactivity. As hypothesized, we found that 25D3 more rapidly and robustly increases total and free 25D levels than does D3; this was true regardless of race/ethnicity. Among those who received 25D3, the mean total 25D increased to ≥30 ng/mL by 4 weeks. In contrast, among those who received D3, the mean total 25D remained <30 ng/mL for the entire study. We also found that higher levels of both total and free 25D were significantly associated with future decline in serum PTH.
Our first key finding was that 20 μg/d of 25D3 increases total 25D levels more rapidly and robustly than does 60 μg/d of D3. These data are consistent with prior studies that have compared the effects of D3 and 25D3 on total serum 25D levels. In a four-month trial of 20 postmenopausal women, 20 μg/d of 25D3 increased mean serum total 25D levels to ≥30 ng/mL by ∼35 days. The final total 25D at study completion was 69.5 ng/mL. In contrast, 20 μg (800 IU)/d of D3 did not reliably increase total 25D levels to ≥30 ng/mL, given that levels in ∼50% of participants remained below this threshold at the end of 16 weeks; the final total 25D was 30.1 ng/mL (16). Another 10-week trial of 56 adults ≥50 years of age compared placebo against 20 μg (800 IU)/d of D3, 7 μg/d of 25D3, and 20 μg/d of 25D3. Again, 20 μg/d of 25D3 increased mean total 25D to ≥30 ng/mL by 5 weeks; the final total 25D at 10 weeks was 53.6 ng/mL. As was the case in the prior study (18), 20 μg/d of D3 did not raise mean total 25D levels to ≥30 ng/mL even by the completion of the study presented here.
Our second key finding was that 25D3 increases free 25D levels more quickly and to a greater extent than does D3, and that both free and total 25D were similarly associated with a subsequent decline in serum PTH. To our knowledge, the free 25D response to 25D3 supplementation has not been previously reported. Our data are consistent with prior cross-sectional and longitudinal studies demonstrating that free and total 25D levels are strongly correlated, such that changes in both track closely together (7, 26, 28, 31–33). With respect to the question of whether free vs total 25D is a superior marker of vitamin D bioactivity, multiple studies have assessed the cross-sectional association between total vs free 25D and markers of skeletal health, e.g., serum PTH, bone turnover markers, and bone mineral density (24–27, 34, 35). Some studies have reported a stronger association with free 25D levels (24, 25, 34), but others have not (26, 35). These inconsistencies may result from differences in study populations and methodologies for determining bioavailable or free 25D levels. In particular, free 25D levels can be directly measured by antibody-based assays (as we have done here) or indirectly calculated from total 25D, albumin, DBP quantity, and DBP isoform (which affects DBP affinity for 25D) (19). Of note, recent studies have questioned both the accuracy of a commonly used monoclonal antibody–based assay for measuring DBP levels, as well as the frequent practice of using a single DBP affinity constant when calculating free 25D concentrations (31, 33, 36). Given their cross-sectional nature, heterogeneity in methodology for assessing free 25D levels, and possibly biased approach for calculating free 25D levels, these studies do not allow us to draw cause-and-effect conclusions.
Here, our longitudinal data show that higher total and free 25D levels were similarly associated with future decline in PTH, and that free 25D did not provide any additional information above and beyond total 25D. PTH secretion is regulated by two principle mechanisms, the calcium-sensing receptor and the vitamin D receptor (VDR) (37–39). The calcium-sensing receptor detects changes in circulating calcium concentrations, which are partly determined by 1,25D-mediated intestinal calcium absorption (37). Under normal physiologic conditions, circulating 1,25D is principally produced by megalin-expressing renal epithelial cells (40). One would therefore expect total 25D to be more strongly associated with decline in PTH. The parathyroid cell also expresses CYP27B1 and VDR (38), suggesting that it possesses the cellular machinery necessary to convert internalized 25D to 1,25D; this locally produced 1,25D then engages the VDR, leading to suppression of PTH production. Because parathyroid cells also express megalin (19, 40), one would similarly expect total 25D to be the physiologically relevant metabolite. There is evidence, however, to suggest that megalin-expressing tissues internalize not only DBP-bound, but free 25D as well (23). For example, DBP-null mice placed on a vitamin d–containing diet have a normal serum PTH level and develop normal skeletons (23). If the renal epithelial cell exclusively internalizes DBP-bound 25D, one would expect these mice to exhibit secondary hyperparathyroidism and osteomalacia. Given that this was not seen, we presume that, at least in mice, both DBP-bound and free 25D enters megalin-expressing renal epithelial and/or parathyroid cells in vivo. Our current data do not definitively allow us to discern whether this is similarly the case in humans. Of note, some investigators suggest that free 25D levels in the range observed in this study are too minuscule to accomplish meaningful biological functions (19, 41). This may be true for megalin-expressing target cells, given that DBP-bound 25D concentrations far exceed free 25D. However, in nonmegalin-expressing cells, free 25D may be more biologically active because DBP-bound 25D does not have a mechanism for cellular entry. Future studies will be required to determine whether concentrations of circulating free 25D achieved in vivo are adequate to influence either skeletal and/or nonskeletal vitamin D physiology.
Our study has several clinical implications. First, 25D3 is more reliable at increasing total 25D levels to ≥30 ng/mL. Whereas a 25D level ≥20 ng/mL is likely sufficient to maintain skeletal health in the generally healthy population (8), a 25D level ≥30 ng/mL may be preferable among those with osteoporosis, especially if antiresorptive therapy is prescribed (2, 9). In fact, some even recommend restoring 25D levels to this threshold prior to initiating osteoporosis pharmacotherapy (9, 42). To this end, identifying an approach for raising inadequate 25D levels to target threshold levels reliably and quickly is important for preventing delay of therapy and possibly optimizing response to therapy. Although one could argue that bolus D2 or D3 fills this role adequately, this approach has recently been called into question, given its association with increased risk of falls (10, 11). In this setting, daily 25D3 may be advantageous compared with D3. Despite its more potent effects on raising serum 25D levels, 25D3 increased 1,25D concentrations to a similar extent as D3. This suggests that pharmacologic 25D3 does not overwhelm the body’s compensatory mechanisms for maintaining normal calcium homeostasis, and risk of developing hypercalcemia may not be increased with 25D3. However, it does warrant mention that parent vitamin D may have important physiological effects that were not previously recognized (e.g., endothelial stabilization) (41, 43). When targeting these tissues, D3 may be preferable. Future studies are necessary to assess when D3 vs 25D3 is indicated. Finally, our data suggest that with respect to skeletal health, measuring free 25D is likely not superior to measuring total 25D in instances in which DBP and/or albumin synthesis is not altered (36).
Several weaknesses of this study warrant mention. First, the study sample size was relatively small. This, however, would bias our results toward null. Therefore, the differences between D3 and 25D3, and the associations seen between change in PTH and change in total and free 25D, would likely only be strengthened with increased sample size. Second, our study participants were not severely vitamin D deficient, as suggested by the relatively low PTH levels observed at baseline. This may be one reason that PTH did not decrease significantly even with 25D3, as was previously reported (18). Perhaps if we had included exclusively patients with both low 25D levels and frank secondary hyperparathyroidism, a more pronounced biomarker benefit would have been seen. Finally, our study focused on the association between total vs free 25D and a marker of skeletal health/calcium homeostasis. Because nonskeletal vitamin D–mediated bioactivity is generally carried out by cells that do not express megalin, free 25D may be a superior marker of these physiologic functions.
In conclusion, this study compared the effects of D3 to 25D3 on both total and directly measured free 25D levels in a multiethnic cohort of vitamin D–deficient healthy adults. Compared with D3, 25D3 more rapidly and robustly increases serum concentrations of total and free 25D, and more reliably increases total 25D to levels of ≥30 ng/mL by the fourth week of supplementation. These findings may have clinical implications for both skeletal and nonskeletal health outcomes. With respect to osteoporosis, 25D3 may have an important therapeutic role, given that higher 25D thresholds may be warranted, especially among those receiving pharmacologic therapy. In terms of nonskeletal health outcomes, 25D3 may be similarly beneficial because higher 25D levels are likely necessary to optimize local vitamin D bioactivity (22, 44). We also found that the association between higher total and free 25D levels and subsequent declines in PTH were similar, adding to the emerging consensus that free 25D may not provide additional information above and beyond total 25D for skeletal health measures. Future studies will be necessary to determine if free 25D is a superior marker of nonskeletal vitamin-mediated bioactivity.
Abbreviations:
- 1,25D
1,25-dihydroxyvitamin D
- 25D
25-hydroxyvitamin D
- 25D3
25-hydroxyvitamin D3, or calcifediol
- BMI
body mass index
- CV
coefficient of variation
- D3
vitamin D3 or cholecalciferol
- DBP
vitamin D binding protein
- LC/MS/MS
liquid chromatography–mass spectrometry
- PTH
parathyroid hormone
- UCLA
University of California, Los Angeles
- VDR
vitamin D receptor.
Acknowledgments
We thank Michelle Liao for assistance with Figure preparation.
This work was supported by National Institutes of Health National Center for Advancing Translational Science Grant UL1TR000124 to the UCLA Clinical and Translational Science Institute; National Institute of Arthritis and Musculoskeletal and Skin Diseases Grants R01AR063910 and P50AR063020; and the UCLA Specialty Training and Advanced Research Program. The content is solely the responsibility of the authors and does not necessarily represent the official views of the National Institutes of Health.
Clinical trial registry: ClinicalTrials.gov no. NCT02091219 (registered 12 March 2014).
Disclosure Summary: The authors have nothing to disclose.
References
Author notes
Address all correspondence and requests for reprints to: Albert Shieh, MD, Department of Medicine, Division of Geriatrics, University of California, Los Angeles, 10945 Le Conte, Suite 2339, Los Angeles, California 90095-1687. E-mail: [email protected].
