


Abstract
An imbalance of proangiogenic and antiangiogenic factors is thought to induce the widespread vascular dysfunction characteristic of preeclampsia (PreE). Erythropoietin (Epo), a pleiotropic cytokine, has important angiogenic and vasoactive properties; however, its contribution to maternal vascular dysfunction in PreE is unknown.
Because high altitude (HA) raises the incidence of PreE, we asked whether HA increased maternal Epo and soluble Epo receptor (sEpoR) levels and whether such effects differed between PreE and normotensive controls at HA.
Longitudinal studies were conducted in pregnant Andean residents at HA (n = 28; 3600 m) or sea level (SL; n = 16; 300 m). Cross-sectional studies included 34 gestational age‒matched Andean PreE cases (n = 17) and controls (n = 17) in La Paz–El Alto, Bolivia (3600 to 4100 m).
HA augmented the pregnancy-associated rise in Epo relative to SL (P = 0.002), despite similar reductions in hemoglobin (Hb) across pregnancy at each altitude (7% to 9%, P < 0.001 for both). HA PreE cases had circulating Epo levels equivalent to those of controls but greater sEpoR (P < 0.05) and reduced Hb (P = 0.06, trend).
Our findings suggest that an augmented pregnancy-associated rise in Epo may be important for successful vascular adaptation to pregnancy at HA. We further speculate that the elevated sEpoR observed in PreE vs controls at HA impedes the effect of Epo to maintain endothelial function and may, in turn, be of pathological relevance for PreE at HA.
Preeclampsia (PreE) is a multisystem vascular disease that complicates ∼8.5 million pregnancies each year and accounts for 40% of fetal mortality and 18% of maternal deaths (1). PreE and fetal growth restriction often coexist and account for nearly 30% of premature deliveries, with an estimated economic cost of $8.7 billion (2, 3). Among the numerous factors known to increase the risk of PreE are preexisting vascular disease, primiparity, advanced maternal age, and hypoxia such as that experienced at high altitude (HA; ≥2500 m). HA residence raises the incidence of PreE threefold, highlighting the clinical relevance of persistent maternal hypoxia for hypertensive pregnancy disorders (4, 5).
Successful pregnancy is accompanied by pronounced, systemic arterial and venous vasodilation, a 30% rise in cardiac output (6), and extensive remodeling of the maternal spiral arteries that ultimately facilitate perfusion of the placental bed. In PreE, a blunted maternal vasodilatory response to pregnancy and incomplete remodeling of the decidual and myometrial spiral arteries limit placental perfusion, thereby leading to hemodynamic and oxidative placental stress (7, 8). As a result, the PreE placenta is thought to release antiangiogenic and proinflammatory factors into the maternal circulation and initiate widespread maternal vascular endothelial dysfunction, hallmarks of PreE (9–12). For example, placental expression of the antiangiogenic factor soluble fms-like tyrosine kinase 1 (sFlt1) is markedly greater in PreE and is paralleled by an elevated sFlt1 level in the maternal circulation (9–12). Previous studies have focused on the roles of sFlt1, placental growth factor, and soluble endoglin in the angiogenic imbalance that is characteristic of PreE (9–12). We considered the role of another angiogenic factor—erythropoietin (Epo)—and its receptor (EpoR), which are both regulated by hypoxia and are thought to be essential for endothelial function and vascular homeostasis.
Epo is the master regulator of hypoxia-induced erythropoiesis, although it has several other functions that promote successful placentation and vascular adaptation to pregnancy. Functional Epo membrane-bound receptors are present not only on erythroid progenitor cells but also on vascular endothelial cells (13). Highlighting its pleiotropic nature, Epo acts as a potent angiogenic factor, promotes neovascularization, induces endothelial nitric oxide synthase activity, and enhances vascular repair in response to mechanical or ischemia-reperfusion injury (14–19). Further, Epo enhances trophoblast and decidual stromal cell proliferation and survival in early human pregnancy (20).
Alternative EpoR mRNA splicing produces a soluble form of the receptor (sEpoR) that is present in human peripheral blood and directly competes with membrane-bound receptor for unbound, circulating Epo (21); in this way, sEpoR impairs Epo signaling and Epo-mediated erythropoiesis (22). We hypothesized that HA would augment the pregnancy-induced rise in Epo and possibly reduce sEpoR levels. Further, we expected that such changes would be absent or compromised in PreE or, in other words, that women with PreE would have lower Epo and higher sEpoR levels than normotensive controls at HA. This study measured sEpoR during pregnancy at any altitude, compared changes in Epo and sEpoR levels during pregnancy at sea level (SL) vs HA, and contrasted Epo or sEpoR values between normotensive and PreE pregnancies at HA.
Materials and Methods
Study populations
Longitudinal and cross-sectional cohorts were included in this study. Cohort 1 consisted of 44 Andean women residing at HA (n = 28; 3600 to 4300 m) or SL (n = 16; 300 m) who remained normotensive throughout their pregnancy. These women were participants in a larger investigation designed to identify physiological and genetic components of hypoxia-associated intrauterine growth restriction (IUGR) (23, 24). Subjects were studied longitudinally to determine whether HA altered the magnitude and pattern of Epo and sEpoR levels across normotensive pregnancy. Subjects were referred by their prenatal care provider. For inclusion, women were required to be receiving prenatal care, have a singleton pregnancy, have no known risk for pregnancy complications (e.g., diabetes, preexisting hypertension, cardiovascular disease, history of gestational diabetes), and to self-identify as being of Aymaran or Quechuan descent. Only women with serial samples for study points of interest (20 and 36 weeks of pregnancy and 3 to 4 months postpartum) were included in the analysis. We excluded smokers and those with active infections. All women completed a health and demographic questionnaire identifying their age, parity, duration of residence at current altitude, and medical and reproductive history. All subjects also underwent an obstetrical examination. During the physical examination, we measured bilateral upper extremity blood pressure (BP) levels, height, and weight. Urine samples were collected to screen for infection and proteinuria. Between 9 and 11 am, nonfasting maternal venous blood samples were drawn from an antecubital vein into EDTA collection tubes using standard techniques; the plasma was then separated and stored at −80°C until analysis. HA studies were conducted at the Bolivian Institute of High Altitude Biology and the Southern Clinic in La Paz–El Alto, Bolivia. SL studies were performed at the Siraní Clinic in Santa Cruz de la Sierra, Bolivia.
Cohort 2, the cross-sectional cohort, consisted of 34 pregnant Andean women who presented for obstetrical care at 4 hospitals (Hospital de Los Andes, n = 19; Bolivia-Holandés, n = 5; Materno-Infantil, n = 9; and Hospital de la Mujer, n = 1) in La Paz–El Alto, Bolivia. Subjects included normotensive controls (n = 17) and PreE cases (n = 17) matched by gestational age within 2 weeks at the time of sampling (mean gestational ages for sampling were 34.2 ± 2.2 and 35.6 ± 3.0 weeks for normotensive controls and PreE patients, respectively). PreE patients were recruited within the first 24 hours after diagnosis, and blood samples were obtained as described previously after treatment with α-methyldopa and magnesium sulfate, which are standards of care in Bolivia. For ethical reasons, it was not possible to delay treatment for research purposes; therefore, blood samples were obtained after treatment. Inclusion and exclusion criteria were the same as those described for Cohort 1. None of the normotensive controls developed PreE later in pregnancy.
All subjects gave written informed consent for study procedures previously approved by the Colorado Multiple Institutional Review Board and the Colégio Médico, its Bolivian counterpart.
Definitions
Women with PreE were normotensive before pregnancy but developed elevated systolic (>140 mm Hg) and diastolic (>90 mm Hg) BP levels after 20 weeks. PreE was distinguished from gestational hypertension by the presence of ≥1+ proteinuria at presentation and was confirmed by ≥300 mg in a 24-hour urine collection. In all cases, BP and proteinuria measurements obtained before the initiation of treatment were used to classify subjects as PreE. Gestational week was based on the date of the last menstrual period and was confirmed by fetal biometry at week 20 or by clinical assessment at delivery.
Assessment of Epo and sEpoR levels
Plasma Epo and sEpoR levels were measured in duplicate using commercially available solid-phase sandwich enzyme-linked immunosorbent assay (ELISA) kits (R&D Systems, Inc., Minneapolis, MN) according to manufacturer specifications. Detection ranges for the Epo and sEpoR ELISA kits are 2.5 to 200 mIU/mL and 62.50 to 4000 pg/mL, respectively. Intra- and inter-assay variability for Epo ELISA kits are 2.8% to 5.2% coefficient of variation (CV) and 4.2% to 8.3% CV, respectively, as indicated by R&D Systems. For sEpoR, the manufacturer does not report intra- or inter-assay variability; we calculated sEpoR intraassay CVs of 6.9% to 12.9% and interassay CVs of 1.5% to 13.8%. Samples with undetectable Epo and sEpoR levels were assigned the lower detection limit values (i.e., 2.5 mIU/mL and 62.5 pg/mL, respectively).
Blood volume
Statistical analysis
In the text, tables, and figures, data are expressed as means ± standard deviation (SD) or as percentages with 95% confidence intervals after normality was affirmed using Kolmogorov-Smirnov tests. Pearson correlation was used to identify the potential influence of gestational age at the time of sampling and maternal characteristics (age, parity, weight) for our primary outcome variables (i.e., Epo and sEpoR); none were significant in either cohort and thus were not included as covariates. Repeated-measures 2-way analysis of variance (ANOVA) with Sidak corrections for multiple comparisons was used to compare continuous variables between altitudes across pregnancy. Paired t tests were used to compare continuous variables between gestational age‒matched normotensive controls and PreE cases. Proportions were compared using Fisher’s exact test. Pearson correlation and linear regression were used to determine the relationship between Epo and indicators of pregnancy-induced hemodilution. All analyses were conducted using SPSS 24.0 (IBM Corp, Armonk, NY), and results were considered significant when P < 0.05. Sample sizes and statistical tests are noted for each table and figure as appropriate.
Results
Maternal, newborn, and delivery characteristics
Cohort 1
Women studied longitudinally at SL and HA were similar in age (26.4 ± 1.2 and 27.2 ± 1.3 years, respectively) and had lived at their current altitude for most of their life (20.5 ± 7.6 and 21.7 ± 9.1 years, respectively). Compared with their SL counterparts, HA women had greater parity (1.6 ± 0.8 and 2.9 ± 1.9 live births, respectively; P < 0.05) and shorter stature (P < 0.001; Table 1). Compared with low altitude (LA) women, HA women gained less weight from 20 to 36 weeks of pregnancy (P < 0.05) and weighed less at 36 weeks and postpartum (P < 0.01 for each).
Maternal, Newborn, and Delivery Characteristics
| Maternal Characteristics | Longitudinal Normotensive | Cross-sectional High Altitude | ||||
|---|---|---|---|---|---|---|
| Sea Level | High Altitude | P Value | Control | PreE | P Value | |
| Age, y | 26.4 ± 1.2 (16) | 27.2 ± 1.3 (28) | NS | 25.8 ± 2.8 (17) | 28.0 ± 7.0 (17) | NS |
| Parity, No. | 1.6 ± 0.8 (16) | 2.9 ± 1.9 (28) | <0.05 | 0.7 ± 0.7 (17) | 0.9 ± 1.2 (17) | NS |
| Current altitude, y | 20.5 ± 7.6 (16) | 21.7 ± 9.1 (28) | — | 25.2 ± 3.3 (17) | 23.1 ± 9.2 (17) | NS |
| Height, cm | 158 ± 2 (16) | 150 ± 1 (28) | <0.001 | 150 ± 4 (17) | 151 ± 9 (17) | NS |
| Weight gain, 20–36 wk, kg | 8.2 ± 3.9 (15) | 6.0 ± 3.1 (28) | <0.05 | — | — | — |
| Weight, 36 wk, kg | 65.8 ± 7.4 (16) | 76.9 ± 13.3 (28) | <0.01 | 63.7 ± 7.2 (17) | 72.7 ± 10.5 (17) | <0.01 |
| Weight, postpartum, kg | 68.8 ± 12.7 (16) | 59.3 ± 9.0 (28) | <0.01 | — | — | — |
| BMI, postpartum, kg/m2 | 27.4 ± 3.7 (16) | 26.3 ± 3.7 (28) | NS | — | — | — |
| Delivery and Newborn Characteristics | Sea Level | High Altitude | P Value | Control | PreE | P Value |
| Gestational age, wk | 39.5 ± 2.2, (15) | 39.4 ± 1.4 (25) | NS | 38.8 ± 1.0 (17) | 37.5 ± 2.4 (17) | Trend |
| Birth weight, g | 3425 ± 573, (16) | 3194 ± 364 (25) | 0.10 | 3104 ± 384 (17) | 2641 ± 641 (17) | <0.05 |
| Head circumference, cm | 35.4 ± 1.0 (16) | 34.2 ± 1.0 (21) | <0.01 | 33.8 ± 1.1 (16) | 33.7 ± 1.8 (16) | NS |
| Birth length, cm | 49.9 ± 2.4 (16) | 48.7 ± 1.9 (24) | 0.08 | 49.7 ± 1.4 (15) | 47.9 ± 2.1 (15) | <0.05 |
| Ponderal index, kg/m3 | 27.5 ± 3.0 (16) | 27.6 ± 2.7 (24) | NS | 25.0 ± 2.6 (15) | 24.2 ± 2.7 (15) | NS |
| Sex, % female | 50 (26, 75) (16) | 57 (39, 77) (26) | NS | 30 (6, 56) (13) | 30 (6, 56) (13) | NS |
| SGA, % yes | 18.8 (0, 37.9) (16) | 8.7 (0, 20.2) (23) | NS | 29 (7, 51) (17) | 35 (12, 58) (17) | NS |
| Preterm, % yes | 12.5 (0, 28.7) (16) | 8 (0, 18.6) (25) | NS | 0 (0, 0) (17) | 0 (0, 0) (17) | NS |
| Apgar score, 1 min | 7.9 ± 0.3 (16) | 7.9 ± 0.8 (21) | NS | 7.7 ± 0.5 (15) | 7.3 ± 1.4 (15) | NS |
| Apgar score, 5 min | 8.9 ± 0.7 (16) | 9.0 ± 0.8 (21) | NS | 9.6 ± 0.5 (15) | 9.1 ± 0.7 (15) | <0.01 |
| Cesarean delivery, % | 80 (59.8, 100.2) (15) | 17.9 (3.6, 32.0) (28) | <0.05 | 12 (0, 27) (17) | 59 (36, 82) (17) | <0.01 |
Continuous variables are shown as mean ± SD; categorical variables are shown as proportions with 95% CI; subject numbers are shown in italic for each variable.
Abbreviations: BMI, body mass index; CI, confidence interval; NS, nonsignificant; SGA, small for gestational age.
Infants born to SL and HA women were equivalent with respect to gestational age at birth, ponderal index, Apgar scores (1 and 5 minutes), and sex, as well as the proportion born IUGR (18.8% and 8.7%, respectively) or premature (12.5% and 8.0%, respectively; all P = NS). Eighty percent of SL infants were delivered by cesarean section vs 18% of HA infants (P < 0.05; Table 1). Birth weight (P = 0.09), length (P = 0.08), and head circumference (P < 0.01) were or tended to be reduced in HA newborns compared with LA newborns.
Cohort 2
In the cross-sectional cohort, normotensive and women with PreE were of similar age (25.8 ± 2.8 and 28.0 ± 7.0 years, respectively), parity (0.7 ± 0.7 and 0.9 ± 1.2 live births, respectively), and height (150 ± 4 and 151 ± 9 cm, respectively) and had lived at HA for a similar duration (24.8 ± 3.7 and 23.1 ± 9.1, respectively; all P = NS). Women with PreE weighed more than normotensive women at the time of gestational age‒matched sampling (P < 0.01; Table 1).
Compared with normotensive subjects, PreE infants tended to be born at a younger gestational age (38.8 ± 1.0 and 37.5 ± 2.4 weeks, respectively; P < 0.10) and were of lower birth weight and birth length (P < 0.05 for both) but had similar head circumference and ponderal index (Table 1). An equivalent proportion of normotensive and PreE infants were female, IUGR, or premature (all P = NS; Table 1). Apgar scores at 5 minutes were lower in infants born to women with PreE than in those born to normotensive controls (P < 0.01), despite similar values at 1 minute. More than half (59%) of PreE newborns were delivered by cesarean section compared with only 12% of normotensive newborns (P < 0.05; Table 1).
Effect of altitude on maternal Epo and sEpoR across pregnancy
Epo level increased with pregnancy for each altitude [Fig. 1(A)]. Epo level was equivalent between altitudes in the nonpregnant state, but values were greater among HA women during pregnancy (2.6- and 2.4-fold greater at 20 and 36 weeks, respectively, with a significant interaction between pregnancy and altitude, P = 0.001). Specifically, Epo level rose more sharply and to a greater extent at HA than at SL [Fig. 1(A)]. sEpoR values were consistent across pregnancy at SL and HA and did not differ between altitudes at any point [Fig. 1(B)].
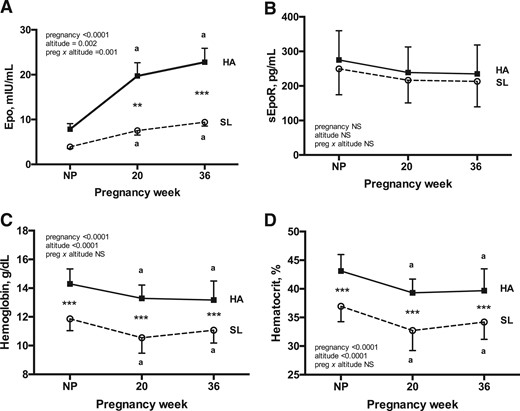
Maternal Epo, sEpoR, and indices of hemodilution during pregnancy at HA and SL. Repeated-measures 2-way ANOVA with Sidak corrections for multiple comparisons was used to contrast Epo, sEpoR, Hb, and Hct levels across pregnancy between Andean women residing at HA (n = 28) vs SL (n = 16). Complete Epo, sEpoR, Hb, and Hct data were available for each subject at every study point. (A) Pregnancy increased circulating Epo levels at HA but not at SL, with the result that Epo was greater at HA than at SL at 20 and 36 weeks. (B) sEpoR level did not change across pregnancy at either altitude, and values were equivalent between altitudes at each point of study. (C and D) Despite substantially higher Epo levels during pregnancy at HA, the magnitudes of pregnancy-associated falls in Hb and Hct levels were similar at both altitudes. As expected, Hb and Hct values were greater at HA than at SL at all times. Superscript a indicates significant differences relative to the nonpregnant state. Significant differences between altitudes are noted by ** (P < 0.01) or *** (P < 0.001). Data are shown as mean ± SD.
As expected, Hb and Hct values were greater at HA than at SL at all times [Fig. 1(C) and Fig. 1(D)]). Notably, however, the magnitude by which pregnancy lowered Hb and Hct values was equivalent between altitudes (7% to 9% drop by 36 weeks) despite vastly different Epo profiles. Given this observation, we subsequently tested whether HA modified the relationship between Epo and Hb or Hct. At HA, Epo was negatively associated with Hb and Hct at all times; however, at SL, Epo was independent of Hb and Hct at 36 weeks and postpartum and tended to be positively associated with Hb and Hct at 20 weeks [Fig. 2 (A–C)]. As a result, the relationship between Epo and Hct differed between altitudes, with an inverse relationship being present at HA at all time points but either absent [nonpregnant and week 36; Fig. 2(A) and Fig. 2(C)] or opposite in direction [week 20; Fig. 2(B)] at SL. In contrast, sEpoR was unrelated to Hb or Hct at either altitude, with the exception of the nonpregnant state at HA (Hb: r = −0.33, P = 0.04; Hct: r = −0.38, P = 0.02).
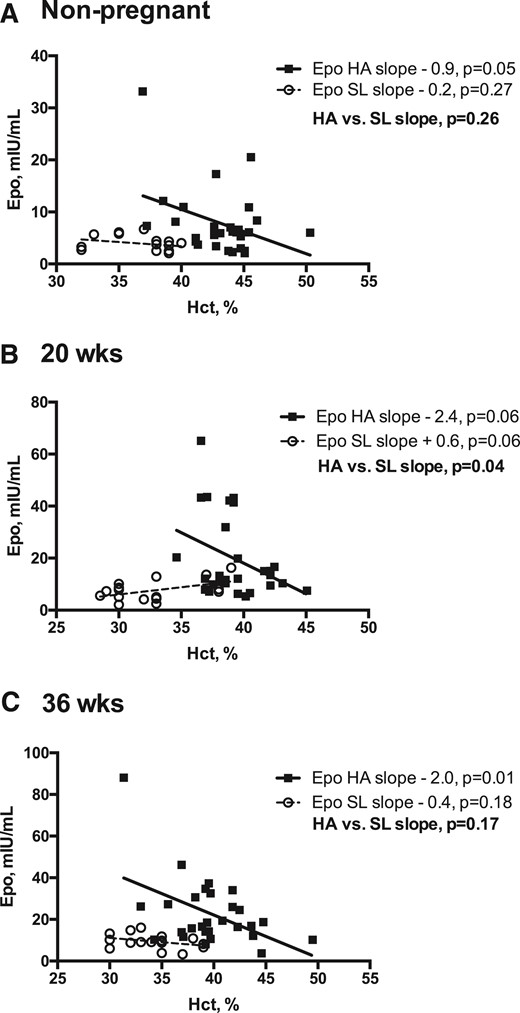
Relationship between Epo and Hct at HA vs SL in the nonpregnant state and during pregnancy. Linear regression models were used to test whether the relationship (slope) between Epo and Hct differed between Andean women residing at HA vs SL in the nonpregnant, postpartum period or during pregnancy (20 or 36 weeks). Complete Epo and Hct data were available for HA (n = 28) and SL (n = 16) women at all study points. Regression lines and individual data points for HA (solid lines, solid squares) and SL (dashed lines, open circles) are shown. (A) At SL, Epo and Hct levels were unrelated in the nonpregnant state; in contrast, nonpregnant Epo and Hct values were inversely associated at HA. (B) At 20 weeks, the relationship between Epo and Hct values was significantly different between the two altitudes, as indicated by the HA-SL slope contrast (P = 0.04). Specifically, at 20 weeks, Epo and Hct values were inversely related at HA and were positively associated at SL. (C) At 36 weeks, the relationship between Epo and Hct was similar to that of the nonpregnant state, with an inverse association apparent at HA and no association at SL.
Relationship of BV and Epo during HA pregnancy
Total BV, expressed as either an absolute value or per kilogram, rose across normotensive pregnancy compared with the nonpregnant state because of a 28% expansion of total PV by 36 weeks and a lesser but statistically significant 17% increase in total RCM across the same time frame [Fig. 3(A-C)]. Epo value was not associated with PV or RCM in the nonpregnant state but, as expected, was positively associated with PV (mL/kg) during pregnancy (20 weeks: r = 0.33, P = 0.04; 36 weeks: r = 0.35, P = 0.04) and was inversely related to RCM (mL/kg) at 36 weeks (r = −0.39, P = 0.02).
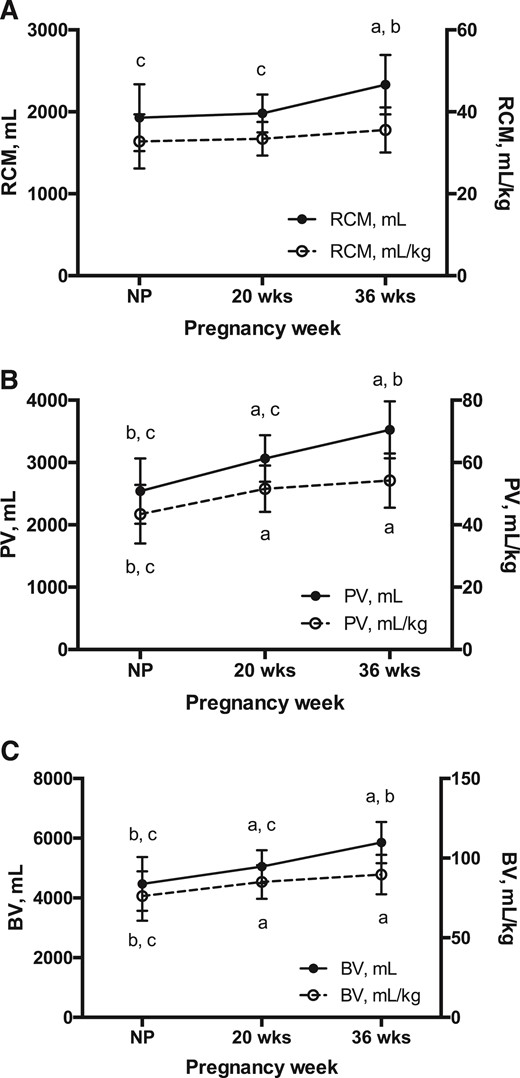
RCM, PV, and BV across HA pregnancy. Repeated-measures ANOVA was used to test the effect of pregnancy on hematological parameters in HA Andean women (n = 28 for all study points). (A) Total RCM increased ∼17% by 36 weeks of pregnancy (P < 0.0001); however, when expressed as a function of maternal weight, RCM was consistent across time. (B) PV (mL and mL/kg) expanded consistently across pregnancy, with values ∼28% and ∼20% higher at 36 weeks and at the nonpregnant state, respectively (P < 0.0001 for both). (C) As a result, BV (mL and mL/kg) increased progressively with pregnancy, rising ∼24% and ∼20% by 36 weeks, respectively (P < 0.001 for both). Notably, maximal expansion of RCM, PV, and BV expressed as mL/kg was achieved by 20 weeks. Superscripts indicate a significant difference relative to anonpregnant, b20-week, and c36-week values. Data are shown as mean ± SD.
Effect of PreE on maternal Epo and sEpoR levels
Compared with normotensive controls, women with PreE had higher sEpoR values (72.2 ± 40.1 vs 322.7 ± 401.8, respectively; P = 0.02) [Fig. 4(A)]. In contrast, Epo values were similar between women with PreE and controls, and Hb levels tended to be lower (P = NS and P = 0.06, respectively) [Fig. 4(B)].
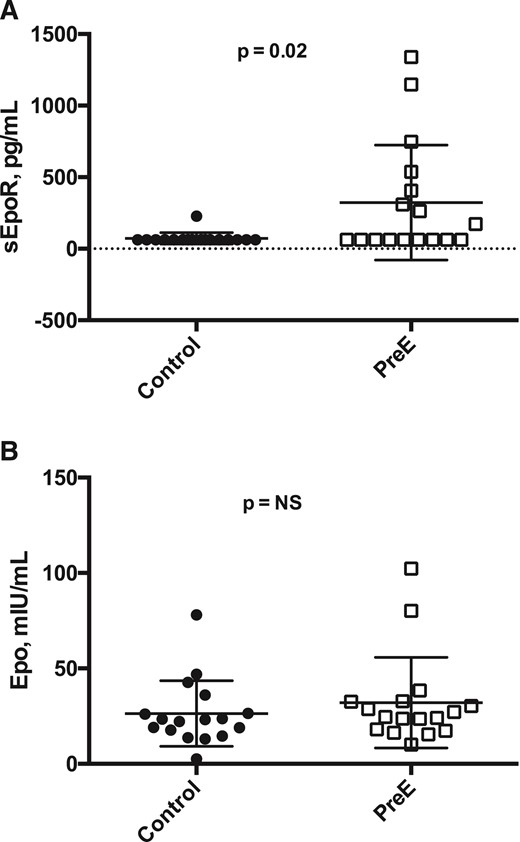
Epo, sEpoR, and Hb levels in PreE vs normotensive pregnancies among Andean residents at HA. Paired t tests were used to contrast Epo, sEpoR, and Hb values with Bonferroni multiple testing correction. PreE cases (open squares) and normotensive controls (solid circles) were gestational-age matched (n = 17, each group). (A) Maternal Epo levels were equivalent between normotensive controls and PreE cases (26.4 ± 17.2 and 32.1 ± 23.7 mIU/mL, respectively). (B) In contrast, compared with controls, women with PreE had greater sEpoR values (72.2 ± 40.1 vs 322.7 ± 401.8 pg/mL, respectively; P = 0.02), a statistically significant difference after Bonferroni correction.
Discussion
Our findings demonstrate that environmental hypoxia increased the pregnancy-associated rise in Epo level despite a similar reduction in Hb levels across pregnancy at each altitude. Maternal sEpoR levels, on the other hand, were unaffected by HA during normotensive pregnancy or in the nonpregnant, postpartum state. Compared with normotensive women at HA, PreE cases had similar Epo levels but higher sEpoR values, which may have reduced Epo bioavailability and thereby impaired Epo-mediated responses necessary for vascular adaptation to pregnancy. In vitro studies indicating that recombinant sEpoR inhibits Epo-mediated STAT-5 phosphorylation in murine interleukin-3-dependent pro-B-cell line/EpoR cells support this possibility (22).
Extensive hematological and ventilatory adaptations during pregnancy serve to maintain maternal arterial oxygen content and, in turn, support maternal and fetal metabolism (6). Such adaptations include a pronounced expansion of PV and a smaller yet notable increase in RCM that is paralleled by rising maternal Epo level. This pregnancy-associated rise in Epo reflects augmented production rather than reduced clearance (26). Consistent with the existing literature, our data indicate that maternal Epo level increases approximately twofold across normotensive SL pregnancy (27). Notably, however, among normotensive women the Epo level was twofold greater at HA than at SL at 20 and 36 weeks despite similarity in the nonpregnant, postpartum state. Our findings in this prospective comparison of Epo across pregnancy at HA and SL agree with those of a cross-sectional study indicating higher maternal Epo levels at HA relative to SL at the time of delivery (28).
The source of the elevated basal maternal Epo levels during uncomplicated pregnancy at HA vs SL is unknown but is likely placental in origin. First, Epo produced by fetal tissues, primarily hepatocytes, does not cross the placental barrier (29) and therefore cannot be responsible for rising maternal Epo levels during gestation. Second, because renal blood flow and oxygenation rise during uncomplicated pregnancy and are preserved during acute exposure to mild or moderate hypoxia (30–32), it is unlikely that hypoxia-induced renal Epo production accounts for the elevated Epo levels we observed at HA. Third, as previously reported, maternal Hb level was consistently greater during HA pregnancy than during SL pregnancy (33) but dropped similarly at each altitude across gestation; this suggests that PV expansion was also similar between altitudes. Thus, excessive hemodilutional anemia does not appear to trigger the elevated Epo production at HA vs at SL during pregnancy. Finally, placental Epo production is highly sensitive to maternal oxygenation, as indicated by the effect of maternal hypoxia raising the estimated umbilical Epo secretion rate of 27,900 mU/min in an in vivo ovine model (34).
We speculate that the nonhematopoietic actions of Epo, including enhanced activation of endothelial nitric oxide synthase and endothelium-dependent vasodilation, stimulation of angiogenesis, and induction of placental growth factor (14, 15, 17–19, 35), support the preservation of placental and maternal vascular adaptations that are essential for successful pregnancy under conditions of chronic hypoxia. Using this logic, we would expect elevated sEpoR levels, such as those we observed in PreE patients vs normotensive controls at HA, to impair Epo-mediated vascular responses. On the other hand, excessive placental Epo may be maladaptive, for example, by preventing the extensive vascular cell apoptosis and extracellular matrix decomposition that are essential for complete remodeling of the spiral arteries (20). In line with this possibility, some reports indicate that maternal Epo level is elevated in cases of abnormal placentation or PreE (36, 37), a putatively compensatory response to impaired placental and renal perfusion. In support of a causal relationship, however, the therapeutic use of recombinant human Epo (rhEpo) for renal anemia during pregnancy evokes systemic arterial hypertension (38). Moreover, rhEpo treatment induced vasoconstriction of isolated human placental vessels in vitro, suggesting that Epo participates in the vasoregulation of the placental vascular bed in ways that are most likely of pathophysiological importance for PreE (39). Therefore, we cannot exclude the possibility that the enhanced pregnancy-associated rise in Epo level observed at HA contributed to the modest impairment of vascular adaptation characteristic of uncomplicated HA pregnancy or the increased incidence of PreE or IUGR (24). However, we found that Epo values were equivalent in PreE and normotensive pregnancy, an observation that is similar to other reports [e.g., (40)] and does not suggest that elevated Epo levels are linked to PreE.
The literature strongly indicates a positive association between maternal Hb level, contracted PV, and pregnancy-induced hypertension at LA (41, 42). Our finding that Hb level was marginally lower in women with PreE compared with normotensive controls suggests that maternal Hb values within the range reported to be associated with minimal risk of stillbirth, prematurity, or small-for-gestational-age birth at HA (i.e., 11 to 13.6 g/dL) also do not influence the risk of PreE (33). One explanation for the modestly lower Hb levels we observed in PreE may be that the excessive inflammation dampens erythroid progenitor responsiveness to Epo and thereby impairs Epo-mediated erythropoiesis (43), as appears to be the case for anemia associated with chronic kidney disease and other inflammatory conditions (44, 45). Such effects may be due to the capacity of endogenous cytokines (e.g., interferon gamma, interleukin 6 [IL-6]) and T-cell activation to diminish erythroid progenitor responsiveness to Epo or to regulate sEpoR production. Khankin et al. (22) demonstrated a link between inflammation and Epo resistance, reporting increased sEpoR levels in human erythroleukemia cells stimulated with IL-6 and tumor necrosis factor α compared with untreated cells. Thus, the elevated sEpoR levels we observed in PreE may be stimulated by inflammatory cytokines. In support of this possibility, we previously showed that HA women with PreE had higher IL-6 and IL-8 values than normotensive controls (46). Moreover, elevated Epo levels in PreE have been unassociated with circulating erythroblasts, further suggesting that responsiveness to Epo is impaired in PreE (37). Finally, the elevated sEpoR levels we observed in PreE may impair Epo-mediated erythropoiesis and thereby reduce maternal Hb levels (22).
Our findings suggest that Epo and sEpoR play important roles in maternal vascular responses to pregnancy at HA. We speculate that the enhanced pregnancy-induced rise in Epo levels at HA serves to maintain uteroplacental blood flow during hypoxic pregnancy. We further propose that enhanced sEpoR levels may be of pathophysiological relevance for the onset of PreE and for the elevated PreE incidence at HA by impeding Epo-stimulated angiogenesis and vasodilation and maintenance of endothelial function. Further work utilizing more sensitive methods to detect circulating sEpoR levels and experimental animal studies, including rhEpo or Epo antagonist treatment, are needed to understand the effect of sEpoR on Epo bioavailability during pregnancy and its impact on pregnancy outcome. Such studies may improve early detection of vascular disorders during pregnancy or reveal novel therapeutic avenues for PreE.
Abbreviations:
- ANOVA
analysis of variance
- BP
blood pressure
- BV
blood volume
- CV
coefficient of variation
- ELISA
enzyme-linked immunosorbent assay
- Epo
erythropoietin
- EpoR
erythropoietin receptor
- HA
high altitude
- Hb
hemoglobin
- Hct
hematocrit
- IUGR
intrauterine growth restriction
- LA
low altitude
- PreE
preeclampsia
- PV
plasma volume
- RCM
red cell mass
- rhEpo
recombinant human erythropoietin
- SD
standard deviation
- sEpoR
soluble erythropoietin receptor
- sFlt1
soluble fms-like tyrosine kinase 1
- SL
sea level
Acknowledgments
The authors acknowledge all the women who participated in this project. Their appreciation is also extended to the physicians and technical staff at the Bolivian Institute of High Altitude Biology and Clinica Siraní for their assistance with the conduct of this project.
This study received the US National Institutes of Health (NIH), Building Interdisciplinary Research Careers in Women's Health Grant 5 K12 HD057022-07 (to C.G.J.) and NIH-HL079647 (to L.G.M.). No funding source was involved in the design, conduct, and interpretation of data; in the writing of the report; or in the decision to submit this article for publication.
Disclosure Summary: The authors have nothing to disclose.
References
Burton GJ, Yung HW, Cindrova-Davies T, Charnock-Jones DS. Placental endoplasmic reticulum stress and oxidative stress in the pathophysiology of unexplained intrauterine growth restriction and early onset preeclampsia. Placenta. 2009;
Burge CM, Skinner SL. Determination of hemoglobin mass and blood volume with CO: evaluation and application of a method.
Author notes
Address all correspondence and requests for reprints to: Colleen G. Julian, PhD, Department of Medicine, University of Colorado Denver, 12700 E 19th Avenue, Mailstop 8611, 3rd Floor Research Complex 2, Aurora, Colorado 80045. E-mail: [email protected].
