


Abstract
Visceral adiposity plays a significant role in cardiovascular risk. PDE5 inhibitors (PDE5i) can improve cardiac function and insulin sensitivity in type 2 diabetes patients.
To investigate whether PDE5i affect visceral adipose tissue (VAT), specifically epicardial fat (epicardial adipose tissue [EAT]), and what mechanism is involved, using microarray-based profiling of pharmacologically modulated microRNA (miRNAs).
Randomized, double-blind, placebo-controlled study in type 2 diabetes.
A total of 59 diabetic patients were randomized to receive 100-mg/d sildenafil or placebo for 12 weeks. Fat biopsies were collected in a subgroup of patients. In a parallel protocol, db/db mice were randomized to 12 weeks of sildenafil or vehicle, and VAT was collected.
Anthropometric and metabolic parameters, EAT quantification through cardiac magnetic resonance imaging, array of 2005 circulating miRNAs, quantitative PCR, and flow cytometry of VAT.
Compared with placebo, sildenafil reduced waist circumference (P = .024) and EAT (P = .045). Microarray analysis identified some miRNAs differentially regulated by sildenafil, including down-regulation of miR-22-3p, confirmed by real-time quantitative PCR (P < .001). Sildenafil's modulation of miR-22-3p expression was confirmed in vitro in HL1 cardiomyocytes. Up-regulation of SIRT1, a known target of miR-22-3p, was found in both serum and sc fat in sildenafil-treated subjects. Compared with vehicle, 12-week sildenafil treatment down-regulated miR-22-3p and up-regulated Sirtuin1 (SIRT1) gene expression in VAT from db/db mice, shifting adipose tissue cell composition toward a less inflamed profile.
Treatment with PDE5i in humans and murine models of diabetes improves VAT, targeting SIRT1 through a modulation of miR-22-3p expression.
Visceral adipose tissue (VAT) secretes adipocytokines and other vasoactive substances that favor the development of metabolic disorders (1). Targeting the expansion of VAT, or its release of inflammatory cytokines, could become a therapeutic strategy to prevent metabolic derangement. Epicardial adipose tissue (EAT) is located between the outer myocardial wall and the visceral layer of the pericardium and directly within the myocardium or around the coronary artery adventitia. The contiguity with the adventitia and the absence of muscle fascia suggest that paracrine or vasocrine cross talk between the EAT and the myocardium occurs. EAT has metabolic, thermogenic and mechanical functions within the heart. It can be visualized and measured with high-quality noninvasive imaging techniques, such as cardiac magnetic resonance (CMR). EAT thickness and volume are correlated with the size and detrimental features of abdominal visceral fat deposits (2), coronary artery disease (3), subclinical atherosclerosis (4), and insulin resistance (5). Remarkably, increased EAT thickness as assessed by CMR is an independent risk factor for significant coronary artery stenosis in asymptomatic type 2 diabetes (T2DM) patients (6).
Phosphodiesterase type 5 (PDE5) inhibitors (PDE5is) are selective blockers of the cGMP hydrolyzing enzyme, whose expression is increased in cardiac hypertrophy. In T2DM patients, chronic PDE5 inhibition counteracts cardiac remodeling (7) and improves ventricular function (8) and endothelial function (9, 10), and in mice, it mitigates M1-type macrophage tissue infiltration induced by hyperglycemia (11). It was recently proposed that the PDE5i sildenafil also improves insulin sensitivity (12) and metabolic control (10). However, the mechanisms involved are unclear. In vitro and in vivo animal models show that PDE5is may affect adipogenesis and ameliorate white AT quality, increasing glucose and triglyceride uptake (13), decreasing macrophage infiltration (14), and increasing thermogenesis (15, 16). These data seem to suggest that PDE5 is involved in AT function. However, there is a paucity of human studies and the clinical relevance or mechanisms involved remain underexplored.
The identification of novel microRNAs (miRNAs) pharmacologically modulated by sildenafil may help reveal the mechanism of action of PDE5is. To address these issues, we took advantage of the data from the randomized controlled Cardiovascular Effects of Chronic Sildenafil treatment in men with T2DM (CECSID) trial performed in T2DM patients chronically treated with sildenafil, in which metabolic characteristics, EAT, and circulating miRNAs were analyzed. Possible new targets were subsequently tested using in vitro models, tissue biopsies, and animal studies. Using a bedside-to-bench approach (17) with the advantage of a miRNA microarray screening strategy, we found converging human and murine evidence that sildenafil is a modulator of the miR-22/Sirtuin 1 (SIRT1) axis.
Materials and Methods
Subjects
Eligible men were recruited from the outpatient clinics of Policlinico Umberto I, Sapienza University Hospital as previously described (7). Briefly, the inclusion criteria were: 35–75 years of age, diagnosis of T2DM more than 2 years, hemoglobin A1c (HbA1c) less than 10%, blood pressure normal or adequately controlled to a target of less than or equal to 130/80 mm Hg, and body mass index (BMI) less than 40. The exclusion criteria were: use of exogenous insulin, thiazolidinediones, and spironolactone; PDE5i use; substance abuse; history of cardiovascular disease, proliferative retinopathy, and autonomic neuropathy; and symptoms or signs of ischemic heart disease during cardiac evaluations on enrollment. Concomitant medications could not be changed between the 3 months before the study and 1 month after its completion. All subjects gave their written informed consent. The hospital's ethics committee (Policlinico Umberto I) approved the protocol as registered with ClinicalTrials.gov (identifier NCT00692237). Additional ethics committee approval and independently signed consents were required for tissue analysis (protocol number 2684/215/11).
Study design
The CECSID trial was a randomized, double-blind (subjects/outcome assessors), placebo-controlled study in T2DM patients. All patients were randomized to receive 100-mg/d sildenafil (25 mg at 8 am plus 25 mg at 4 pm plus 50 mg at 10 pm) or placebo in identical-looking capsules for 12 weeks. Details of the study design have been reported previously (7) and are shown in Supplemental Figure 1.
Clinical and laboratory investigations
The following metabolic parameters were assessed at each visit: blood pressure, weight, BMI, and waist circumference (WC). Baseline and postprandial glycemia, insulin, homeostasis model assessment index (HOMAi), C-peptide, lipid profile, and HbA1c ELISA assays were performed to determine serum SIRT1 concentration (MyBioSource kit), as previously described (18), and serum adiponectin concentration (Life Technologies kit).
Magnetic resonance imaging for EAT measurement
All patients underwent CMR before and after therapy on a 1.5T MR Scanner (Avanto; Siemens) with a 16-element receiver coil. The CMR protocol included electrocardiogram-gated balanced steady state free precession cine Magnetic Resonance (cineMR) sequences acquired during breath-holding along the cardiac short axis, vertical and horizontal long axis. For the EAT measurement, a stack of 10–14 contiguous cineMR slices oriented in short axis view was acquired covering the whole pericardial sac. CineMR image dataset was analyzed by 2 blinded, independent, and experienced cardiac radiologists (N.G. and I.C.) using the Short 3D Function module of a dedicated CMR program (Cvi42 version 5.2.1; Circle Cardiovascular Imaging). For EAT quantification, epicardial and visceral pericardial contours were manually traced in on consecutive short-axis cineMR images at the end-diastolic phase as shown in Figure 1. To standardize the reproducibility of EAT measurements, the basal slice was selected at the level of the mitral valve, scanning toward the apex to end immediately below the ventricular apex. EAT volume was calculated by summing the area of EAT measured on each slice and multiplying by the slice thickness using a modified Simpson's rule, as previously validated (19). Intra- and interobserver variability was also assessed for the CMR EAT volume measurements.
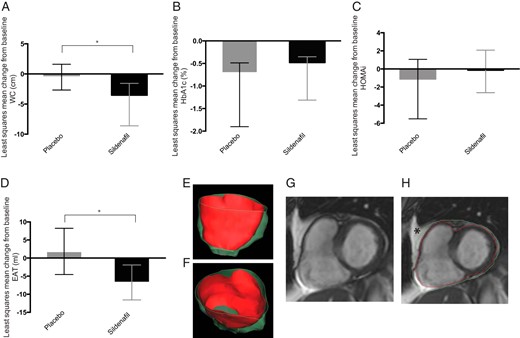
Metabolic and visceral fat changes in T2DM patients.
Histograms show the least squares mean change from baseline in WC (A), HbA1c (B), HOMAi (C), and EAT (D) in placebo (gray) and sildenafil-treated patients (black). Error bars represent upper and lower 95% CI; *, P < .05 between treatment difference. E and F, Three-dimensional volume rendering of epicardial fat distribution. G and H, Short-axis cine CMR image with epicardial (red line) and pericardial (green line) contours. Pericardial and mediastinal fat (6-pointed star), external to the parietal pericardial layer, were excluded.
Human sc fat biopsies
Subcutaneous AT samples of approximately 1–2 cm3 were obtained under local anesthesia at the baseline and before study completion (see Supplemental Materials and Methods for details).
Serum miRNA isolation and expression analysis of different human serum samples using Agilent human microRNA microarrays (1-color)
Serum was homogenized with TRIzol, and total RNA was purified. miRNA was then extracted by miRNA Isolation kit (QIAGEN). See Supplemental Materials and Methods for discriminatory gene analysis (DGA) of the different human serum samples using Agilent Human microRNA Microarrays (one-color).
MicroRNA quantification of circulating miR-22-3p by real-time quantitative PCR in human samples
SYBR-green real-time quantitative PCR was used to quantify miRNA in serum samples (see Supplemental Materials and Methods). The miRNA expression levels were normalized to miR-103. The relative change in miR-22-3p expression was calculated using the delta-deltaCT value.
SIRT1 levels by PCR in human fat biopsies
RNA was extracted using the RNeasy Lipid Tissue kit (QIAGEN UK) according to the manufacturer's instructions (see Supplemental Materials and Methods).
Animal model
Male BKS.Cg-Dock7m+/+LeprdbJ (db/db) mice, obtained from the Charles River Laboratory, were maintained in a pathogen-free facility. All experiments were performed in accordance with Italian law (D.L. 2010/63EU) and the study was approved by the Sapienza University's Animal Research Ethics Committee and by the Italian Ministry of Health. A total 18 db/db mice were used in the study. At 10 weeks of age, fasting blood glucose was determined in each mouse, and the mice were then divided into 2 groups (9 db/db + vehicle and 9 db/db + sildenafil). Sildenafil citrate (10 mg/kg, sildenafil, Viagra; Pfizer) was administered by oral gavage, 12 weeks. Body weight and food consumption were monitored in all animals. Appropriate vehicle was administrated to db/db + vehicle mice.
Tissue preparation and flow cytometry
For all experiments, VAT was obtained from the omental depot and processed for isolation of stroma-vascular fraction (20) and for flow cytometry as previously described (21). For details see Supplemental Materials and Methods.
MicroRNA quantification of miR-22-3p by real-time quantitative PCR in mice fat samples and HL1 cells
The reverse transcription reaction of 10-ng RNA extract was carried out with the TaqMan MicroRNA Reverse Transcription kit (Applied Biosystems) (see Supplemental Materials and Methods).
SIRT1 quantification by real-time quantitative PCR in mice fat samples
RNA was extracted from frozen mice fat samples using the RNeasy Lipid Tissue kit (QIAGEN UK) according to the manufacturer's instructions (see Supplemental Materials and Methods).
Cell culture and treatment
HL1 cells were kindly provided by Dr Claycomb and cultured in Claycomb medium (Sigma-Aldrich). After overnight starvation, cells were maintained for 24 hours in the presence of sildenafil (1 μmol) or vehicle.
Statistical analysis
All statistical analyses were carried out in accordance with a predetermined statistical analysis plan. In brief, efficacy was analyzed on an intention-to-treat approach that included all data from randomized patients who received at least 1 dose of study drug and was analyzed according to the treatment assigned in the randomization scheme based on the last observation carried forward when data from the 8-week visit onward were available. Change from baseline was the postbaseline value minus the baseline value. Normality of distribution for all interventions at all time points was assessed by Shapiro-Wilk's test (P > .05). Log transformation or reciprocal transformation was used to correct for skewed data and a mixed model analysis was used to assess differences in outcomes to accommodate the repeated measurements by incorporating patient as a random effect, the corresponding baseline value of the outcome as covariate and treatment, time, and treatment by time interaction as the fixed effects. The changes from baseline to week 12 were also analyzed with an analysis of covariance model that included baseline outcome as covariate and treatment as the fixed effect. The analysis of covariance model used the last observation carried forward principle. Additional covariates included in the analysis were age, BMI, and inflammatory status as measured by monocyte chemoattractant protein-1 (MCP-1). Continuous variables are reported as mean ± SD. Data are reported as mean with 95% confidence interval (CI) unless otherwise specified. A 2-sided P < .05 was regarded as significant. All analyses were performed using SPSS 18.0 (SPSS, Inc).
Results
Human T2DM trial
Subject characteristics at the baseline are shown in Table 1; study flow is reported in Supplemental Figure 1. Mixed-model repeated measure analysis showed a reduction in WC in the sildenafil-treated group. At week 12, the least squares mean change in WC was −3.53 cm (95% CI: −5.08 to −1.96) in the sildenafil group and −0.27 cm (95% CI: −2.41 to 1.87) in the placebo group. The least squares mean difference in waist change from baseline to week 12 between treatments was −3.26 cm (95% CI: −6.08 to −0.45, P = .024) (Figure 1A). No change was found in body weight or BMI. HbA1c improved in both the sildenafil (−0.48%; 95% CI: −0.86 to −0.95) and placebo (−0.65%; 95% CI: −1.10 to −0.11) groups, with no significant treatment-related difference (P = .616) (Figure 2B) as previously shown (7). No change was found in HOMAi (Figure 1C).
Circulating miRNA regulation in T2DM patients.
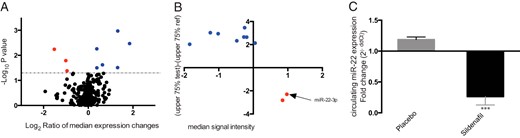
A, Volcano plot of microarray analysis, on y-axis −Log10P value (statistical difference in the variance between the sample groups), on x-axis the Log2 of median expression changes between groups. The black dots represent unregulated miRNAs, blue dots represent up-regulated miRNAs, and red dots represent down-regulated miRNAs. B, The plot shows the regulated miRNA by alternative selection. Y-axis, the median signal intensity of the reference group samples; x-axis, the value of the test samples representative of the upper 75th percentile of the range of intensities subtracted from the 75th percentile value of the reference group. The blue dots represent up-regulated miRNAs, and red dots represent the down-regulated miRNAs. C, Histograms show the relative quantification of miR-22-3p gene expression ± SD in both groups after treatment (placebo group, gray; sildenafil group, black). ***, P < .001.
Characteristics of the Subjects Included in the ITT Analysis
| Characteristic | Mean ± SD |
|---|---|
| Number of pts | 59 |
| Age, y | 60.46 ± 7.39 |
| Duration of T2DM, y | 6.50 ± 5.11 |
| BMI | 28.19 ± 4.35 |
| Weight, kg | 83.51 ± 14.61 |
| Waist, cm | 100.45 ± 11.64 |
| EAT, mL | 187.52 ± 75.66 |
| Glycaemia, mg/dL | 147.35 ± 40.83 |
| Insulin, μU/mL | 17.56 ± 12.31 |
| HOMAi | 6.73 ± 4.19 |
| HbA1c, % | 7.63 ± 1.37 |
| MCP-1, pg/mL | 379.68 ± 133.48 |
Values are expressed as mean ± SD or number. EAT measured by CMR imaging.
EAT was also affected by treatment when baseline MCP-1 and BMI were included as covariates in the model. In sildenafil-treated subjects, the mean change from baseline in EAT was −6.74 mL (95% CI: −11.58 to −1.91), and in the placebo group, it was 1.84 mL (95% CI: −4.56 to 8.24). Treatment-related least squares mean difference was −8.58 mL (95% CI: −16.97 to −0.19, P = .045) (Figure 1D).
Individual microarray analysis was performed on serum samples of all enrolled subjects, screening for differentially expressed circulating miRNAs from 2005 miRNAs in the human database. Sildenafil vs placebo posttreatment values relative to their pretreatment values, analysis was performed to identify any treatment-related changes. In the first step of the discriminatory miRNA analysis (DGA), statistical tests were carried out according to the commonly applied biostatistic approach for microarray data analysis, with 9 regulated miRNAs identified (3 down-regulated and 6 up-regulated) (Figure 2A). Given that intragroup heterogeneity heavily influenced P value, an alternative DGA strategy was applied to identify putative candidate miRNAs among those with a consistent expression trend, significant fold change, and detectability in most samples (see Supplemental Materials and Methods). With this method, 10 other miRNAs (2 down-regulated and 8 up-regulated) (Figure 2B) were selected as differentially expressed in the 2 groups. Among the regulated genes, we focused on miR-22-3p, that was markedly down-regulated in the T2DM patients treated with sildenafil compared with placebo (Figure 2C). miR-22-3p selective regulation was confirmed by qRT-PCR (1.18 ± 0.04 vs 0.26 ± 0.13, P < .001). Delta-Ct values of miR-22-3p expression correlated with EAT changes from baseline (P = .047, r = 0.68).
Previous studies suggested that miR-22-3p targets SIRT1 directly (22). To test whether the observed down-regulation of miR-22-3p was associated with an up-regulation of its target, we measured circulating SIRT1. This was increased in the sildenafil-treated group but not in the placebo group, with the mean change from baseline, respectively, 1.53 ng/mL (95% CI: 0.60 to 2.45) and −0.34 ng/mL (95% CI: −1.58 to 0.89). The least squares mean difference between the 2 treatments was 1.87 ng/mL (95% CI: 0.32 to 3.42, P = .022) (Figure 3A).
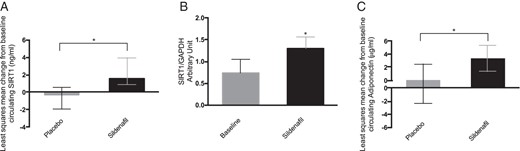
Circulating and sc fat SIRT1 changes in T2DM patients.
A, Least squares mean change from baseline of circulating SIRT1 in placebo (gray)- and sildenafil (black)-treated patients. Error bars represent upper and lower 95% CI. *, P < .05 between treatment difference. B, Histograms show the relative quantification of SIRT1/GAPDH gene expression in sc AT before and after treatment (baseline, gray; sildenafil, black). Results are expressed as mean ± SD. *, P < .05. C, Least squares mean change from baseline of circulating adiponectin in placebo (gray)- and sildenafil (black)-treated patients. Error bars represent upper and lower 95% CI. *, P < .05 between treatment difference.
Seven patients volunteered to undergo sc fat biopsy before and after the double-blinded treatment period. On unblinding, we found that 5 had been treated with PDE5i and 2 with placebo. Due to mRNA degradation, 2 samples (1 in each group) were lost. For this reason, SIRT1 fat expression could only be quantified in PDE5i-treated subjects (n = 4). In AT biopsies, SIRT1 mRNA levels were up-regulated by sildenafil (0.73 ± 0.30 vs 1.3 ± 0.25, P = .031) (Figure 3B), confirming that the changes in SIRT1 mRNA in human AT accurately reflected alterations in SIRT1 protein release. Circulating levels of serum adiponectin, a known target of SIRT1, were also measured. An increase in adiponectin concentration was found in PDE5i-treated subjects (mean change from baseline 3.39 μg/mL, 95% CI: 1.39 to 5.39) compared with placebo (mean change from baseline 0.08 μg/mL, 95% CI: −2.28 to 2.44). The least squares mean difference between treatments was 3.31 μg/mL (95% CI: 0.22 to 6.40, P = .038) (Figure 3C).
db/db mice trial
The db/db mice model was used to investigate the effects of sildenafil on VAT. Compared with vehicle, 12 weeks of sildenafil produced a significant difference in body weight: mean changes from baseline were −8.28 g (95% CI: −14.84 to −1.72) and 4.87 g (95% CI: −1.21 to 10.96), respectively, in the sildenafil- and vehicle-treated db/db mice. The least squares mean difference between treatments was −13.16 (95% CI: −22.56 to 3.75, P = .010) (Figure 4, A and B). Sildenafil failed to improve blood glucose levels (least squares mean difference between treatments 3.84 (95% CI: −8.52 to 16.21, P = .518). Analysis of omental VAT samples confirmed a sildenafil-related down-regulation of miR-22-3p (db/db + vehicle: 1.00 ± 0.01 vs. db/db + sildenafil: 0.40 ± 0.10, P < .001) (Figure 4C) and an opposite up-regulation of SIRT1 in VAT (db/db + vehicle: 1.00 ± 0.21 vs db/db + sildenafil: 2.08 ± 0.38, P < .001) (Figure 4D).
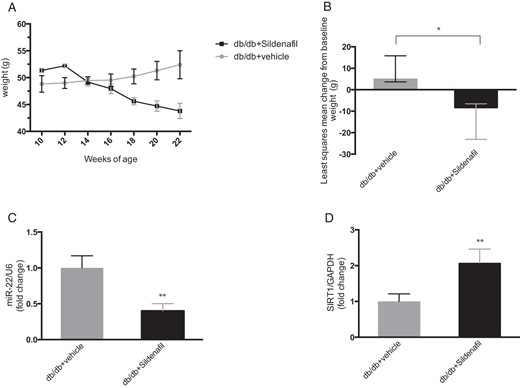
Weight, VAT miR-22, and SIRT1 changes in db/db mice.
A, The plot represents mean ± SE of biweekly body weight monitoring from 10 to 22 weeks of age (db/db + vehicle, gray line; db/db + sildenafil, black line). B, Least squares mean change from baseline of weight in vehicle (gray)- or sildenafil (black)-treated mice. Error bars represent upper and lower 95% CI; *, P < .05 between treatment difference. C, Histograms represent relative quantification of miR-22/U6 by qPCR in VAT (db/db + vehicle, gray; db/db + sildenafil, black). Results are expressed as mean ± SD. **, P < .01. D, Histograms represent quantification of SIRT1/GAPDH by qPCR in VAT of vehicle-treated (gray) or sildenafil-treated (black) mice. Results are expressed as mean ± SD. **, P < .01.
To investigate whether PDE5i regulation of SIRT1 expression altered the composition of VAT in db/db mice, we analyzed the cellular composition of the stromavascular VAT depot by flow cytometry analysis. There was a relative increase in M2 macrophages, identified as percentage of Mrc1+ among F4/80+ cells (db/db + vehicle: 21.66 ± 6.66 vs db/db + sildenafil 33.80 ± 8.14, P = .033) (Figure 5, A and B), in endothelial cells (ECs), identified as percentage of CD31+CD45− cells (db/db + vehicle: 1.32 ± 0.59 vs db/db + sildenafil 2.76 ± 0.33, P = .032) (Figure 5, C and D), and in adipocyte progenitor (AP) cells, identified as percentage of Sca1+ among CD45−CD31− cells (db/db + vehicle: 4.21 ± 0.83 vs db/db + sildenafil 6.05 ± 1.20, P = .026), in sildenafil-treated animals (Figure 5, E and F). These results are consistent with an improvement in VAT quality.
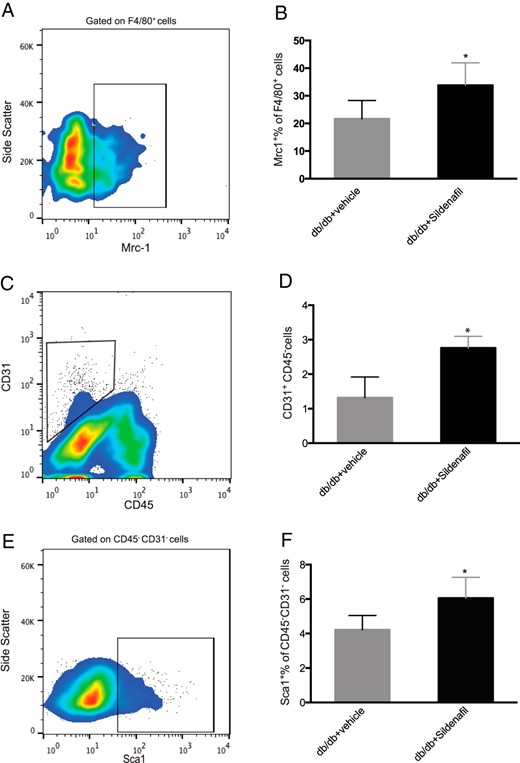
Quantification of M2 macrophages, ECs, and AP cells in stromavascular fraction of VAT in db/db mice after sildenafil treatment.
A, The FACS plot shows representative gating of Mrc1+ cells, previously gated on F4/80+ cells. B, Histograms represent quantification of the percentage of Mrc1+ F4/80+ cells, in vehicle-treated (gray) or sildenafil-treated (black) mice. C, The plot shows representative gating of CD31+ CD45− cells. D, Histograms represent quantification of CD31+CD45− ECs, in vehicle-treated (gray) and sildenafil-treated (black) mice. E, The plot shows representative gating of Sca1+ cells on CD31− CD45− cells. F, Histograms represent percentage of SCA1+CD45−CD31− AP cells, in vehicle-treated (gray) or sildenafil-treated (black) mice. Results are expressed as mean ± SD. *, P < .05.
In vitro regulation of miR-22-3p by sildenafil
To demonstrate that mir-22-3p is down-regulated by sildenafil, we further tested its effect on HL1 cells, a murine cardiac muscle cell line with phenotypic characteristics of the adult cardiomyocytes and well known for mir-22-3p expression (23). Sildenafil also down-regulated mir-22-3p in this in vitro model (P = .040) (Supplemental Figure 2).
Discussion
In the present study, we provide converging clinical, in vivo and in vitro experimental data showing that PDE5 inhibition in diabetes modulates miR-22-3p and SIRT1, ameliorating AT remodeling.
Evidence from previous studies in mice suggests that PDE5is: reduce VAT macrophage infiltration, inflammation (14), and weight and increase energy expenditure, insulin sensitivity (16), and adipocyte browning (15, 24).
In the first randomized controlled trial addressing the effect of chronic sildenafil on the cardiovascular function of T2DM patients (7) we found a treatment-related change in WC. WC is a surrogate marker of abdominal fat mass and is more closely correlated with cardiometabolic risk than BMI (25). However, WC does not distinguish sc fat from VAT, and the lack of change in BMI in our cohort suggests that the observed effect could be the result of AT remodeling. For this reason, we analyzed EAT measured by CMR according to a previously validated method. EAT produces proinflammatory and atherogenic cytokines such as MCP-1, IL-1β, IL-6, and TNF, which are secreted in the proximity of the myocardium and the coronary artery bloodstream (26), sustaining pathological remodeling. After weight loss interventions, EAT thickness decreases more rapidly than other indices of body fatness, suggesting that this VAT deposit is more dynamic and potentially relevant to disease (27). Its reliable quantification by CMR or ultrasound and its fast metabolic response both render EAT an excellent biomarker of the efficacy of treatments targeting AT and cardiometabolic risk (5). To the best of our knowledge, no other studies have investigated EAT modification after chronic PDE5i treatment. We found a reduction in EAT after sildenafil treatment in T2DM patients when systemic inflammatory markers such as MCP-1 were included in the model. This is consistent with the knowledge that T2DM patients suffer from chronic low-grade inflammation and points toward a bidirectional link between PDE5i remodeling and VAT inflammation (11).
The discovery of miRNAs added an entirely new layer of complexity to our understanding of how genes are regulated. The evaluation of miRNAs differentially expressed in diabetic patients after PDE5i is a noninvasive procedure to identify in vivo possible downstream components involved in tissue protection. In T2DM humans, we discovered a specific sildenafil-related modulation of circulating miR-22-3p. miR-22 has been implicated in heart adaptation to pressure overload and is a critical regulator of stress-induced cardiac hypertrophy and remodeling (22), and its attenuation counteracts hypertrophy in cultured cardiomyocytes (28). In vitro, we demonstrated that sildenafil down-regulated miR-22-3p in murine cardiomyocytes. The modulatory effects of sildenafil on miR-22-3p could account for its cardioprotective effects in animal (11) and human models of cardiac hypertrophy (29), consistently with the findings of the CECSID trial (7). miR-22 regulates Peroxisome Proliferator Activated Receptor gamma, Peroxisome Proliferator Activated Receptor gamma Coactivator 1 (30), and SIRT1 (22, 28), 3 master transcriptional factors/cofactors controlling fatty acid metabolism. SIRT1, a Nicotinamide Adenine Dinucleotide+-dependent histone deacetylase, is an important coordinator of the mammalian metabolic response to fasting, regulates fatty acid metabolism, and promotes lipid mobilization in adipocytes, inhibiting Peroxisome Proliferator Activated Receptor gamma (31), and has been implicated in the development of obesity-related diseases (32). SIRT1 is suppressed in high-fat diet and genetically obese rodents (33), and its activators or mild overexpression reduce insulin resistance (34). In humans, SIRT1 transcript levels are inversely correlated with BMI, weight, HOMAi (35) and AT macrophage content (36). In the present study, SIRT1 was up-regulated in both serum and sc AT of T2DM patients treated with PDE5i. Our human data are in line with previous murine studies of an association between PDE5/nitric oxide (NO)/cGMP axis and SIRT1. Kukreja and coworkers found that chronic PDE5i activates NO-induced SIRT1-PGC1α signaling, attenuating mitochondrial dysfunction in the heart of db/db mice (37) and protecting against myocardial ischemia/reperfusion injury (38). Interestingly, SIRT1 protein levels in white adipocytes are blunted in endothelial nitric oxide synthase-deficient mice (39), suggesting NO dependency but also a greater response to PDE5i in diabetes, where NO production is defective. In this study, we also provided in vivo and in vitro evidence that SIRT1 modulation might be mediated by PDE5i/miR-22-3p regulation.
SIRT1 has been identified as a key regulatory component of macrophage influx into AT during overnutrition in rodents and humans (35). In SIRT1 null mice, a significant reduction in adipocyte function was observed, associated with angiogenic deficiency and macrophage malfunction (40). In VAT of diabetic mice, we observed a sildenafil-stimulated increase in M2 macrophages and EC frequency, as well as in AP, ameliorating AT quality. In line with these findings, a recent study on high-fat diet rabbit model demonstrated that the PDE5i tadalafil counteracted VAT alterations, prompting preadipocyte differentiation (24). Our data support that PDE5is improve metabolic function (10, 12) by limiting AT inflammation and promoting healthier fat deposits. Although SIRT1 could mediate the observed effects on macrophage recruitment and EC in VAT, the increase in AP might be indirectly related to the modification of the extracellular environment, because adipogenesis is closely associated with angiogenesis. It is worth noting that SIRT1 null mice display both reduced adipogenesis and angiogenic deficiency (40). Our findings of a coordinate increase in SIRT1 and EC frequency could also be explained by reciprocal regulation, because SIRT1 is highly expressed in EC and is required for EC proliferation.
We provided several pieces of evidence that sildenafil directly regulates miR-22-3p and that SIRT1 is conversely up-regulated; however, we cannot exclude the possibility that additional miR-22-3p targets might explain the observed findings on AP cells (41). Our data reveal a strong association between AT remodeling and modulation of miR-22-3p/SIRT1, but a wide-spectrum search for the mechanisms involved to explain such findings is needed. This study offers the advantage of converging evidence from a randomized controlled trial, microarray analysis, CMR EAT measurement, and in vivo and in vitro confirmatory murine data of a novel identified molecular pathway regulated by PDE5i. However, it also has some limitations. First, human visceral fat biopsies were not available. Second, although we demonstrated that sildenafil regulates miR-22-3p expression in cardiomyocytes and this could well account for the observed change in the surrounding EAT, it is unclear whether the cardiac source of miR-22-3p is responsible for the change in peripheral blood miR-22-3p levels. Third, we did not find any changes in insulin sensitivity; however, this was not an outcome of the study and its estimate by HOMAi is not adequate to draw conclusions; similarly, the relatively short treatment period (3 mo) could explain the lack of treatment-related difference in HbA1c. Finally, we cannot demonstrate how sildenafil modulates regulatory elements for miR-22-3p gene expression.
In conclusion, these findings reveal novel therapeutic implications for the regulation of SIRT1 in AT to promote healthier fat deposits, to modulate miR-22-3p expression and to reduce EAT in patients with T2DM. Future work is awaited to provide more information on the causal link leading to elevation of SIRT1 after miR-22-3p down-regulation in diabetic patients after chronic PDE5i treatment. Long-term studies will address whether the observed changes can effectively reduce end-organ complications associated with dysfunctional adipogenesis and low-grade inflammation of diabetes.
Acknowledgments
We thank Dr Stefano Veneroso from “Sanatrix” plastic surgery hospital of Rome for his kind assistance in performing adipose tissue biopsies.
This work was supported by the Italian Ministry of Instruction, University and Research (MIUR) Grant FIRB RBFR10URHP.
Disclosure Summary: A.M.I. has been an occasional consultant for Otsuka, Shire, Novartis, and Menarini. All other authors have nothing to disclose.
D.F. and D.G. contributed equally to this work.
Abbreviations
- BMI
body mass index
- CECSID
Cardiovascular Effects of Chronic Sildenafil treatment in men with type 2 Diabetes
- CI
confidence interval
- cineMR
cine Magnetic Resonance
- CMR
cardiac magnetic resonance
- DGA
discriminatory gene analysis
- EAT
epicardial adipose tissue
- HbA1c
hemoglobin A1c
- HOMAi
homeostasis model assessment index
- MCP-1
monocyte chemoattractant protein-1
- miRNA
microRNA
- NO
nitric oxide
- PCR
polymerase chain reaction
- PDE5
phosphodiesterase type 5
- PDE5i
PDE5 inhibitor
- SIRT1
Sirtuin 1
- T2DM
type 2 diabetes
- VAT
visceral adipose tissue
- WC
waist circumference;
