


Recent evidence from animal studies indicates that fibroblast growth factor 21 (FGF21), an endocrine hormone that regulates glucose, lipid metabolism, and energy homeostasis, is regulated by T3. However, the role of FGF21 in hyperthyroid patients is unknown.
The objective was to study serum FGF21 levels in hyperthyroid patients and the association of serum FGF21 levels with hyperthyroidism.
This was a case-control study.
A total of 119 hyperthyroid patients and 108 healthy subjects were recruited. Of them, 41 hyperthyroid patients received thionamide treatment for 3 months until euthyroidism was obtained.
Serum FGF21 levels were determined using the ELISA method.
Serum FGF21 levels were significantly elevated in hyperthyroid patients as compared with normal subjects [median 290.67 (interquartile range, 156.60–502.33) vs 228.10 (169.85.25–320.10) pg/mL; P < .001]. After thionamide treatment, serum FGF21 levels in hyperthyroid patients declined markedly from 249.10 (139.10–444.00) to 106.90 (38.70–196.15) pg/mL (P < .001). Logistic regression revealed that FGF21, basal metabolic rate, low-density lipoprotein cholesterol, and alanine transaminase were significantly associated with hyperthyroidism. With adjustment for potential confounders, serum FGF21 remained independently associated with hyperthyroidism, with an adjusted odds ratio of 3.123 (95% confidence interval, 1.306–7.468) (P = .010).
Serum FGF21 levels were elevated in patients with hyperthyroidism and declined after thionamide treatment. And serum FGF21 level was independently associated with hyperthyroidism.
Thyroid hormone (TH) is a critical hormone responsible for growth, development, and metabolism. It maintains basal metabolic rate (BMR), improves adaptive thermogenesis, and thus modulates body weight by fine-tuning energy expenditure and intake. Hyperthyroidism, a condition with excess TH, presents a status of negative energy balance that is characterized by weight loss, increased energy expenditure, and accelerated lipolysis and gluconeogenesis (1). The mechanism underlying hypermetabolic status in hyperthyroidism is complicated. In hyperthyroidism, excess TH promotes the metabolism rate primarily by binding to TH receptor α or β, and in turn by further influencing diverse metabolic pathways. Recent studies have revealed that TH signals were involved in cross talk with a range of other metabolic signaling pathways in different metabolic organs. In liver, TH interacts with peroxisome proliferator-activated receptor (PPAR) α, PPARγ, and liver X receptor α pathway; promotes fatty acid oxidation; decreases cholesterol; and enhances gluconeogenesis (2, 3). The elements required for TH action are well documented, but understanding the interaction between TH and various pathways remains a challenge.
Fibroblast growth factor 21 (FGF21), a member of the FGF19 superfamily, acts in an endocrine manner to regulate energy expenditure and glucose and lipid metabolism (4). FGF21 promotes fatty acid oxidation, increases glucose uptake in peripheral tissues, and induces thermogenesis by inducing brown adipose tissue (BAT) (5). Systemic administration of FGF21 in rodents and primates led to an increase in energy expenditure, loss of body weight, and improvement in glucose and lipid metabolism (6, 7). It is well known that FGF21 is usually induced by fasting, as downstream of PPARα in liver. Recently, some animal studies showed that FGF21 could also be up-regulated by T3 and thyroid receptor α (8–10). Acute and chronic treatment with T3 could specifically induce hepatic FGF21 expression in a PPARα-dependent manner. On the other hand, peripheral FGF21 administration to mice reduced serum levels of TH, which indicated that TH and FGF21 showed mutual regulation in animal models (9). Accordingly, the PPAR-FGF21 pathway may be involved in the action of TH. However, there is no evidence to date showing that TH is capable of regulating FGF21 expression in human beings. Our current study investigated the change of FGF21 levels in patients with hyperthyroidism before and after thionamide treatment and explored the association of serum FGF21 levels with hyperthyroidism.
Subjects and Methods
Subjects
A total of 119 patients with hyperthyroidism were recruited from the Department of Endocrinology and Diabetes, the First Affiliated Hospital of Xiamen University (Xiamen, China), from September, 2012, to March, 2014. All of the subjects were diagnosed with hyperthyroidism by typical clinical presentation, elevated serum TH, reduced TSH, and elevated serum TSH receptor antibody (TRAb) levels. A total of 108 healthy controls were recruited from interns and staff of the First Affiliated Hospital of Xiamen University from February to November, 2013. All hyperthyroid patients were drug-naive before recruitment. Forty-one hyperthyroid patients received thionamide treatment (35 were taking methimazole; six, propylthiouracil; and 37, propranolol) for 3 months, and euthyroidism was obtained. Blood samples were collected from 8 to 9 am after a 12-hour overnight fast, and serum was separated and stored at −20°C for FGF21 and biochemical assays. Subjects with the following conditions were excluded: diabetes, cancer, pregnancy, lactation, subacute thyroiditis, abnormal liver function (serum alanine transaminase [ALT], glutamic oxalacetic transaminase [AST] increased by 1.5-fold), abnormal kidney function (estimated glomerular filtration rate < 50 mL/min/1.73 m2), and infectious diseases. The study protocol was approved by the Human Research Ethical Committee of the First Affiliated Hospital of Xiamen University. Written informed consent was obtained from each participant.
Anthropometric and biochemical measurements
Waist circumference was measured at the midpoint between the inferior costal margin and the superior border of the iliac crest on the midaxillary line. Body mass index (BMI) was calculated as the weight in kilograms divided by the square of the height in meters. BMR was estimated by Gale's formula (pulse pressure difference + pulse rate − 111) (11). Homeostasis model of assessment for insulin sensitivity (HOMA-IR) was calculated as follows: fasting serum insulin (mU/mL) × fasting plasma glucose (FPG; mmol/L)/22.5. Serum biochemical measurements were determined on a Hitachi 7600 analyzer (Hitachi, Ltd). Plasma glucose was measured using the glucose oxidase method. Serum low-density lipoprotein cholesterol (LDL-c) was calculated by Friedewald's formula. Serum insulin, free T3, free T4, and TSH concentrations were measured using electrochemiluminescence immunoassay (Roche Diagnostics).
FGF21 measurement
Serum FGF21 concentrations were measured using ELISA kit (DF2100; R&D Systems, Inc) according to the manufacturer's instructions. This assay was verified to be highly specific to human FGF21 and not cross-reacted with other members of the FGF family. The detectable range of the assay was 17.0 to 2410.9 pg/mL. The intra- and interassay coefficients of variation were 5.3 and 6.7%, respectively.
Statistical analysis
All statistical analyses were performed using Statistical Package for Social Sciences version 21.0 (SPSS, Inc). Normally distributed data were presented as mean ± SD. Non-normally distributed data were logarithmically transformed. χ2 and one-way ANOVA tests were used for comparison of categorical and continuous variables, respectively. The Student's paired t test was used for comparison of the data before and after antithyroid treatment. Pearson's correlation analyses were used to examine the relationship between serum FGF21 levels and other parameters. Multivariable logistic regression was used to calculate the adjusted ORs and 95% CIs. P < .05 was considered statistically significant.
Results
Clinical characteristics of subjects
The clinical characteristics of study subjects are shown in Table 1. The age and sex are comparable between patients and controls. As expected, patients with hyperthyroidism had higher free T3, free T4, TRAb, thyroid peroxide antibody, and thyroglobulin antibody and lower TSH concentrations. Also, BMR, ALT, AST, and direct bilirubin (DBIL) were increased in hyperthyroid patients. However, FPG, HOMA-IR, and serum triglyceride (TG) levels were not significantly different between the two groups.
Clinical and Biochemical Features in Study Subjects
| Controls | Hyperthyroid Patients | P Value | |
|---|---|---|---|
| n | 108 | 119 | |
| Age, y | 31.2 ± 9.2 | 33.7 ± 10.1 | .053 |
| Gender, male/female | 33/75 | 31/88 | .451 |
| BMI, kg/m2 | 21.16 ± 2.59 | 20.02 ± 2.40 | .001 |
| Waist circumference, cm | 74.5 ± 8.4 | 74.2 ± 7.5 | .786 |
| SBP, mm Hg | 119 ± 12 | 123 ± 17 | .093 |
| DBP, mm Hg | 75 ± 8 | 71 ± 10 | .007 |
| Heart rate, bpm | 77 ± 9 | 109 ± 15 | <.001 |
| ALT, U/L | 18.26 ± 12.11 | 37.07 ± 14.49 | <.001 |
| AST, U/L | 28.91 ± 10.99 | 21.11 ± 10.42 | <.001 |
| TBIL, μmol/L | 13.44 ± 5.86 | 12.66 ± 4.64 | .228 |
| DBIL, μmol/L | 4.58 ± 2.59 | 3.89 ± 1.21 | .007 |
| FPG, mmol/L | 5.36 ± 4.18 | 5.13 ± 0.63 | .550 |
| TC, mmol/L | 4.72 ± 0.79 | 3.58 ± 0.81 | <.001 |
| TG, mmol/L | 0.89 ± 0.47 | 1.02 ± 0.61 | .084 |
| HDL, mmol/L | 1.18 ± 0.24 | 1.26 ± 0.34 | .464 |
| LDL-c, mmol/L | 294 ± 0.70 | 1.86 ± 0.61 | <.001 |
| FIns, mμ/L | 8.96 ± 5.28 | 9.28 ± 10.52 | .770 |
| HOMR-IRa | 1.83 (1.20–2.45) | 1.40 (0.92–2.21) | .703 |
| Free T3, pmol/La | 4.99 (4.65–5.45) | 27.67 (15.70–135.96) | <.001 |
| Free T4, pmol/La | 15.00 (13.82–16.29) | 65.04 (40.18–83.83) | <.001 |
| TSH, mIU/La | 1.82 (1.65–2.68) | 0.008 (0.005–0.010) | <.001 |
| TPOAb, U/mLa | 5.46 (3.21–11.19) | 8.94 (4.94–103.06) | <.001 |
| TGAb, U/mLa | 12.09 (8.91–21.07) | 26.62 (14.61–174.25) | <.001 |
| TRAb, U/mLa | <0.3 | 18.00 (11.48–30.05) | <.001 |
| BMR, % | 11.44 ± 13.30 | 49.57 ± 21.95 | <.001 |
| FGF21, pg/mLa | 228.10 (169.85–320.10) | 290.67 (156.60–502.33) | <.001 |
Abbreviations: SBP, systolic blood pressure; DBP, diastolic blood pressure; TBIL, total bilirubin; TC, Total cholesterol; HDL, high-density lipoprotein; TPOAb, thyroid peroxide antibody; TGAb, thyroglobulin antibody. Data are expressed as mean ± SD or median (interquartile range) unless stated otherwise.
Analysis performed on log-transformed data.
Serum FGF21 levels
Serum FGF21 levels were markedly increased in patients with hyperthyroidism compared with controls (median 290.67 [interquartile range, 156.60–502.33] vs 228.10 [169.85.25–320.10] pg/mL; P < .001) (Table 1). In 41 hyperthyroid patients, serum free T3 and free T4 concentrations returned to normal levels after thionamide treatment. With the normalization of thyroid function, serum FGF21 levels were dramatically decreased from 249.10 [139.10–444.00] to 101.30 [38.70–180.20] pg/mL (P < .001). BMR, BMI, and cholesterol were increased significantly, whereas ALT, AST, and DBIL decreased after thionamide treatment (Table 2).
Serum FGF21 Levels Before and After Thionamide Treatment in Hyperthyroid Subjects
| Before | After | P Value | |
|---|---|---|---|
| n | 41 | 41 | |
| Weight, kg | 52.36 ± 6.45 | 58.09 ± 8.01 | <.001 |
| BMI, kg/m2 | 19.77 ± 1.82 | 21.16 ± 2.10 | <.001 |
| ALT, U/L | 37.03 ± 16.39 | 22.30 ± 12.07 | <.001 |
| AST, U/L | 29.68 ± 11.14 | 20.53 ± 6.68 | <.001 |
| TBIL, μmol/L | 14.04 ± 7.69 | 11.89 ± 3.99 | .048 |
| DBIL, μmol/L | 4.78 ± 3.26 | 3.69 ± 1.41 | .014 |
| FPG, mmol/L | 5.21 ± 0.63 | 5.10 ± 0.46 | .163 |
| HOMA-IR | 1.48 (1.02–2.69) | 1.70 (1.14–2.06) | .206 |
| TG, mmol/L | 1.10 ± 0.91 | 1.12 ± 0.66 | .437 |
| TC, mmol/L | 3.79 ± 0.86 | 5.45 ± 1.01 | <.001 |
| HDL-c, mmol/L | 1.40 ± 0.44 | 1.66 ± 0.34 | <.001 |
| LDL-c, mmol/L | 1.90 ± 0.52 | 3.28 ± 0.82 | <.001 |
| Free T3, pmol/La | 25.58 (13.48–30.80) | 4.38 (3.84–5.07) | <.001 |
| Free T4, pmol/La | 58.39 (35.10–84.08) | 12.57 (11.53–14.66) | <.001 |
| TSH, mIU/La | 0.007 (0.004–0.011) | 0.77 (0.01–3.93) | <.001 |
| BMR, % | 45.0 (32.8–54.3) | 9.0 (0–15) | <.001 |
| FGF21, pg/mLa | 249.10 (139.10–444.00) | 101.30 (38.70–180.20) | <.001 |
Abbreviations: TBIL, total bilirubin; TC, total cholesterol; HDL-c, high-density lipoprotein cholesterol. Data are expressed as mean ± SD or median (interquartile range) unless stated otherwise.
Analysis performed on log-transformed data.
Correlations of serum FGF21 with TH and other clinical parameters
Serum FGF21 levels were positively correlated with serum free T3, free T4, and BMR in all subjects; the correlation coefficients were 0.269 (P < .001), 0.263 (P < .001), and 0.193 (P = .004), respectively (Figure 1, A–C). In addition, serum FGF21 levels were negatively correlated with serum total cholesterol level (correlation coefficient = −0.146; P = .025; Figure 1D), whereas there is no statistically significant correlation between serum FGF21 and FPG, TG, HOMA-IR, and BMI.
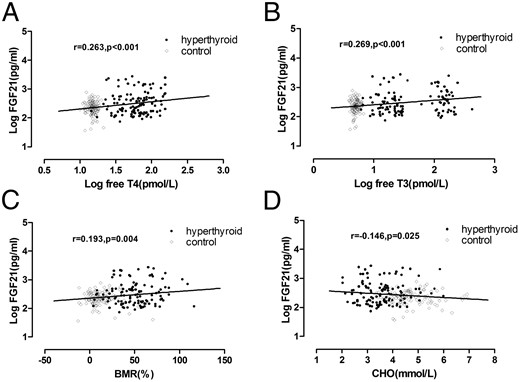
Correlation of FGF21 with serum levels of free T4 (A), free T3 (B), BMR (C), and cholesterol (CHO) (D).
Association of serum FGF21 levels with hyperthyroidism
Table 3 shows the adjusted ORs with associated 95% CI of serum FGF21 for hyperthyroidism. In model 1, with no adjustment for any confounding factor, serum FGF21 levels were significantly associated with hyperthyroidism (OR [95% CI], 1.734 [1.285–2.340]; P < .001). In model 2, with adjustment for age, gender, and family history of hyperthyroidism, we found that serum FGF21 levels were also significantly associated with hyperthyroidism (OR [95% CI], 1.734 [1.281–2.384]). We also found that family history of hyperthyroidism was associated with hyperthyroidism (OR [95% CI], 5.107 [2.034–12.822]; P = .001). But the relation between gender, age, and hyperthyroidism did not reach statistical significance. In model 3, with further adjustment for FPG, LDL-c, BMR, ALT, and AST, we found that serum FGF21 levels remained independently associated with hyperthyroidism, with the adjusted OR (95% CI) of 3.123 (1.306–7.468). Furthermore, we found that BMR and ALT were also significantly associated with hyperthyroidism, with adjusted ORs of 1.120 and 1.113, respectively, but the significant association of family history with hyperthyroidism disappeared.
ORs for Association Between Serum FGF21 Levels and Hyperthyroidism With the Use of Three Logistic Regression Models
| Variable | OR (95% CI) | P Value |
|---|---|---|
| Model 1 | ||
| FGF21a | 1.734 (1.285–2.340) | <.001 |
| Model 2 | ||
| Age | 1.021 (0.990–1.052) | .185 |
| Gender (male vs female) | 0.653 (0.345–1.238) | .191 |
| Family history | 5.107 (2.034–12.822) | .001 |
| FGF21a | 1.734 (1.281–2.348) | <.001 |
| Model 3 | ||
| Age | 1.015 (0.938–1.098) | .708 |
| Gender (male vs female) | 2.207 (0.376–12.940) | .381 |
| Family history | 1.090 (0.847–1.298) | .928 |
| BMI | 0.762 (0.565–1.026) | .724 |
| FPG | 0.976 (0.767–1.242) | .845 |
| LDL-c | 0.065 (0.005–0.917) | .043 |
| BMR | 1.120 (1.067–1.176) | <.001 |
| ALT | 1.130 (1.039–1.229) | .004 |
| AST | 0.693 (0.817–1.135) | .649 |
| FGF21a | 3.123 (1.306–7.468) | .010 |
OR and 95%CI expressed as per SD increase of log-transformed FGF21.
Discussion
In the present study, we found that serum FGF21 levels were markedly increased in patients with hyperthyroidism and dramatically declined after thionamide treatment. Moreover, FGF21 was independently associated with hyperthyroidism after adjustment for potential confounders. These findings present for the first time the clinical relevance of FGF21 in humans under the condition of hyperthyroidism.
So far, several animal experiments confirmed the effect of TH on FGF21 expression. Adams et al (8) reported that in mice, acute T3 treatment increased circulating FGF21 levels through activation of TH receptor β and cross talk with PPARα, which mediates the action of T3 in the liver. Their further study revealed that chronic T3 treatment also improved circulating FGF21 levels, whereas systemic injection of FGF21 decreased serum TH level, indicating that TH and FGF21 showed mutual regulation in mice (9). And the results were repeated by subsequent study recently (10). Our data clearly showed that serum FGF21 levels were elevated in patients with hyperthyroidism compared with healthy subjects. Meanwhile, the reversal of the hyperthyroid state was followed by declining serum FGF21 levels in hyperthyroidism. And logistic regression analysis also confirmed an independent association between serum FGF21 levels and hyperthyroidism. Therefore, our study has translated discoveries in animal to humans, suggesting a pathogenic role of FGF21 in hyperthyroidism. It is interesting to note that our observation is inconsistent with an earlier study that found serum FGF21 levels were unaltered in hyperthyroidism patients (12). However, that study was limited by a small sample size (20 subjects) and lack of normal control.
Additionally, our data indicated that serum FGF21 levels were correlated with BMR and serum cholesterol levels. And we found that elevated FGF21 levels fall below the level of normal controls after resolution of hyperthyroidism, which was accompanied by weight gain. It is well known that weight loss and reduced serum cholesterol levels are signs of hypermetabolic status induced by excess TH in hyperthyroidism. The mechanism underlying the action of TH involves diverse metabolic pathways. TH acts as a key regulator of BMR and adaptive thermogenesis, a primary source of energy expenditure in humans. In target tissue, TH interacts with the adrenergic pathway, stimulates Na+/K+ ATPase expression, and maintains BMR (13). On the other hand, TH induces Uncoupling Protein 1 expression, stimulating brown adipose tissue activity as well as converting white adipose tissue to more metabolically “beige” or BAT, which is the primary site of adaptive thermogenesis (14). It is interesting to note that the effect of FGF21 overlaps greatly with the action of TH. More recently, FGF21 was found to participate in the modulation of thermogenesis. A study on rat revealed that FGF21 was likely to exert an antiobesity effect primarily through modulation of BMR (15). Meanwhile, a growing body of evidence suggests that FGF21 promotes conversion of white to beige adipose tissue, activation of Uncoupling Protein 1-driven thermogenesis, and energy expenditure (16, 17). In addition, FGF21 has shown a beneficial effect on lipid profile in animal models. Systemic administration of FGF21 was followed by a decrease in plasma cholesterol and TG levels (18). Thus, elevated FGF21 in patients with hyperthyroidism may in part mediate TH action on energy homeostasis and lipid metabolism.
There are several limitations in our current study. First, the sample size was relatively small, and all subjects were recruited from one hospital only, which may have hampered the generalization of our findings. Second, because this study is cross-sectional, we cannot determine the temporal sequence between T3 and FGF21 levels. Third, BMR was used to evaluate the energy expenditure, which is not an accurate measurement.
In conclusion, our study demonstrates that serum FGF21 levels are dramatically elevated in patients with hyperthyroidism and decreased with thionamide treatment. Our findings provide for the first time the clinical evidence that FGF21 is independently associated with hyperthyroidism.
Acknowledgments
This work was supported by grants from the Xiamen Scientific Programs, the Fujian Medical Innovation Program, and the Fujian Province Nature Science Foundations (3502Z20144014, 2014-CXB-32, and 2015J01558).
Disclosure Summary: The authors have nothing to disclose.
F.X. and M.L. contributed equally to this work.
Abbreviations
- ALT
alanine transaminase
- AST
glutamic oxalacetic transaminase
- BAT
brown adipose tissue
- BMI
body mass index
- BMR
basal metabolic rate
- CI
confidence interval
- DBIL
direct bilirubin
- FGF21
fibroblast growth factor 21
- FPG
fasting plasma glucose
- HOMA-IR
homeostasis model of assessment for insulin sensitivity
- LDL-c
low-density lipoprotein cholesterol
- OR
odds ratio
- PPAR
peroxisome proliferator-activated receptor
- TG
triglyceride
- TH
thyroid hormone
- TRAb
TSH receptor antibody.
