


Fifty percent of pediatric low-grade gliomas affect the optic pathway, hypothalamus, and suprasellar areas (OP/HSGs), resulting in significant long-term neuroendocrinopathy.
This study aimed to dissect tumor- from treatment-related risk factors for OP/HSG-associated neuroendocrinopathy.
This was a retrospective case notes analysis of 166 children with newly diagnosed OP/HSGs at our quaternary center between 1980 and 2010 by multivariate Cox, linear, and logistic regression.
Patients were of median (range) age 4.9 (0.2–15.4) years at diagnosis and followed up for 8.3 (0.04–26.8) years. Despite high 20-year overall survival (81.0%), progression-free and endocrine event-free survival (EEFS) were 47.2 and 20.8%, respectively. EEFS declined up to 15 years post-diagnosis, with hypothalamic involvement (P < .001) being implicated more than radiotherapy (P = .008) in earlier endocrinopathy; the reverse being true of its density (radiotherapy P < .001; hypothalamic involvement P = .006). GH deficiency (GHD) was most common (40.3%), followed by central precocious puberty (CPP, 26.0%), gonadotropin (GnD; 20.4%), TSH (13.3%), and ACTH (13.3%) deficiencies. GHD increased with later treatment eras (P < .01), but replacement did not increase progression. CPP was associated with future GnD (P < .05). Posterior pituitary dysfunction (PPD; 7.2%) occurred in 57.9% after only biopsies or shunt procedures, and was associated with 6/13 deaths; 50.2% became obese. Tumor extent, surgery, and increased endocrinopathy, rather than radiotherapy, predicted visuocognitive morbidity.
This first longitudinal OP/HSG-specific study demonstrates that hypothalamo-pituitary dysfunction evolves hierarchically over decades. Tumor location predicts its speed of onset and radiotherapy its density. GnD can evolve from previous CPP, whereas life-threatening PPD can occur after any surgery. Our data suggest that recent radiation-avoiding chemotherapeutic strategies have increased GHD without improving survival.
Greater than 40% of central nervous system (CNS) tumors are low-grade gliomas (LGGs) (1). Although classed as benign grade I or II astrocytic tumors (the majority being juvenile pilocytic astrocytomas) (2), they exhibit unpredictable growth with the possibility of spontaneous involution, late-onset progression, or leptomeningeal metastases (3–5). Ten to sixteen percent are associated with neurofibromatosis type 1 (NF-1), behaving more indolently and occurring more anteriorly, bilaterally, and multifocally (5–11). Although 50–60% of pediatric LGGs involve the cerebellum, cerebral hemispheres or brainstem, 30–50% affect the optic nerves, chiasm, tracts, hypothalamus, and suprasellar midline, collectively referred to here as optic pathway, hypothalamic and suprasellar gliomas (OP/HSGs) (9, 11).
The first international whole-brain LGG study (LGG1) showed that the highest overall (OS) and progression-free survival (PFS) resulted from complete tumor resection (10, 11). However, due to their proximity to vital hypothalamo-pituitary and visual structures, only 3% of OP/HSGs were resectable compared with 94% of cerebellar LGGs (11). Despite high survival rates (86–100%) (8–13), survivors face significant endocrine, visual, and neurocognitive morbidity. These deficits are multifactorial in origin, the relative patient-, tumor- and treatment-related contributions being unclear, although in clinical practice radiotherapy is frequently blamed (9).
The reported incidence of neuroendocrinopathies in survivors varies from 39–100% (14, 15), with studies limited to small retrospective cohorts (16, 17), being of short duration (<10 y) (18, 19), focusing on radiotherapy-treated patients (15, 20), or analyzing outcomes cross sectionally, thereby not recognizing their temporal evolution (9, 21). The only longitudinal report to date did not compare OP/HSG-specific outcomes with LGGs arising elsewhere in the CNS and omitted gonadotropin and posterior pituitary dysfunction (PPD) entirely (9). Our aim was to determine risk factors for neuroendocrine dysfunction in our large, single-center, 30-year OP/HSG-specific cohort by multivariate survival analysis, testing the a priori hypothesis, “the incidence and severity of neuroendocrine morbidity is independently predicted by tumor location and treatment strategy.”
Materials and Methods
Study cohort
Great Ormond Street Hospital for Children (GOSH) is a quaternary pediatric neuro-oncology center for southeast England. A search on March 5, 2012 of our central tumor registry identified all children less than 16 years with newly registered OP/HSGs between January 1, 1980 and December 31, 2010. Cases were included if there was a biopsy-proven or radiologically diagnosed OP/HSG treated and followed up at GOSH. LGGs affecting the basal ganglia, thalamus, and third ventricle were included as their suprasellar midline locations might affect long-term neuroendocrine morbidity. Patients treated elsewhere or those whose radiological diagnoses were subsequently proven histologically erroneous were excluded. A retrospective case note, laboratory and radiology data review was performed.
Definitions
Independent variables
Patient-related data on age at diagnosis (stratified as <1, 1–5, and >5 y) (11), sex, ethnicity, NF-1 status, the presence and duration of symptoms or diencephalic syndrome were collected, alongside tumor stage (per the modified Dodge classification [MDC; Supplemental Table 1]) (7), hypothalamic involvement, and the presence of leptomeningeal metastases and hydrocephalus. Where tumors involved multiple regions, the highest (most posterior) MDC stage was recorded, whereas tumors outside MDC-defined regions (eg, pure thalamic tumors) were coded as “other midline.” World Health Organization histological tumor grade (2) was recorded where available.
Treatment modalities were recorded as surgical resections (any tumor debulking, including biopsies), decompression procedures (aimed at relieving raised intracranial pressure, eg, cyst aspirations and shunt procedures), radiotherapy or chemotherapy, and were classified as being part of the initial (primary) or cumulative (final) treatment strategy. Focal radiotherapy was delivered to total doses of 48–55 Gy in 25–30 fractions. Chemotherapy was administered according to International Pediatric Oncology Society LGG trial protocols with 12 (LGG1, 1997–2004) (11) or 18 months (LGG2, 2005–2010) (22), first-line carboplatin and vincristine, and second-line cyclophosphamide, cisplatin, thioguanine, procarbazine, lomustine, temozolamide, and/or actinomycin-D. LGG1 was a nonrandomized registry study testing chemotherapy as a means of avoiding or delaying radiotherapy in children less than 5 years of age, whereas LGG2, also nonrandomized, extended this aim to children less than 8 years, reserving radiotherapy only for those at least 8 years of age. Prior to 1997, OP/HSGs were primarily treated by surgical resection with/without radiotherapy. Patients were therefore stratified by treatment eras on this basis.
Primary outcomes
These were OS, PFS, and endocrine event-free survival (EEFS), with time-to-event endpoints defined as death from all causes, first progression (according to international criteria) (23), or first hypothalamo-pituitary endocrine event, respectively.
Secondary outcomes
These were the event-free survival for each hypothalamo-pituitary axis as assessed by departmental clinical and biochemical criteria (Supplemental Table 2): GH deficiency (GHD), central precocious puberty (CPP; in boys <9 y and girls <8 y at diagnosis), gonadotropin deficiency (GnD; in boys >14 y and girls >13 y at last followup), ACTH deficiency (ACTHD), TSH deficiency (TSHD), hyperprolactinemia, and PPD (central diabetes insipidus [CDI[, syndrome of inappropriate antidiuretic hormone secretion [SIADH], or cerebral salt wasting [CSW]) as well as obesity, insulin insensitivity, or type 2 diabetes mellitus. The total number of hypothalamo-pituitary deficits at last followup was termed the endocrine morbidity score (EMS) (24). The requirement for supported or special educational needs schooling and blind or partial-sightedness registration as per Department of Health England criteria (25) were surrogates for neurocognitive and visual outcomes, respectively. More detailed analysis of visual and cognitive data are beyond the scope of this paper and will be published elsewhere.
Statistical analysis
Nonparametric data were summarized as medians and ranges. Categorical variables were compared using the χ2 test and the χ2 test for trend, whereas continuous variables were compared using the Kruskal-Wallis one-way ANOVA. Kaplan-Meier survival curves were censored at last followup or death for all outcomes. Hazard ratios (HRs) with 95% confidence intervals (CIs) were estimated by univariate and multivariate Cox proportional hazards regression, with the latter generated by forward stepwise selection (inclusion criterion, P < .05; exclusion criterion, P > .10). Predictors entered were age, sex, ethnicity, NF-1 status, MDC stage, tumor grade, presence of symptoms, diencephalic syndrome, hypothalamic involvement, leptomeningeal metastases, and hydrocephalus at diagnosis, primary and final treatment modalities, number of progressions and surgeries, and treatment era. For PFS, the number of progressions, surgeries, and final treatment modalities were excluded from analyses. Cross-sectional correlations with EMS and neuro-ophthalmic outcomes were examined by linear and logistic regression, respectively, using the same forward stepwise selection criteria to estimate regression coefficients β and odds ratios with 95% CIs. Analyses were performed with SPSS version 21 (IBM) with significance set at P < .05.
Ethical approval
The GOSH Research & Development department approved this study as a case note review in March 2011.
Results
Patient recruitment
One hundred sixty-six of 203 registered OP/HSG patients were eligible for analysis (Table 1). The following patients were excluded: six for inappropriate histology (two meningiomas, one grade III astrocytoma, one Langerhans cell histiocytosis, one glioependymal cyst, and one Alexander disease), two for location outside the optic pathway or suprasellar midline (one right lateral ventricle, and one right temporal lobe), 14 for having had their treatment and/or followup in other centers, 14 for whom no records could be located, and one for loss to followup. Sixteen of 166 eligible patients had no ethnicity recorded leaving 150 datasets for multivariate analyses. Two patients had LGGs arising postchemotherapy for acute lymphoblastic leukemia. Tumor histology was only available for 63 patients (38.0%); therefore, tumor grade was excluded from all multivariate models and only included in post-hoc subcohort analyses of patients with histological verification.
Demographic, Tumor-, and Treatment-Related Characteristics, and Trends by Treatment Era
| Independent Variable | n/Median (%/Range) | By Treatment Era (%) | Pa | ||
|---|---|---|---|---|---|
| 1980–1996 (n = 65) | 1997–2004 (n = 50) | 2005–2010 (n = 51) | |||
| Age | |||||
| >5 y | 81 (48.5) | 30 (46.2) | 27 (54.0) | 24 (47.1) | .834 |
| 1–5 y | 69 (41.6) | 28 (43.1) | 19 (38.0) | 22 (43.1) | |
| <1 y | 16 (9.6) | 7 (10.8) | 4 (8.0) | 5 (9.8) | |
| Sex | .410 | ||||
| Male | 76 (45.8) | 27 (41.5) | 24 (48.0) | 25 (49.0) | |
| Female | 90 (54.2) | 38 (58.5) | 26 (52.0) | 26 (51.0) | |
| Ethnicity (n = 150) | <.001 | ||||
| White | 114 (68.7) | 43 (66.2%) | 44 (88.0%) | 27 (52.9%) | |
| Non-white | 36 (21.7) | 7 (10.8%) | 5 (10.0%) | 24 (47.1) | |
| Unknown | 16 (9.6) | 15 (23.1%) | 1 (2.0%) | 0 (0.0%) | |
| NF-1 status | .889 | ||||
| Negative | 98 (59.0) | 39 (60.0) | 29 (58.0) | 30 (58.8) | |
| Positive | 68 (41.0) | 26 (40.0) | 21 (42.0) | 21 (41.2) | |
| Symptomatic | .037 | ||||
| No | 27 (16.3) | 6 (9.2) | 9 (18.0) | 12 (23.5) | |
| Yes | 139 (83.7) | 59 (90.8) | 41 (82.0) | 39 (76.5) | |
| Diencephalic syndrome | .754 | ||||
| No | 153 (92.2) | 59 (90.8) | 47 (94.0) | 47 (92.2) | |
| Yes | 13 (7.8) | 6 (9.2) | 3 (6.0) | 4 (7.8) | |
| Tumor stage | .623 | ||||
| MDC 1 | 29 (17.5) | 12 (18.5) | 8 (16.0) | 9 (17.6) | |
| MDC 2 | 76 (45.8) | 28 (43.1) | 23 (46.0) | 25 (49.0) | |
| MDC 3/4 | 34 (20.5) | 13 (20.0) | 11 (22.0) | 10 (19.6) | |
| MDC other midline | 27 (16.3) | 12 (18.5) | 8 (16.0) | 7 (13.7) | |
| Hypothalamic involvement | .947 | ||||
| No | 99 (59.6) | 38 (58.5) | 31 (62.0) | 30 (58.8) | |
| Yes | 67 (40.4) | 27 (41.5) | 19 (38.0) | 21 (41.2) | |
| Leptomeningeal metastases | .801 | ||||
| No | 160 (96.4) | 63 (96.9) | 48 (96.0) | 49 (96.1) | |
| Yes | 6 (3.6) | 2 (3.1) | 2 (4.0) | 2 (3.9) | |
| Hydrocephalus | .186 | ||||
| No | 105 (63.3) | 37 (56.9) | 33 (66.0) | 35 (68.6) | |
| Yes | 61 (36.7) | 28 (43.1) | 17 (34.0) | 16 (31.4) | |
| Tumor grade | .188 | ||||
| Grade I | 51 (30.7) | 21 (32.3) | 17 (34.0) | 13 (25.5) | |
| JPA | 40 (24.1) | ||||
| SEGA | 2 (1.2) | ||||
| NOS | 9 (5.4) | ||||
| Grade II | 12 (7.2) | 8 (12.3) | 2 (4.0) | 2 (3.9) | |
| Diffuse fibrillary astrocytoma | 6 (3.6) | ||||
| Pilomyxoid astrocytoma | 3 (1.8) | ||||
| NOS | 3 (1.8) | ||||
| Not biopsied/no histology | 103 (62.0) | 36 (55.4) | 31 (62.0) | 36 (70.6) | |
| Primary treatment strategy | |||||
| Observation only | 58 (34.9) | 20 (30.8) | 19 (38.0) | 19 (37.3) | |
| Resection only | 17 (10.2) | 13 (20.0) | 1 (2.0) | 3 (5.9) | |
| Decompression without resection | 4 (2.4) | 3 (4.6) | 1 (2.0) | 0 (0.0) | |
| RT | 19 (11.4) | 10 (15.4) | 3 (6.0) | 6 (11.8) | .263 |
| Chemotherapy | 20 (12.0) | 3 (4.6) | 8 (16.0) | 9 (17.6) | |
| Any surgery + RT | 26 (15.7) | 12 (18.5) | 10 (20.0) | 4 (7.8) | |
| Any surgery + chemotherapy | 22 (13.3) | 4 (6.2) | 8 (16 0.0) | 10 (19.6) | |
| Any primary resection | 53 (31.9) | 26 (40.0) | 16 (32.0) | 11 (21.6) | .036 |
| Any primary decompression | 50 (30.1) | 23 (35.4) | 14 (28.0) | 13 (25.5) | .241 |
| Any primary RT | 45 (27.1) | 22 (33.8) | 13 (26.0) | 10 (19.6) | .086 |
| Any primary chemotherapy | 42 (25.3) | 7 (10.8) | 16 (32.0) | 19 (37.3) | .001 |
| Final treatment strategy | |||||
| Observation only | 38 (22.9) | 14 (21.5) | 13 (26.0) | 11 (21.6) | |
| Surgery only | 21 (12.7) | 12 (18.5) | 3 (6.0) | 6 (11.8) | |
| RT only | 15 (9.0) | 4 (6.2) | 5 (10.0) | 6 (11.8) | |
| Chemotherapy only | 20 (12.0) | 2 (3.1) | 7 (14.0) | 11 (21.6) | .729 |
| Any surgery + RT | 31 (18.7) | 20 (30.8) | 8 (16.0) | 3 (5.9) | |
| Any surgery + chemotherapy | 18 (10.8) | 2 (3.1) | 8 (16.0) | 8 (15.7) | |
| RT + chemotherapy | 6 (3.6) | 2 (3.1) | 1 (2.0) | 3 (5.9) | |
| Any surgery + RT + chemotherapy | 17 (10.2) | 9 (13.8) | 5 (10.0) | 3 (5.9) | |
| Any resection | 60 (36.1) | 31 (47.7) | 18 (36.0) | 11 (21.6) | .004 |
| Any decompression | 67 (40.4) | 32 (49.2) | 19 (38.0) | 16 (31.4) | .050 |
| Any RT | 69 (41.6) | 35 (53.8) | 19 (38.0) | 15 (29.4) | .007 |
| Any chemotherapy | 61 (36.7) | 15 (23.1) | 21 (42.0) | 25 (49.0) | .003 |
| No. of progressions | 0 (0–6) | 0 (0–6) | 0 (0–4) | 0 (0–5) | .710 |
| No. of surgeries | 1 (0–27) | 1 (0–27) | 0 (0–24) | 0 (0–12) | .043 |
Bold P values are significant at < .05.
Abbreviations: JPA, juvenile pilocytic astrocytoma; NOS, not otherwise specified; SEGA, subependymal giant cell astrocytoma; RT, radiotherapy.
P values are for the χb-test for trend or the Kruskal-Wallis one-way ANOVA.
Median ages at diagnosis and followup were 4.9 (range 0.2–15.4) and 15.5 (2.4–37.4) years respectively, with a median followup of 8.3 (0.04–26.8) years. Median symptom duration prior to diagnosis (n = 134) was 135 (1–1825) days, being longer in posterior tumors (MDC 3/4 vs 1: 210 [21–1460] vs 90 [30–1460] d; P < .05) and those without hypothalamic involvement (nonhypothalamic vs hypothalamic: 150 [1–1825] vs 90 [1–1460] d; P < .01), but not in nonwhite patients or those presenting with endocrinopathies (P = nonsignificant [NS]).
The use of surgery and radiotherapy declined significantly over successive treatment eras in favor of chemotherapy (1980–1996 vs 2005–2010: surgical resections, 47.7 vs 21.6%; radiotherapy, 53.8 vs 29.4%; chemotherapy, 23.1 vs 49.0%; P < .01). The age at first radiotherapy exposure also increased with time (median age, 1980–1996 vs 2005–2010: 6.7 (0.6–15.9) vs 10.2 (4.3–15.7) y; P < .01). The proportions of nonwhite and symptomatic patients respectively increased (1980–1996 vs 2005–2010: 10.8 vs 47.1%; P < .001) and decreased (1980–1996 vs 2005–2010: 90.8 vs 76.5%; P < .05) with time, in keeping with service expansion and increased neuroimaging. No other independent variable followed this trend, nor were there differences in the proportion of patients undergoing biochemical endocrine testing (1980–1996, 75.4%; 1997–2004, 74.0%; 2005–2010, 82.4%; P = NS) over time.
Primary outcomes
Survival for all primary outcomes plateaued by 20 years, with actuarial OS, PFS, and EEFS being 81.0, 47.2, and 20.8% respectively. Endocrine events occurred early with EEFS decreasing much more than PFS and OS (P < .001) (Figure 1A, and Tables 2 and 3).
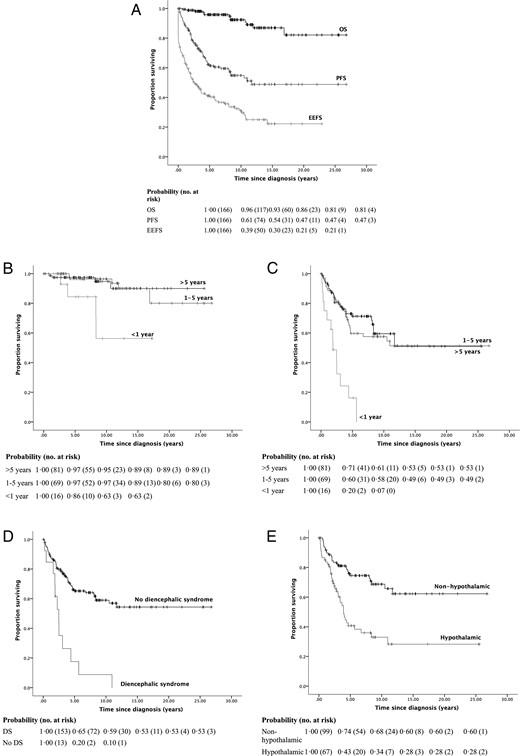
Kaplan-Meier survival curves and life tables for (A) actuarial OS, PFS, and EEFS; (B) OS by age; (C–E) PFS by age, the presence of diencephalic syndrome and hypothalamic involvement respectively.
Twenty-Year OS, PFS, EEFS, and EMS at Last Followup With Crude HRs (95% CI) and Unadjusted Regression Coefficients β, Respectively
| Independent Variable | OS (95% CI) | PFS (95% CI) | EEFS (95% CI) | EMS (95% CI) | |||||||
|---|---|---|---|---|---|---|---|---|---|---|---|
| 20-Year OS | Crude HR | P | 20-Year PFS | Crude HR | P | 20-Year EEFS | Crude HR | P | Crude β | P | |
| Age | |||||||||||
| >5 y | 88.7 (76.1–100.0) | 1.00 | 53.4 (36.1–70.8) | 1.00 | 23.8 (13.2–34.5) | 1.00 | −0.02 (−0.07–0.04) | .600 | |||
| 1–5 y | 80.0 (60.6–99.3) | 1.05 (0.28–3.94) | .945 | 49.5 (34.4–64.5) | 1.17 (0.69–2.00) | .566 | 25.6 (11.1–40.0) | 0.64 (0.43–0.97) | .034 | ||
| <1 y | 62.9 (32.6–93.1) | 5.29 (1.32–21.22) | .019 | 6.7 (0.0–23.2) | 5.26 (2.66–10.42) | <.001 | 0.0c | 1.40 (0.78–2.53) | .260 | ||
| Sex | |||||||||||
| Male | 78.8 (55.7–100.0) | 1.00 | 45.7 (27.5–63.8) | 1.00 | 26.7 (14.2–39.2) | 1.00 | −0.11 (−0.54–0.32) | ||||
| Female | 82.6 (59.4–95.8) | 1.02 (0.34–3.03) | .978 | 48.4 (36.8–60.1) | 1.37 (0.84–2.23) | .211 | 16.5 (5.6–27.5) | 0.99 (0.68–1.45) | .972 | ||
| Ethnicity (n = 150) | |||||||||||
| White | 88.3 (79.6–96.9) | 1.00 | 46.8 (34.2–59.4) | 1.00 | 21.9 (11.7–32.0) | 1.00 | 0.01 (−0.53–0.55) | .979 | |||
| Nonwhite | 36.5 (0.0–89.5) | 2.43 (0.73–8.13) | .151 | 37.3 (15.6–59.1) | 1.49 (0.85–2.62) | .161 | 10.5 (0.0–27.4) | 1.24 (0.79–1.96) | .350 | ||
| NF-1 | |||||||||||
| negative | 78.5 (63.4–93.7) | 1.00 | 37.6 (24.9–50.3) | 1.00 | 13.0 (4.7–21.3) | 1.00 | −0.96 (−1.37 to –0.55) | <.001 | |||
| Positive | 88.2 (73.6–100.0) | 0.52 (0.14–1.90) | .520 | 62.8 (45.0–80.7) | 0.43 (0.25–0.74) | .002 | 33.0 (15.3–50.8) | 0.45 (0.30–0.68) | <.001 | ||
| Symptomatic | |||||||||||
| No | 95.7 (87.6–100.0) | 1.00 | 73.9 (56.0–91.9) | 1.00 | 10.6 (0.0–37.4) | 1.00 | 1.00 (0.44–1.56) | .001 | |||
| Yes | 80.2 (67.3–93.1) | 1.53 (0.20–11.96) | .686 | 44.0 (32.9–55.1) | 1.97 (0.85–4.56) | .114 | 20.1 (11.8–28.4) | 1.93 (1.06–3.52) | .032 | ||
| Diencephalic syndrome | 1.40 (0.63–2.17) | <.001 | |||||||||
| No | 80.8 (66.8–94.8) | 1.00 | 53.3 (42.5–64.1) | 1.00 | 23.5 (14.3–32.7) | 1.00 | |||||
| Yes | 78.3 (50.8–100.0) | 1.99 (0.44–9.04) | .375 | 0.0b | 4.13 (2.19–7.79) | <.001 | 0.0c | 1.74 (0.95–3.18) | .073 | ||
| Tumor stage | |||||||||||
| MDC 1 | 89.1 (74.2–100.0) | 1.00 | 68.3 (33.1–100.0) | 1.00 | 54.4 (21.0–87.8) | 1.00 | 0.27 (0.05–0.49) | .019 | |||
| MDC 2 | 82.8 (64.9–100.0) | 0.81 (0.16–4.23) | .806 | 48.7 (34.3–63.2) | 3.64 (1.29–10.30) | .015 | 13.5 (2.7–24.3) | 4.31 (2.05–9.08) | <.001 | ||
| MDC 3/4 | 80.0 (55.2–100.0) | 0.71 (0.10–5.07) | .735 | 37.3 (13.8–60.9) | 4.00 (1.34–11.97) | .013 | 21.7 (6.4–37.0) | 3.45 (1.55–7.70) | .002 | ||
| MDC other midline | 80.4 (62.7–98.0) | 1.82 (0.33–10.03) | .491 | 33.6 (12.7–54.6) | 4.93 (1.63–14.87) | .005 | 14.1 (0.0–29.2) | 3.94 (1.74–8.91) | .001 | ||
| Hypothalamic involvement | 1.11 (0.71–1.52) | <.001 | |||||||||
| No | 87.3 (76.4–98.3) | 1.00 | 60.3 (46.4–74.3) | 1.00 | 38.6 (25.9–51.3) | 1.00 | |||||
| Yes | 73.1 (49.7–96.5) | 1.75 (0.59–5.20) | .318 | 27.9 (12.5–43.3) | 2.86 (1.75–4.67) | <.001 | 0.0c | 3.03 (2.04–4.48) | <.001 | ||
| Leptomeningeal metastases | 1.46 (0.33–2.58) | .012 | |||||||||
| No | 80.4 (67.4–93.3) | 1.00 | 48.7 (37.8–59.5) | 1.00 | 22.0 (13.3–30.7) | 1.00 | |||||
| Yes | 100.0a | 0.05 (0.00-∞) | .630 | 0.0b | 2.09 (0.76–5.78) | .155 | 0.0c | 0.95 (0.35–2.59) | .922 | ||
| Hydrocephalus | |||||||||||
| No | 87.4 (86.8–87.1) | 1.00 | 54.5 (41.0–68.0) | 1.00 | 24.6 (12.6–36.5) | 1.00 | 0.47 (0.03–0.91) | .037 | |||
| Yes | 72.1 (47.5–96.8) | 2.00 (0.67–5.99) | .213 | 35.0 (18.2–51.7) | 1.64 (1.01–2.66) | .045 | 14.9 (3.7–26.2) | 1.65 (1.13–2.42) | .010 | ||
| Tumor grade (n = 63) | |||||||||||
| Grade I | 87.0 (76.7–94.7) | 1.00 | 23.2 (6.93–39.5) | 1.00 | 10.6 (0.0–21.4) | 1.00 | 0.30 (−0.73–1.34) | .559 | |||
| Grade II | 60.3 (10.6–100.0) | 2.71 (0.44–16.56) | .280 | 35.9 (6.2–65.5) | 1.02 (0.45–2.32) | .961 | 5.6 (0.0–20.0) | 1.86 (0.95–3.64) | .072 | ||
| Primary treatment strategy | |||||||||||
| Untreated | 91.9 (82.9–100.0) | 1.00 | 59.3 (38.4–80.3) | 1.00 | 33.3 (14.7–52.0) | 1.00 | |||||
| Resection | 78.0 (55.6–100.0) | 0.70 (0.21–2.29) | .553 | 42.7 (27.9–57.4) | 1.39 (0.85–2.27) | .184 | 11.7 (1.0–22.5) | 1.76 (1.20–2.59) | .004 | 0.66 (0.21–1.11) | .004 |
| Decompression | 68.7 (38.3–99.0) | 1.52 (0.50–4.65) | .466 | 33.3 (15.5–51.1) | 1.61 (0.98–2.63) | .060 | 9.5 (0.0–19.6) | 1.85 (1.25–2.74) | .002 | 0.58 (0.12–1.04) | .014 |
| Radiotherapy | 71.8 (47.6–95.9) | 2.04 (0.68–6.11) | .201 | 40.9 (21.2–60.6) | 1.05 (0.62–1.77) | .865 | 4.1 (0.0–10.4) | 2.99 (2.00–4.46) | <.001 | 1.06 (0.60–1.51) | <.001 |
| Chemotherapy | 84.7 (65.8–100.0) | 1.01 (0.28–3.67) | .989 | 39.9 (22.6–57.2) | 1.64 (0.97–2.76) | .063 | 9.1 (0.0–22.1) | 0.87 (0.56–1.33) | .515 | −0.13 (−0.62–0.36) | .603 |
| Final treatment strategy | |||||||||||
| Untreated | 100.0b | 1.00 | — | — | — | 34.3 (8.2–60.4) | 1.00 | ||||
| Resection | 76.5 (57.3–95.7) | 1.06 (0.35–3.19) | .923 | — | — | — | 11.9 (1.8–22.0) | 1.68 (1.15–2.45) | .008 | 0.76 (0.33–1.19) | .001 |
| Decompression | 68.1 (46.5–89.7) | 3.27 (1.00–10.66) | .049 | — | — | — | 10.1 (1.2–19.0) | 1.75 (1.20–2.55) | .004 | 0.64 (0.21–1.06) | .004 |
| Radiotherapy | 73.5 (55.0–92.0) | 2.41 (0.74–7.86) | .145 | — | — | — | 3.0 (0.0–8.2) | 3.39 (2.28–5.04) | <.001 | 1.37 (0.99–1.75) | <.001 |
| Chemotherapy | 75.3 (52.0–98.5) | 1.01 (0.33–3.10) | .986 | — | — | — | 13.8 (1.0–26.7) | 0.94 (0.64–1.39) | .751 | 0.21 (−0.24–0.65) | .355 |
| Treatment era | |||||||||||
| 1980–1996 | 78.0 (63.7–92.4) | 1.00 | 51.8 (38.2–65.5) | 1.00 | 24.9 (12.4–37.4) | 1.00 | −0.38 (−0.63 to –0.13) | .003 | |||
| 1997–2004 | 88.7 (74.2–100.0) | 0.53 (0.14–2.00) | .529 | 39.8 (16.9–62.6) | 1.01 (0.57–1.78) | .968 | 20.5 (5.1–35.8) | 0.92 (0.59–1.45) | .728 | ||
| 2005–2010 | 97.1 (91.5–100.0) | 0.53 (0.06–4.80) | .534 | 53.8 (38.2–69.5) | 1.41 (0.77–2.61) | .269 | 19.2 (1.4–36.9) | 1.27 (0.80–2.04) | .316 | ||
| No. progressions | — | 1.43 (1.08–1.90) | .012 | — | — | — | — | 1.16 (1.01–1.32) | .030 | 0.40 (0.22–0.58) | <.001 |
| No. surgeries | — | 1.04 (0.96–1.14) | .327 | — | — | — | — | 1.04 (1.01–1.08) | .026 | 0.14 (0.08–0.19) | <.001 |
Bold values indicate P < .05.
All patients with leptomeningeal metastases survived to last followup.
All patients with diencephalic syndrome and/ or leptomeningeal metastases progressed.
All patients aged <1 y at diagnosis, with diencephalic syndrome, hypothalamic involvement or leptomeningeal metastases experienced ≥1 endocrinopathy.
Predictors Included in the Multivariate Cox and linear Regression Models for OS, PFS, EEFS, and EMS, Ranked by Magnitude of HR or Regression Coefficient β
| Outcome | Independent Predictors | Adjusted HR/β (95% CI) | P |
|---|---|---|---|
| OS | Age (vs >5 y) | ||
| 1–5 y | 2.10 (0.46–9.66) | .341 | |
| <1 y | 17.38 (2.81–107.29) | .002 | |
| Primary radiotherapy | 3.88 (0.98–15.42) | .054 | |
| Nonwhite ethnicity | 3.42 (0.97–12.02) | .055 | |
| PFS | Age (vs >5 y) | ||
| 1–5 y | 1.23 (0.71–2.13) | .467 | |
| <1 y | 3.11 (1.50–6.48) | .002 | |
| Hypothalamic involvement | 2.33 (1.35–4.03) | .003 | |
| EEFS | Hypothalamic involvement | 2.20 (1.41–3.42) | <.001 |
| Primary radiotherapy | 1.98 (1.16–3.39) | .013 | |
| Any radiotherapy | 1.67 (0.95–2.94) | .074 | |
| EMS | Any radiotherapy | 1.27 (0.88–1.65) | <.001 |
| Diencephalic syndrome | 0.93 (0.23–1.63) | .009 | |
| No. surgeries | 0.08 (0.03–0.13) | .004 | |
| Female sex | −0.41 (−0.78–0.03) | .034 |
Bold values indicate P < .05.
OS
Thirteen patients (7.8%) died at a median of 8.2 (0.8–16.9) years from disease progression (nine), acute hydrocephalus (two), acute intratumoral hemorrhage (one), or a second primary cancer (one atypical teratoid rhabdoid tumor arising postchemotherapy). Notably, six (46%) had severe PPD (three CSW, two CDI, one SIADH) at the time of death. The only independent risk factor for mortality was age < 1 year at diagnosis (Figure 1B; P < .01). Subcohort analysis of biopsied tumors showed that nonwhite ethnicity independently reduced OS (HR, 10.76 [1.12–103.78]; P < .05).
PFS
Sixty-seven OP/HSGs (40.4%) progressed at a median 2.1 (0.1–11.7) years from diagnosis; in 32.8% this was multiple (one progressing six times), whereas one underwent 27 operations for progression or hydrocephalus (Figure 1, C–E). Age < 1 year (P < .01) and hypothalamic involvement (P < .01) were independent risk factors for progression, whereas patients with diencephalic syndrome (P < .001) or hypothalamic involvement (P = .001) were more likely to progress multiple times (Supplemental Table 3). In the biopsied subcohort, primary chemotherapy was independently associated with an increased risk of progression (HR, 2.05 [1.05–3.98]; P < .05), whereas primary resection was conversely associated with a reduced risk (HR, 0.37 [0.18–0.73]; P < .01). Neither metastatic disease, tumor grade, treatment modalities, nor treatment era affected OS or PFS. GH supplementation was not independently associated with PFS when included as part of a post-hoc multivariate model (data not shown).
EEFS
One hundred nine patients (65.7%) experienced their first endocrine event at a median of 0.8 (0.0–14.2) years from diagnosis (Figure 2, B–E). However, one patient with an anterior tumor (MDC stage 1) developed isolated GHD 14.2 years postdiagnosis after chemotherapy alone. Hypothalamic involvement was a stronger independent predictor of reduced EEFS (P < .001) than primary radiotherapy (P < .05). Subcohort analysis of biopsied tumors did not show any differences. The trend for reduced EEFS in the lattermost treatment era suggested by Kaplan-Meier analysis (Figure 2E) was not confirmed in the multivariate model.
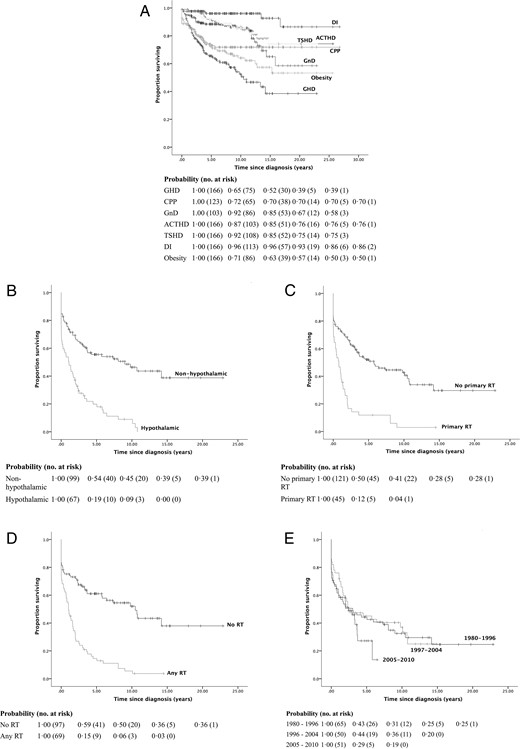
Kaplan-Meier survival curves and life tables for EEFS by (A) individual EEFS, (B) presence of hypothalamic involvement, use of radiotherapy as part of the primary (C) and final (D) treatment strategies respectively, and treatment era (E).
DI, diabetes insipidus; RT, radiotherapy.
Secondary outcomes
EMS
Endocrinopathy was unusual at diagnosis with gonadotropin dysfunction being most common (11.4% CPP; 14.3% GnD) (Figure 2A; Tables 23–4). At last followup, 54.8% had at least one endocrinopathy (median EMS, 1 [0–6]) with a clear hierarchical evolution. GHD occurred earliest and most frequently (40.3%) followed by CPP (26.0%), GnD (20.4%), TSHD (13.3%), ACTHD (13.3%), and CDI (4.2%). Eleven (6.6%) had panhypopituitarism (four with CDI).
Prevalence at Diagnosis & Last Followup, 20-Year Event-Free Survival, Predictors Included in the Multivariate Cox Regression Model, HRs, and 95% CIs for Individual Endocrine Events
| Endocrine Event | n (%) | 20-Year Event-Free Survival (95% CI) | Independent Predictors | Adjusted HR (95% CI) | P | |
|---|---|---|---|---|---|---|
| At Diagnosis | At Last Followup | |||||
| GHD | 1 (0.6) | 67 (40.3) | 39.2 (27.2–51.2) | Any radiotherapy | 5.76 (2.93–11.32) | <.001 |
| Treatment era (vs 1980–1996) | ||||||
| 1997–2004 | 0.89 (0.50–1.58) | .682 | ||||
| 2005–2010 | 2.48 (1.29–4.79) | .007 | ||||
| Primary radiotherapy | 2.48 (1.36–4.52) | .003 | ||||
| No. surgeries | 1.09 (1.04–1.14) | <.001 | ||||
| CPP | 14/123 (11.4) | 32/123 (26.0) | 69.7 (60.8–78.6) | Hypothalamic involvement | 4.42 (1.97–9.92) | <.001 |
| Female sex | 0.43 (0.21–0.90) | .024 | ||||
| Any chemotherapy | 0.42 (0.20–0.90) | .026 | ||||
| GnD | 1/7 (14.3) | 21/103 (20.4) | 58.4 (39.4–77.4) | Hypothalamic involvement | 5.09 (1.95–13.31) | .001 |
| Primary radiotherapy | 3.27 (1.35–7.94) | .009 | ||||
| ACTHD | 1 (0.6) | 22 (13.3) | 75.6 (65.2–86.0) | Diencephalic syndrome | 15.72 (4.38–56.39) | <.001 |
| Primary radiotherapy | 5.16 (2.12–12.57) | <.001 | ||||
| Female sex | 0.30 (0.12–0.74) | .009 | ||||
| Any chemotherapy | 0.30 (0.10–0.92) | .035 | ||||
| TSHD | 2 (1.2) | 22 (13.3) | 75.3 (64.6–86.0) | Hypothalamic involvement | 7.18 (2.41–21.38) | <.001 |
| HyperPRL | 5 (3.0) | 5 (3.0) | 78.1 (64.8–91.4) | — | — | — |
| PPD | 4 (2.4) | 12 (7.2) | 79.2 (69.8–88.7) | Hypothalamic involvement | 5.82 (1.64–20.67) | .006 |
| 1 CDI | 7 CDI | 86.1 (71.6–100.0) | Any resection | 4.61 (1.39–15.34) | .013 | |
| 2 SIADH | 2 SIADH | 86.8 (79.0–94.6) | Treatment era (vs 1990–1996) | |||
| 1 CSW | 3 CSW | 91.4 (84.4–98.5) | 1997–2004 | 0.19 (0.04–0.87) | .032 | |
| 2005–2010 | 1.25 (0.38–4.08) | .716 | ||||
| Obesity | 23 (13.9) | 54 (32.5) | 50.2 (35.4–65.1) | — | — | — |
| Insulin resistance | 0 (0.0) | 16 (9.6) | 73.1 (55.9–90.3) | Primary decompression Primary radiotherapy | 3.96 (1.43–10.93)3.91 (1.42–10.80) | .008.009 |
Abbreviation: HyperPRL, hyperprolactinemia.
For univariate HRs see Supplemental Table 4.
Bold values indicate P < .05.
Treatment era was therefore a significant confounder in cross-sectional analysis for EMS (β = −0.38; 95% CI, −0.63–−0.13) and excluded from the multivariate model. Radiotherapy exposure (P < .001) was a stronger predictor than diencephalic syndrome (P < .01) of final EMS, which also increased with the number of surgical interventions (P < .01) and decreased with female sex (P < .05).
Specific EEFS
Multivariate analyses of individual endocrinopathies revealed that hypothalamic involvement or the presence of diencephalic syndrome were more predictive of most endocrine deficits (CPP, GnD, ACTHD, TSHD, PPD) than treatment-related factors such as radiotherapy exposure (Table 4). Radiotherapy was the strongest risk factor for GHD (P < .001), but did not independently predict CPP, TSHD, or PPD. GHD significantly increased in later treatment eras (P < .01), whereas PPD significantly decreased between 1997 and 2004 (P < .05). The protective effect of female sex on EMS was CPP- (P = .03) and ACTHD-specific (P = .009).
One GHD, two ACTHD (likely secondary to dexamethasone suppression), and ten PPD cases were reversible. Notably, CPP could evolve to future GnD (37.5% of CPP vs 14.6% of non-CPP patients subsequently developed GnD, P = .048; 50.0% of GnD vs 19.6% of non-GnD patients had previous CPP; P = .02). Most hyperprolactinemia was transient and only one galactorrheic patient (prolactin > 1000 mU/L) required cabergoline. On multivariate analysis, surgery was the only treatment-related factor predicting PPD (P < .05), the risk increasing with repeated operations (P < .05; Supplemental Table 4). Only three of 22 patients had PPD at diagnosis (two with hypothalamic tumors, one with a third ventricle tumor), the remainder having all undergone surgery prior to its onset; in 11/19 (57.9%) this was a biopsy or decompression procedure alone.
Visual and neurocognitive outcomes
At last followup, 21.1% of patients were registered blind or partially sighted, 36.1% had required supported schooling, and 15.7% had attended a special-needs school (Supplemental Tables 5 and 6). Poor visual and educational outcomes were strongly predicted by posteriorly extensive (MDC stage 3/4), multiply progressive, or metastatic tumors. Primary resection was associated with reduced special school attendance—although conversely—if part of the final treatment strategy, resections were associated with blind registration and special school attendance. Girls and patients treated in latter treatment eras were less likely to require supported or special-needs schooling. Radiotherapy did not independently predict visual or cognitive dysfunction whereas a higher EMS predicted a higher likelihood of requiring supported (P = .001) or special-needs schooling (P = .004, data not shown).
Neurological morbidity was otherwise rare; three patients developed moya-moya disease (all postradiotherapy, one with NF-1) and two patients had strokes after surgery and radiotherapy, one of whom also had chemotherapy.
Discussion
The high actuarial 20-year OS we report for OP/HSGs in this study is comparable to published literature (9–11). Thus, minimizing future endocrine, visual, and cognitive morbidity remains an important therapeutic goal in managing these tumors. Although endocrine dysfunction seems easily treatable, combined ACTHD and PPD can be life-threatening (26), GnD impairs future fertility, and obesity, with its long-term cardiovascular and metabolic sequelae, is in itself life limiting. The lower concurrent PFS rates we and others have demonstrated (47–51%) (9, 10) additionally suggest that the optimal treatment strategy for these benign lesions remains elusive; while the absence of longitudinal neuroendocrine morbidity data limits our understanding of their etiology and evolution. The single-center study of Armstrong et al (9) is the only other longitudinal analysis of long-term LGG outcomes, but this was not OP/HSG-specific and thus biased by the larger proportion of more peripheral and easily resectable tumors.
Our study uniquely examines the longitudinal evolution and predictors of neuroendocrine dysfunction over three decades in the largest OP/HSG-specific cohort reported to date. Our predictors of reduced OS and PFS (age <1 y and hypothalamic involvement) agree with previous reports, with hypothalamic tumors and patients with diencephalic syndrome progressing repeatedly (10–13). Unlike LGGs elsewhere, OP/HSG-specific survival is not independently predicted by NF-1 status, tumor grade, or metastases; their effect is probably negated by the intrinsic progressive nature of tumors in this location (8, 11, 13, 27). Our study also supports the safety of GH supplementation in these cases with tumor progression rates being unaffected as previously reported (28, 29).
Although tumor location, radiotherapy, and surgery have all been implicated in OP/HSG-related endocrinopathy, these univariate cross-sectional studies fail to separate tumor- from treatment-related effects (8, 17, 18). Contrastingly, our multivariate longitudinal analysis confirms our hypothesis that both tumor location and treatment modalities influence long-term neuroendocrine morbidity. By introducing the concept of EEFS, we show that whereas tumor location predicts the tempo of endocrinopathy, radiotherapy compounds its density, particularly GHD. The strong association between GHD and radiotherapy explains the findings of Armstrong et al (9) that complete resection, in a largely peripheral LGG cohort, reduces GHD by obviating the need for adjuvant irradiation. Given the pre-existing hypothalamic disruption and the propensity for multiple disease progressions, it is unsurprising that infants with diencephalic syndrome were also more likely to develop multiple endocrinopathies.
The hierarchical evolution in hypothalamo-pituitary dysfunction observed echoes that previously described in OP/HSGs, craniopharyngiomas, and other suprasellar tumors (15, 27, 30, 31). Its pathogenesis is poorly understood but is thought to reflect a differential radiosensitivity (31) and/or the embryonal transcriptional cascade regulating anterior pituitary development (32). However, apart from GHD and insulin resistance, endocrinopathies were predicted more by hypothalamic involvement than treatment, supporting the idea that tumor mass causes primary hypothalamo-pituitary injury, and progression may thus cause further dysfunction.
We could identify no treatment modality as an independent risk factor for PPD, likely due to its rarity. However, all affected patients without PPD at diagnosis developed this exclusively in the immediate postoperative period, with greater than 50% reported as having only had biopsies or decompression procedures without significant resection. Its association with 46% of deaths in our cohort highlights the need for careful risk-benefit analysis of any surgery, even in the absence of major tumor excision.
CNS tumor–associated obesity is etiologically multifactorial (33). We demonstrate a previously unreported high prevalence in OP/HSGs (50% at 20 y), which, together with insulin insensitivity, is increased by radiotherapy. Although none of our patients developed frank type 2 diabetes, this may yet occur with longer followup (> 30 y) and incur consequential cardiovascular risks. Patients with posteriorly extensive, multiply progressive, metastatic or surgically resected tumors were most likely to experience visual loss or require educational support. The association between EMS and cognitive morbidity suggests that both are markers of increased hypothalamo-pituitary injury.
Therefore, in aiming to improve long-term outcomes for OP/HSGs, there is a precarious balance between preventing disease progression and minimizing long-term treatment toxicity. The suggested reduction in EEFS (particularly GHD) we observed with successive treatment eras is concerning given the lack of a corresponding improvement in survival. Due to concerns regarding early cranial irradiation exposure and cognitive dysfunction, chemotherapy was increasingly incorporated into treatment regimens to delay or avoid radiotherapy (34). Although radiotherapy has long been assumed to cause greater neuroendocrine toxicity, in our cohort it was only associated with GHD, GnD, and ACTHD, and not with CPP, TSHD, PPD, obesity, insulin resistance, visual, or cognitive dysfunction, the latter of which can occur even in the absence of radiotherapy (35). Modern focal radiotherapeutic techniques limiting exposure of healthy brain tissue have demonstrated less long-term neuroendocrine morbidity (36).
In our subcohort of biopsied patients, primary chemotherapy was associated with an increased likelihood of progression, confirming previous literature on chemotherapy's failure to stabilize disease and prevent visual deterioration (3, 10, 11). Primary resection reduced progression rates as previously reported (9–11). However, given the perioperative risk of PPD even with procedures not aimed at tumor resection and its possible association with mortality, attempts at resecting OP/HSGs must be carefully considered.
We thus postulate that failure of a first-line chemotherapeutic strategy in preventing OP/HSG progression necessitates multiple salvage surgical or radiotherapeutic interventions which can, together with tumor growth, compound neuroendocrine morbidity. Two other lines of evidence support this; firstly, the reduction in EEFS over time was largely GHD-specific and strongly predicted by radiotherapy, despite its less-frequent use; and secondly, the association between multiple surgeries and a worse EMS suggests failure to stabilize disease, thus necessitating repeated treatments. Furthermore, the improved cognitive outcomes seen after primary resection contrast with the increased visual and cognitive morbidity seen when surgery is part of the final treatment strategy, likely reflecting the ease of resectability—and hence cure or stabilization—of tumors selected for primary resection.
The protective effect of female sex on EMS and cognition are new unexplained findings requiring additional study. The only prior evidence for sexually dimorphic neuroendocrine outcomes is converse: female cranially irradiated medulloblastoma and leukemia survivors experience a greater radiation-induced cognitive decline (37, 38). Similarly, the association between nonwhite ethnicity and a reduced OS has never been described, possibly due to a lack of ethnicity data in multicenter international trials. It is unlikely to be due to differences in health care access given the similar times to diagnosis between groups, and may have an as-yet undefined genetic basis coding for more molecularly unfavorable tumors.
The retrospective nature of this study limits our findings. We assumed normal endocrine function without clinical or biochemical evidence to the contrary, which may underdiagnose endocrinopathies (24), as illustrated by the late GHD diagnosis, which may well have been an occult idiopathic GHD, already present pretreatment. The low incidence of endocrinopathies at diagnosis may reflect the difficulties of performing dynamic endocrine tests prior to oncological therapy, particularly to diagnose GHD and ACTHD. However, there was no change in the frequency of follow-up endocrine testing over successive eras. We also omitted primary endocrine dysfunction (three with autoimmune hypothyroidism, one with idiopathic primary ovarian failure) from our analyses as this was unlikely to be related to hypothalamo-pituitary injury.
Determining the degree of surgical resection achieved was difficult across treatment eras and between individual surgeons due to variations in the definition of terms such as “debulking,” “subtotal resection,” and “incomplete resection.” Only seven tumors (4.2%; four MDC 1 and three third ventricle tumors) were completely resected. We did not assess tumor invasiveness beyond documenting MDC stage, grade, metastases, and hydrocephalus, given that radiological parameters such as tumor volume, apparent diffusion coefficients or fractional anisotropy were impossible in the premagnetic resonance imaging era (39, 40). Although this is the largest OP/HSG-specific longitudinal neuroendocrine morbidity study to date, our cohort size still prevented subanalysis of the effect of degree of resection, radiotherapy doses, and various chemotherapy regimens on outcomes.
The third international LGG study (LGG3) is currently being designed and will, for the first time, collect prospective longitudinal neuroendocrine morbidity data as part of a randomized-controlled chemotherapeutic trial. Importantly, randomization will mandate tumor biopsy, and our data suggests that its affect on PPD and other neuroendocrine outcomes requires careful study. Although radiotherapy is not being considered for randomization, this may need careful consideration given the precision of modern irradiation techniques, a lack of evidence for the superiority of chemotherapy, and our observation that many of the neuroendocrinopathies observed are secondary to tumor location rather than irradiation exposure. The hierarchical, evolutionary nature of endocrine deficits over prolonged intervals suggests that early routine and lifelong endocrine followup is paramount in all these patients, for instance, to diagnose evolving GnD even in the presence of previous pubertal precocity. Longer-term subfertility, type 2 diabetes, and cardiovascular outcomes require more prolonged data collection and a paradigm shift from measuring the quantity of survival to prioritization of its quality, implicit in the British Neuro-oncology Society's recent recommendation that OP/HSGs be managed as a chronic disease rather than a classical malignancy (22).
Acknowledgments
We thank Miss Eirini Koutoumanou for her statistical support and advice, as well as Ms. Susan Hewitt and Ms. Elaine Perkins for their assistance in obtaining case notes, electronic records, and microfilms for data retrieval.
Author contributions: H.W.G. and H.A.S. were involved in study conception and design, data interpretation, and manuscript writing. H.W.G. was involved in data collection, coding, and statistical analysis. K.P. performed the registry search, provided tumor diagnosis, ethnicity and death registration data, as well as useful manuscript editions. K.A., M.N.G., and R.H. provided significant input and amendments to the manuscript. H.A.S. oversaw the whole project.
Funding: H.W.G.'s tuition fees for his MSc at University College London, of which this project was a part, were funded by The University College London Hospital (UCLH) Charity (SUCCESS Fund 0880). M.N.G. is supported by the National Institute for Health Research (NIHR) UCLH Biomedical Research Center.
Disclosure Summary: Authors have nothing to disclose.
Abbreviations
- ACTHD
ACTH deficiency
- CDI
central diabetes insipidus
- CI
confidence interval
- CNS
central nervous system
- CPP
central precocious puberty
- CSW
cerebral salt wasting
- EEFS
endocrine event-free survival
- EMS
endocrine morbidity score
- GHD
GH deficiency
- GnD
gonadotropin deficiency
- GOSH
Great Ormond Street Hospital for Children
- HR
hazard ratio
- LGG
low-grade glioma
- MDC
modified Dodge classification
- NF-1
neurofibromatosis type 1
- NS
nonsignificant
- OP/HSG
optic pathway, hypothalamic and suprasellar gliomas
- OS
overall survival
- PFS
progression-free survival
- PPD
posterior pituitary dysfunction
- SIADH
syndrome of inappropriate antidiuretic hormone secretion
- TSHD
TSH deficiency.
