


Abstract
Age-related hepatic fat accumulation increases the risk of cardiometabolic diseases, and the fibroblast growth factor (FGF) 21–resistant state caused by fatty liver underlies the pathogenesis of these diseases.
Previous studies suggested that a higher level of cardiorespiratory fitness was associated with both lower hepatic fat content and serum FGF21 levels; however, the effect of endurance exercise on hepatic fat content and serum FGF21 concentration has not been studied. Therefore, we aimed to elucidate whether endurance exercise reduced hepatic fat content and serum FGF21 levels.
This is a randomized crossover trial.
The study setting was an institutional practice.
Thirty-three elderly Japanese men participated in the study.
The intervention was a 5-week endurance exercise program comprising three cycle ergometer sessions per week.
Hepatic fat content was assessed by proton magnetic resonance spectroscopy, and serum FGF21 level was determined by ELISA.
A 5-week endurance exercise program decreased the hepatic fat content and serum FGF21 levels without weight loss, and the changes were higher in the exercise period than in the control period (P = .021 and P = .026, respectively). Correlation analysis demonstrated that only the change in hepatic fat content was significantly and positively correlated with change in serum FGF21 levels (r = 0.366, P = .006).
A 5-week endurance exercise program decreased hepatic fat content and serum FGF21 levels without weight loss in elderly men, and exercise-induced hepatic fat reduction mediated the reduction in serum FGF21 levels. These findings suggest that endurance exercise modulates hepatic fat content and FGF21 resistance, regardless of obesity status.
Ectopic fat accumulation in the liver increases the risk of developing type 2 diabetes mellitus and cardiovascular disease (1–3), and is observed in elderly subjects (4). The underlying mechanisms between the age-related increase in hepatic fat and the onset of cardiometabolic diseases have not been fully understood. However, recent studies have suggested that hepatic fat accumulation impairs the effects of fibroblast growth factor (FGF) 21 and thereby increases the risk for these chronic diseases in elderly people.
The hepatokine FGF21 plays a therapeutic role in obesity and metabolic homeostasis (5), whereas a high level of FGF21 at rest has been considered to represent an FGF21-resistant state that indicates impaired FGF21 response to target tissues (6, 7). It has been reported that higher hepatic fat content was strongly associated with higher serum FGF21 levels (8, 9) and that FGF21 resistance was exacerbated in older individuals (10, 11). Moreover, an elevated circulating FGF21 level was an independent predictor of type 2 diabetes (12, 13) and cardiovascular disease (14). These results therefore suggest that FGF21 resistance caused by hepatic fat accumulation is an important risk factor for cardiometabolic diseases, and it is likely that the risk of FGF21 resistance increases with age.
Previous studies revealed that a higher level of cardiorespiratory fitness acquired through regular endurance exercise was associated with both lower hepatic fat content (15, 16) and lower serum FGF21 levels (11). Although these results suggest that endurance exercise modulates hepatic fat content and FGF21 resistance, whether the exercise-induced change in hepatic fat substantially affects serum FGF21 concentration has not been evaluated. Moreover, there is no clear evidence that endurance exercise modulates age-related hepatic fat accumulation and FGF21 resistance in elderly subjects. Because Asian populations have a high risk of hepatic fat accumulation and FGF21 resistance despite lower body mass index (BMI) (11, 17–19), it is also important to examine whether endurance exercise reduces hepatic fat content and FGF21 resistance regardless of obesity status.
Therefore, the purpose of this study was to evaluate whether endurance exercise modulates hepatic fat content, resulting in improvement of the FGF21-resistant state in elderly Japanese men. This study provides key insights into how endurance exercise prevents the onset of the cardiometabolic diseases that are associated with FGF21 resistance.
Materials and Methods
Subjects
Thirty-three elderly Japanese men (aged 62–76 years) were recruited from temporary employment agencies. The subjects had no diagnosis of diabetes or cardiovascular disease and were free of hepatic diseases such as hepatic cancer, hepatitis, and nonalcoholic steatohepatitis; but two subjects had high levels of fasting glucose (≥126 mg/dl) at baseline. Four subjects (12.1%) were using lipid-lowering medication, and their medication status was not changed throughout the study. All participants provided written informed consent to participate before enrolling in the study, which was approved by the Ethics Committee of Waseda University. The study was conducted in accordance with the Declaration of Helsinki.
Study design
As shown in Figure 1, the study was a randomized crossover trial. The subjects were randomized by an independent observer to either a 5-week endurance exercise program or a control period during which they were instructed not to undertake any formal exercise or change their level of general physical activity. After 5 weeks, the subjects switched to the other regimen for 5 weeks. All subjects were free-living and were instructed to consume their habitual diet throughout the study. Measurements were performed to determine cardiorespiratory fitness, hepatic fat content, visceral fat area, sc fat area, other anthropometric characteristics and blood biochemical parameters at baseline (0 weeks), crossover (5 weeks), and at the end of the study (10 weeks). The measurements were performed at least 3 days after the previous exercise session in order to exclude the acute effects of exercise. Subjects refrained from medication on the morning of each measurement. Diet and nutritional intake were also assessed using a brief, self-administered diet history questionnaire. Daily physical activity, excluding the exercise program, was assessed using the International Physical Activity Questionnaire and expressed as metabolic equivalent minutes per week.
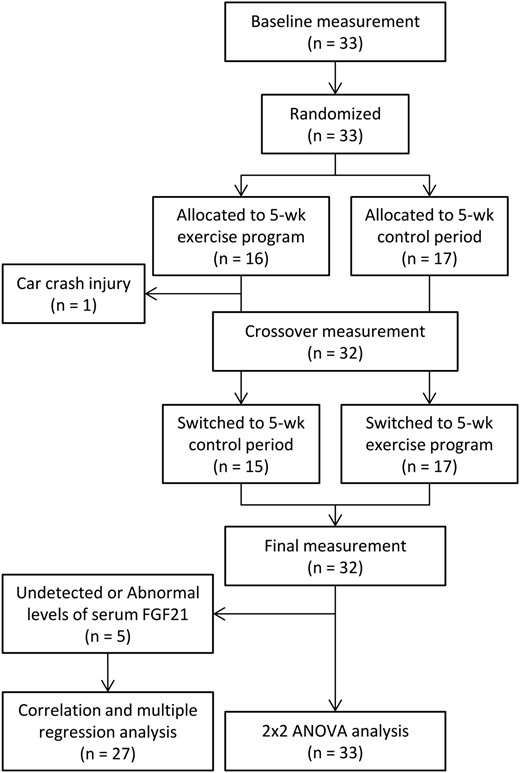
Flow diagram of the participants in the randomized crossover trial.
Cardiorespiratory fitness
Cardiorespiratory fitness was assessed via a maximal graded exercise test using a cycle ergometer (Aerobike 75XLII; Combi Wellness, Inc.) and quantified as the maximal oxygen uptake (VO2max). The graded cycle exercise began at a workload of 40–60 W, which was then increased by 30 W every 3 minutes until exhaustion. Heart rate and rating of perceived exertion were monitored each minute of measurement. During the exercise test, the participant's dyed gas was collected and the oxygen and carbon dioxide concentrations were measured and averaged over 30-second intervals using an automated gas analyzing system (Aeromonitor AE-310S; Minato Medical Science). The highest value of VO2 recorded during the exercise test was considered the VO2max (ml/kg/min).
Endurance exercise program
Participants undertook a supervised, progressive, 5-week aerobic exercise program, which met current guidelines for adult prescribed exercise (20). The exercise program comprised three cycle ergometer sessions per week. Exercise intensity gradually increased so that subjects exercised at a power output designed to elicit 60% of preexercise VO2max for week 1, 70% for weeks 2 and 3, and 75% for weeks 4 and 5. The exercise time was 30 minutes for weeks 1 and 2 and 45 minutes for weeks 3–5. At the first exercise session and when exercise intensity was increased, the exercise intensity was confirmed by measuring oxygen consumption for 5 minutes, beginning 5 minutes after the start of exercise.
Anthropometric characteristics
Body weight and body fat percentage (as assessed by bioelectrical impedance analysis) were measured using an electronic scale (Inner Scan BC-600; Tanita, Inc.); height was measured with a stadiometer (YL-65; YAGAMI, Inc.). BMI was calculated from measurements of height and body weight.
Magnetic resonance imaging and spectroscopy
Hepatic 1H magnetic resonance spectroscopy was performed using a 1.5 T whole-body scanner (Signa 1.5 T; General Electric, Inc.) with eight-channel body array coil. A single voxel (30 × 30 × 20 mm3) for spectroscopy was located in the right lobe of the liver, avoiding major blood vessels. Voxel shimming was performed to optimize the homogeneity of the magnetic field. The proton spectra of the liver were acquired using the point-resolved spectroscopy technique (repetition time = 3000 ms, echo time = 35 ms, 64 measurements, 1024 sample points). Acquisition was synchronized to the respiratory cycle and triggered at the end of expiration. Magnetic resonance spectroscopy data were quantified using LCModel, version 6.3. Fat content was defined as the signal intensities at 0.9, 1.3, and 1.6 ppm relative to the signal intensity of water at 4.7 ppm. The coefficient of variation between measurements was 2.0%.
The visceral fat and sc fat area were measured by magnetic resonance imaging, as described previously (11). The imaging conditions included a T1-weighted spin-echo and axial plane sequence with a slice thickness of 10 mm, a repetition time of 140 ms, and an echo time of 12.3 ms. The cross-sectional area of the visceral fat area and the sc fat area at the umbilical level was determined using image-analysis software (Slice-o-matic 4.3 for Windows; Tomovision). The coefficient of variation for the cross-sectional area at the umbilical level was 0.4%.
Blood sampling and analysis
The serum FGF21 concentration was determined using a commercially available ELISA kit (DF2100; R&D Systems, Inc.) according to the manufacturer's instructions. The detectable range of the assay was 31.3–2000 pg/ml. The intra- and interassay coefficients of variation reported by the manufacturer were 2.9–3.9% and 5.2–10.9%, respectively.
Statistics
All statistical analyses were performed using SPSS, version 22.0 (SPSS, Inc.). The Kolmogorov-Smirnov test was performed to assess the normality of data distribution, and nonnormally distributed data were log-transformed before analysis. Changes in VO2max, hepatic fat content, visceral fat area, sc fat area, and other anthropometric and blood biochemical variables during the exercise program and control period were compared using 2 × 2 crossover ANOVA. The model consisted of the within-subject factor “treatment” (exercise, control) and the between-subject factor “sequence” (exercise–control, control–exercise). Differences in physical activity level and dietary intakes at baseline, 5 weeks, and 10 weeks were assessed by repeated one-way ANOVA (for normally distributed data) or Friedman's test (for nonnormally distributed data). Relationships between changes in all variables during exercise and control periods were determined by Pearson's correlation coefficients, and partial correlation analysis adjusted for age and FGF21 at baseline, and for changes in visceral fat area and VO2max. Linear multiple regression analysis was also performed to determine whether variables change mediate the change in serum FGF21 level. Model 1 included program allocation and baseline serum FGF21 level. Model 2 added the change in intrahepatic fat, and then model 3 added age and the changes in VO2max and visceral fat area. All measurements and calculated values are presented as the means ± SD (for normally distributed data) or median (interquartile range) (for nonnormally distributed data) values. The level of statistical significance was set at P < .05.
Results
Baseline characteristics of the subjects are shown in Table 1. One subject did not complete the exercise program because he was injured in a car crash that was not related to this study. The FGF21 data from five subjects were not used because they exhibited extreme levels of serum FGF21 (FGF21 level beyond the range of 31.3–2000 pg/ml) or changes in serum FGF21 level exceeding 2 standard deviations from the baseline FGF21 level during intervention. Therefore, full data were obtained for a total of 27 participants. The missing values were replaced by mean values, and 2 × 2 crossover ANOVA was performed using the data from 33 participants (Figure 1).
Baseline Characteristics of the Subjects (n = 33)
| Variables | |
|---|---|
| Age (y) | 69.6 ± 4.2 |
| Height (cm) | 166.2 ± 5.5 |
| Body weight (kg) | 64.0 ± 8.9 |
| BMI (kg/m2) | 23.1 ± 2.6 |
| Body fat (%) | 21.2 ± 5.0 |
| Visceral fat area (cm2) | 102.6 ± 42.5 |
| sc fat area (cm2) | 114.3 ± 40.1 |
| VO2max (ml/kg/min) | 24.3 ± 4.7 |
| Intrahepatic fat (%) | 3.3 (1.7–6.0) |
| AST (IU/liter) | 25.0 (20.0–29.0) |
| ALT (IU/liter) | 20.0 (15.0–31.0) |
| γ-GTP (IU/liter) | 33.0 (21.0–49.0) |
| Triglyceride (mg/dl) | 121.1 ± 65.6 |
| FFA (mEq/liter) | 0.6 ± 0.3 |
| Fasting glucose (mg/dl) | 94.0 (89.0–106.0) |
| HbA1c (%) | 5.4 ± 0.4 |
| Fasting insulin (μU/ml) | 7.2 ± 4.2 |
| HOMA-IR | 1.7 (0.7–2.5) |
| FGF21 (pg/ml) | 255.9 (197.4–339.3) |
Abbreviations: ALT, alanine aminotransferase; AST, aspartate aminotransferase; γ-GTP, γ-glutamyl transpeptidase; HOMA-IR, homeostasis model assessment of insulin resistance.
Data are mean ± SD or median (interquartile range) values.
The changes in variables during the 5-week endurance exercise and control periods are summarized in Table 2. We compared the absolute values of changes in each variable between the exercise and control periods using 2 × 2 crossover ANOVA for the factors, treatment, and sequence. The 5-week endurance exercise increased VO2max, and the absolute change in VO2max was higher in the exercise period than in the control period. In contrast, the 5-week endurance exercise decreased hepatic fat content and serum FGF21 levels, and absolute changes in the exercise period were higher than in the control period (Figure 2 and Table 2). We did not detected a significant interaction between treatment and sequence for VO2max, intrahepatic fat and serum FGF21 level, indicating no carryover effects because of the sequence of the experiment. Among blood biochemical parameters, HbA1c levels were significantly different between the exercise and control periods. However, a significant interaction between treatment and sequence for HbA1c was detected. This suggests that the carryover effect of the sequence of the experiment might have influenced the result.
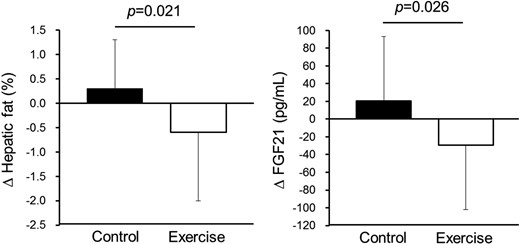
Changes in hepatic fat content and serum FGF21 level during the control and exercise periods.
Data are reported as mean ± standard deviation. P-values were obtained by 2 × 2 crossover ANOVA for the factor treatment.
Changes in the Variables During 5-Week Control and Training Periods
| Control | Exercise | Pa | |||||
|---|---|---|---|---|---|---|---|
| Pre | Post | ⊿ | Pre | Post | ⊿ | ||
| Body weight (kg) | 64.1 ± 9.0 | 64.1 ± 8.6 | 0.0 ± 0.9 | 64.0 ± 8.8 | 64.0 ± 9.1 | 0.0 ± 0.8 | .881 |
| BMI (kg/m2) | 23.1 ± 2.5 | 23.1 ± 2.5 | 0.0 ± 0.4 | 23.1 ± 2.5 | 23.0 ± 2.6 | –0.1 ± 0.4 | .750 |
| Body fat (%) | 20.9 ± 5.2 | 21.2 ± 5.3 | 0.3 ± 2.0 | 21.4 ± 5.3 | 20.8 ± 4.9 | –0.6 ± 2.6 | .346 |
| VO2max (ml/kg/min) | 26.3 ± 4.4 | 25.0 ± 4.3 | –1.0 (–1.8–0.0) | 24.5 ± 4.1 | 27.1 ± 4.6 | 2.1 (0.8–3.7) | <.001 |
| Visceral fat area (cm2) | 102.3 ± 44.0 | 103.5 ± 44.7 | 1.6 (–4.8–5.8) | 103.3 ± 43.2 | 102.5 ± 44.5 | 0.2 (–6.6 to 6.0) | .816 |
| sc fat area (cm2) | 115.3 ± 41.8 | 112.7 ± 39.0 | –2.5 ± 14.7 | 114.4 ± 37.8 | 114.6 ± 42.7 | 0.2 ± 18.8 | .440 |
| Intrahepatic fat (%) | 2.7 (1.5–5.6) | 2.9 (1.8–6.4) | 0.3 ± 1.2 | 2.9 (1.7–6.5) | 2.3 (1.3–5.4) | –0.6 ± 1.4 | .021 |
| AST (IU/liter) | 26.6 ± 8.6 | 28.2 ± 10.2 | 1.6 ± 4.6 | 28.5 ± 13.8 | 26.5 ± 8.7 | –2.0 ± 7.5 | .067 |
| ALT (IU/liter) | 20.0 (16.0–28.5) | 19.0 (15.5–28.0) | –1.0 (–3.5 to 2.0) | 19.0 (16.0–31.5) | 19.0 (15.5–25.5) | –2.0 (–4.5 to 1.5) | .416 |
| γ-GTP (IU/liter) | 32.0 (21.5–46.0) | 29.0 (20.0–47.0) | –2.0 (–4.0–1.4) | 33.0 (21.0–51.5) | 31.0 (21.5–42.5) | –2.0 (–5.5 to 1.0) | .447 |
| Triglyceride (mg/dl) | 115.5 ± 63.8 | 115.9 ± 74.4 | 0.4 (–21.5 to 19.5) | 122.2 ± 74.1 | 111.7 ± 66.2 | –6.0 (–19.0 to 11.0) | .843 |
| FFA (mEq/liter) | 0.6 ± 0.2 | 0.5 ± 0.2 | –0.1 ± 0.2 | 0.6 ± 0.2 | 0.6 ± 0.2 | 0.0 ± 0.2 | .721 |
| Fasting glucose (mg/dl) | 94.0 (88.0–106.5) | 96.0 (91.0–107.5) | 1.3 ± 6.0 | 97.0 (91.5–108.5) | 99.0 (93.0–106.5) | –0.7 ± 6.4 | .267 |
| HbA1c (%) | 5.4 ± 0.4 | 5.5 ± 0.4 | 0.1 ± 0.1 | 5.5 ± 0.4 | 5.4 ± 0.4 | –0.1 ± 0.2 | .013 |
| Fasting insulin (μU/ml) | 7.0 ± 4.3 | 6.1 ± 4.1 | –0.9 ± 2.2 | 7.0 ± 4.2 | 7.0 ± 4.2 | 0.0 ± 2.9 | .194 |
| HOMA-IR | 1.6 (0.8–2.3) | 1.0 (0.7–2.0) | –0.2 ± 0.6 | 1.4 (0.8–2.4) | 1.5 (0.8–2.3) | 0.0 ± 0.8 | .349 |
| FGF21 (pg/ml) | 231.6 ± 81.6 | 252.0 ± 98.5 | 20.4 ± 65.5 | 248.1 ± 88.5 | 218.5 ± 94.2 | –29.6 ± 65.1 | .026 |
Abbreviations: ALT, alanine aminotransferase; AST, aspartate aminotransferase; γ-GTP, γ-glutamyl transpeptidase; HOMA-IR, homeostasis model assessment of insulin resistance.
Data are mean ± SD (for normally distributed data) or median (interquartile range) (for nonnormally distributed data) values. Nonnormally distributed data were log-transformed before analysis. Boldface indicates significance (P < .05).
P values were obtained by 2 × 2 crossover ANOVA for the factor treatment.
We also examined daily physical activity level and dietary intakes in study subjects at baseline, after 5 weeks, and at the final measurements. Physical activity level, total energy intake, alcohol intake, and macronutrient intakes were not statistically changed during the 10-week intervention in both the immediate- and delayed-exercise groups (Supplemental Table 1).
To identify the factors determining the change in serum FGF21 levels during intervention, we examined the correlations between absolute changes in each variable during exercise and control periods. As shown in Table 3 and Figure 3, only the change in hepatic fat content was significantly and positively correlated with changes in serum FGF21 levels, and the significant relationship remained even after adjustments for age, baseline serum FGF21 level, and the changes in VO2max and visceral fat area (Table 3). Changes in other anthropologic and blood biochemical parameters were not significantly correlated with changes in serum FGF21 levels.
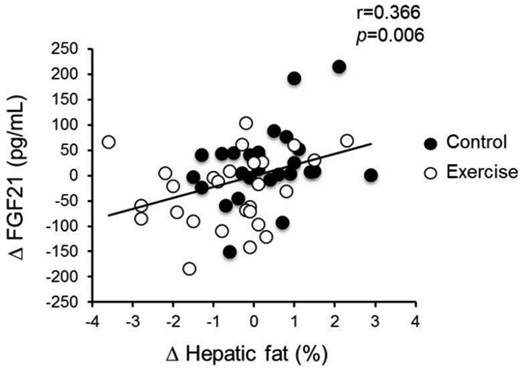
Correlation of changes in hepatic fat content and serum FGF21 level during the control and exercise periods.
Correlation of Changes in Serum FGF21 Level and Other Variables
| Variables | ⊿FGF21 | Adjusted ⊿FGF21 | ||
|---|---|---|---|---|
| r | P | r | P | |
| ⊿Body weight (kg) | 0.065 | .641 | 0.160 | .269 |
| ⊿BMI (kg/m2) | 0.036 | .795 | 0.132 | .361 |
| ⊿Body fat (%) | 0.223 | .105 | 0.211 | .141 |
| ⊿VO2max (ml/kg/min) | −0.179 | .196 | ||
| ⊿Visceral fat area (cm2) | −0.184 | .183 | ||
| ⊿sc fat area (cm2) | −0.030 | .828 | −0.009 | .951 |
| ⊿Intrahepatic fat (%) | 0.366 | .006 | 0.321 | .023 |
| ⊿AST (IU/liter) | 0.166 | .229 | 0.184 | .200 |
| ⊿ALT (IU/liter) | 0.111 | .423 | 0.122 | .397 |
| ⊿γ-GTP (IU/liter) | −0.147 | .288 | −0.086 | .551 |
| ⊿Triglyceride (mg/dl) | −0.250 | .068 | −0.207 | .150 |
| ⊿FFA (mEq/liter) | −0.036 | .795 | −0.114 | .431 |
| ⊿Fasting glucose (mg/dl) | 0.073 | .601 | 0.089 | .540 |
| ⊿HbA1c | 0.141 | .309 | 0.116 | .424 |
| ⊿Fasting insulin (μU/ml) | 0.030 | .829 | 0.042 | .770 |
| ⊿HOMA-IR | 0.018 | .899 | 0.030 | .834 |
Abbreviations: ALT, alanine aminotransferase; AST, aspartate aminotransferase; γ-GTP, γ-glutamyl transpeptidase; HOMA-IR, homeostasis model assessment of insulin resistance.
Data are Pearson's correlation coefficients. VO2max, visceral fat area, ALT, γ-GTP, triglyceride, and HbA1c were converted to log scale. Pearson partial correlation coefficient analysis adjusted for age and baseline serum FGF21 level, ⊿VO2max and ⊿visceral fat area. Boldface indicates significance (P < .05).
In addition, linear multiple regression analysis was performed to elucidate the factors independently associated with the change in serum FGF21 (Supplemental Table 2). Model 1 showed that the change in serum FGF21 was significantly associated with program allocation (β = −0.314, P = .019), but not baseline serum FGF21 level (β = −0.189, P = .152). In model 2, which added the change in intrahepatic fat, the significant effect of the allocation was lost (β = −0.221, P = .107), whereas there was significant association between the changes in serum FGF21 level and intrahepatic fat (β = 0.273, P = .047). Model 3 included age, the changes in visceral fat area, and VO2max. Although model 3 was not significantly associated with any variable, the strongest association was observed with the change in intrahepatic fat (β = 0.259, P = .073).
Discussion
The main findings of the present study were that a 5-week endurance exercise intervention decreased hepatic fat content without weight loss in elderly Japanese men, and change in serum FGF21 level was positively correlated only with change in hepatic fat content. These findings suggest that regular endurance exercise improves FGF21 resistance by decreasing hepatic fat content regardless of obesity status and age. Age-related accumulation of hepatic fat content is strongly associated with metabolic disorder even in nonobese subjects (4, 17, 18), and elevated serum FGF21 level was a strong predictor of cardiometabolic diseases (12–14). Therefore, our finding may contribute to the prevention of age-related cardiometabolic diseases in nonobese elderly people.
Previous cross-sectional studies suggested that serum FGF21 level was independently associated with cardiorespiratory fitness level, BMI, visceral fat area, and hepatic fat content (8, 9, 11, 21). Only a study conducted by Yang et al reported that a 3-month combined exercise program (endurance exercise + resistance exercise) significantly decreased serum FGF21 levels in overweight middle-aged women (22). Although their study subjects had a significant loss in BMI during the intervention, Yang et al did not evaluate cardiorespiratory fitness, visceral fat area, or hepatic fat content, which may be key determinants of circulating FGF21 level (22). Therefore, evidence was lacking about the factors regulating the exercise-induced change in serum FGF21 level. In the present study, we showed that although the 5-week endurance exercise increased VO2max and decreased hepatic fat content, the reduction in serum FGF21 levels was significantly associated with a decrease in the hepatic fat content, but not changes in other adiposity indices such as body fat percentage and sc and visceral fat areas. This result suggests that hepatic fat content is a dominant factor determining short-term, exercise-induced reduction in serum FGF21 levels.
FGF21 is predominantly expressed in the liver (23), and it stimulates hepatic fatty acid oxidation (24), adipose tissue glucose uptake (25), adipose thermogenic gene expression, and browning of white adipose tissue (26) via classic FGF receptors complexed with β-klotho in an endocrine or autocrine/paracrine manner (27–30). Because it has been documented that impairments of FGF21 receptors in the liver of obese mice have important roles in FGF21 resistance development (6, 7), hepatic fat accumulation might also impair the beneficial effects of FGF21 in the liver and white adipose tissue, leading to an increased cardiometabolic risk. Interestingly, an animal study reported that drug-induced hepatic fat reduction enhanced phosphorylation of hepatic AMP-activated protein kinase (AMPK), which was highly correlated with reduction of circulating FGF21 level (31). Another study demonstrated that vegetable extract reduced hepatic triglyceride as well as increased AMPK/sirtuin (SIRT) 1 signaling and FGF receptors 1, 3, and 4 (32). These results were in agreement with exercise-induced beneficial effects in the liver. Indeed, chronic endurance exercise was reported to induce AMPK activation and SIRT1 expression in the liver of obese mice (33). Therefore, it is likely that endurance exercise modulates hepatic fat content and AMPK/SIRT1 signaling, thereby improving FGF21 resistance, which may be partly due to upregulation of FGF receptors.
Although we previously reported that high cardiorespiratory fitness was significantly associated with lower serum FGF21 levels independently of indices of adiposity such as visceral fat area in middle-aged and elderly Japanese men (11), the present study demonstrated that endurance exercise–induced decrease in serum FGF21 level was determined by the reduced hepatic fat content rather than the elevated cardiorespiratory fitness in elderly men. Several studies reported that a high level of cardiorespiratory fitness was independently associated with low hepatic fat content (15, 16), and we also confirmed that endurance exercise modulated both cardiorespiratory fitness level and hepatic fat content. Therefore, the association between cardiorespiratory fitness and serum FGF21 level in our previous cross-sectional study might be mediated in part by hepatic fat content. Although the elevation of cardiorespiratory fitness caused by the short-term intervention was not associated with decrease in serum FGF21 level in the present study, epidemiologic studies indicated that long-term maintenance of a high cardiorespiratory fitness level is strongly associated with reduced risk of cardiometabolic diseases (34, 35), which may be explained in part by the prevention of FGF21 resistance. Therefore, we cannot rule out the possibility that long-term maintenance of high cardiorespiratory fitness level by endurance exercise improves FGF21 resistance and prevents onset of cardiometabolic diseases. Long-term exercise intervention or epidemiologic studies focusing on longitudinal changes in cardiorespiratory fitness and circulating FGF21 level are needed to address this issue.
It was shown that the circulating FGF21 level was increased by acute endurance exercise, and that the temporary increase might be associated with an increase in circulating FFA (36). FFAs induce peroxisome proliferator–activated receptor (PPAR), which leads to transcriptional upregulation of FGF21 (24). Therefore, the acute increase in serum FGF21 appears to be regulated by FFA that may be released from FFA storage in adipose tissue. On the other hand, it was reported that regular aerobic exercise tends to reduce the release of FFA from adipose tissue during submaximal exercise (37), and regular endurance exercise did not change serum FFA levels in the present study (Table 2). Because there was also no association between the changes in lipid metabolites and serum FGF21 level (Table 3), regular exercise may have a different effect on circulating FGF21 concentrations to acute exercise. In addition, the effects of acute exercise on serum FGF21 levels in elderly subjects have not been evaluated and thus it needs to be determined whether the FGF21 induction seen in young adults is also observed in older individuals.
Our multiple regression analysis revealed that hepatic fat content was a strong independent predictor of serum FGF21, whereas the statistical significance decreased in model 3 analysis (Supplemental Table 2). The results suggest the existence of other regulatory factors for FGF21 resistance that may be involved in unknown mechanisms. Although it has been difficult to precisely predict the other underlying factors, it was reported that serum FGF21 showed a circadian rhythm and that the FGF21 rhythm was blunted in obese individuals (38). The results suggested that the secretion defect was associated with an FGF21-resistant state; however, it has not been evaluated whether the impaired secretory function was associated with the FGF21-resistant state and cardiometabolic risk. Because FGF21 was identified as a secretory adipokine, myokine, and hepatokine (5, 39), there is a possibility that regular exercise modulates FGF21 secretory function in these organs, resulting in improved FGF21 resistance. Although the change in FFA was not associated with the change in serum FGF21 in the present study (Table 3), the FGF21 secretory function may be regulated by PPARs in response to FFA over a period of 1 day. Thus, the response may be affected by crosstalk with FGF21 secretory organs. Further studies are needed to determine the association between FGF21 resistance and secretion defect and the effects of regular exercise on FGF21 secretory function in adipose tissue, skeletal muscle, and liver.
The present study has several limitations. First, our sample size was relatively small, which might have led to type 2 errors. Second, our study included only male subjects. Hamaguchi et al reported that incidence of nonalcoholic hepatic steatosis was sharply increased with aging, particularly in premenopausal women (40). Therefore, further investigation is needed to confirm our findings in older women. Third, we used a short-term endurance exercise program to examine the changes in hepatic fat and serum FGF21 level without weight loss. It is unclear whether long-term prospective cohort studies will support our finding that endurance exercise and/or physical activity can prevent a FGF21-resistant state. In addition, our results did not show a significant improvement in glucose metabolism, and it was not evaluated whether the improved FGF21 resistance was associated with peripheral glucose metabolism. The association of FGF21 resistance with peripheral glucose metabolism should be examined using standard methods such as the insulin clamp technique.
In conclusion, the present study revealed that a 5-week endurance exercise program decreased hepatic fat content and serum FGF21 levels without weight loss in elderly Japanese men, and that an endurance exercise-induced reduction of serum FGF21 level was mediated by reduction of hepatic fat content. These findings suggest that endurance exercise improves FGF21 resistance without weight loss and provides new evidence that exercise itself rather than weight loss has beneficial effects on the prevention of age-related cardiometabolic diseases.
Acknowledgments
We thank Satomi Oshima and Tomoko Ito for their assistance and are grateful to all subjects for their participation in this study.
This work was supported by a Grant-in-Aid for JSPS Fellows from the Ministry of Education, Culture, Sports, Science, and Technology (to K.T.); Waseda University Grant 2014B-419 for Special Research Projects (to M.H.); a grant for strategic research initiatives (Paradigm Shifts in a Superaged Society) from Waseda University (to M.H.); MEXT-Supported Program for the Strategic Research Foundation at Private Universities, 2015-2019 from the Ministry of Education, Culture, Sports, Science, and Technology (S1511017 to M.H.); and the Council for Science, Technology and Innovation, “Technologies for Creating Next-Generation Agriculture, Forestry and Fisheries” (funding agency: Bio-oriented Technology Research Advancement Institution).
This study is registered with University Hospital Medical Information Network in Japan under registration No. 000018374.
Disclosure Summary: The authors have nothing to disclose.
H.T. and K.T. contributed equally to this work.
Abbreviations
- AMPK
AMP-activated protein kinase
- BMI
body mass index
- FFA
free fatty acid
- FGF
fibroblast growth factor
- HbA1c
glycosylated hemoglobin
- PPAR
peroxisome proliferator–activated receptor
- SIRT
sirtuin
- VO2max
maximal oxygen uptake.
