


Longevity is associated with changes in circulating levels of thyroid hormone (TH) and/or TSH in animals and humans, but underlying mechanisms remain elusive.
We explored in 38 offspring of nonagenarian participants from the Leiden Longevity Study, who are enriched for longevity and in their partners, ultradian and circadian rhythmicity of TSH, temporal relationship, and feedback and forward interplay between TSH and TH.
We collected blood samples every 10 minutes for 24 hours for TSH and TH profiles. We used a deconvolution analysis to estimate basal (nonpulsatile), pulsatile, and other secretion parameters to characterize ultradian rhythmicity and locally weighted polynomial regression of TSH to assess circadian rhythmicity. A cross-correlation analysis was used to investigate the temporal relationship between TSH and TH and cross-approximate entropy to assess feedback and forward interplay between TSH and TH.
Compared with partners, offspring displayed higher mean (95% confidence interval [CI]) basal TSH secretion (34.3 [95% CI 27.2–43.1] mU/L per 24 hours vs 18.5 [95% CI 14.4–23.7] mU/L per 24 hours, P = .001) but no differences in ultradian or circadian properties of TSH. The temporal relationship between TSH and free T3 at zero delay was higher in offspring (0.48 ± 0.2) compared with partners (0.26 ± 0.4) (P = .05), but the feedback and forward interplay between TSH and TH did not differ.
Familial longevity is associated with increased basal TSH secretion and a strong temporal relationship between TSH and free T3 but not with differences in ultradian or circadian TSH rhythmicity or feedback and forward interplay between TSH and TH.
TSH secretion is regulated by the stimulatory hormone TRH and inhibitory hypothalamic factors, including dopamine and somatostatin, whereas secreted thyroid hormones inhibit TRH and TSH secretion via a negative feedback loop. TSH stimulates the thyroid gland to synthesize and secrete thyroid hormones (THs) in the circulation. One hundred percent of circulating T4 is secreted by the thyroid gland; however, only 20% of T3 is derived from this source (1). In peripheral tissues T4 is metabolized to T3 by the removal of an iodide atom by deiodinating enzymes or to inactive rT3 and further degradation products. TSH has a distinct circadian rhythm with its maximum between 2:00 and 4:00 am and its nadir between 4:00 and 8:00 pm. Recent data indicate that free T3 (fT3) also has a circadian rhythm following that of TSH with a lag time of 90 minutes (1). In humans, TSH secretion is pulsatile, which accounts for the circadian variation in the TSH levels (2) because the frequency and amplitude of pulsations increase during the evening and reach a peak at the sleep onset (3). It has been proposed that pulses are generated by a TSH pulse generator; however, anatomical and functional details of the pulse generator are unknown (4). Nevertheless, this system is known to be robust and stable under different conditions including hypothyroidism (5).
Longevity has been associated with changes in circulating levels of free T4 (fT4), fT3, and/or TSH in animal models and in humans (6). Centenarians had significantly higher TSH levels as did their offspring when compared with controls (7). In the Leiden Longevity Study (LLS), we observed among nonagenarians that those from families with the most prominent excess survival had higher serum TSH levels and lower fT3 and fT4 levels (8). Moreover, offspring of nonagenarian LLS participants (offspring) displayed higher TSH levels than age-matched partner controls (partners) and slightly lower fT3 in a fasted morning sample (6). When TSH and THs were frequently measured over a 24-hour period, TSH concentration was on average 0.8 mU/L higher on every time point in offspring compared with partners, but there were no differences in THs (9). Underlying mechanisms for the increased TSH secretion and the discrepancy between increased TSH secretion but comparable circulating TH levels are unknown. Previously, adverse conditions including aging have been associated with changes in the ultradian and circadian rhythmicity of TSH (10, 11). However, no research has been performed on the ultradian and circadian rhythmicity of TSH or on the discrepancy between increased TSH secretion but unchanged circulatory TH levels in relation with familial longevity.
We aimed to explore in offspring of nonagenarian LLS participants who had at least one sibling who was long lived as well and who are therefore enriched for familial longevity and in the offsprings' partners the following: 1) the ultradian rhythmicity of TSH, 2) the circadian rhythmicity of TSH, 3) the temporal relationship between TSH and TH, and 4) the feedback and forward interplay between TSH and TH.
Materials and Methods
Study population
As previously described in more detail (12), the LLS is a family-based study consisting of 421 families with at least two long-lived Caucasian siblings fulfilling the age criteria (women aged ≥ 91 y and males aged ≥ 89 y), without any selection on demographics or health. In the current study, we investigated 20 offspring of nonagenarian LLS participants (offspring) together with 18 partners who did not have parents fulfilling the LLS inclusion criteria and with whom the offspring share their life serving as a matched control group (partners). All participants were middle aged (55–78 y) and had a stable body mass index (BMI) between 19 and 33 kg/m2 (weight changes ≤ 5 kg within the last 3 mo) and women did not use estrogen replacement. Participants were excluded if they had significant chronic renal, hepatic, or endocrine disease including thyroid disorders and diabetes mellitus or if they used medication known to influence lipolysis, thyroid function, glucose metabolism, GH/IGF-1 secretion, or any other hormonal axis. To be able to safely perform the 24-hour blood sampling, participants were excluded based on presence of anemia (hemoglobin < 7.1 mmol/L), blood donation within the last 2 months, recent transmeridian flights, smoking addiction, consumption of more than 21 U of alcohol per week, or extreme diet therapies. In The Netherlands, 1U of an alcoholic beverage is defined as a standard drink containing 9.9 g of ethanol. Based on information obtained via telephone screening, partners with one or more parents fulfilling the LLS inclusion criteria were also excluded. The current study is part of the Switchbox Leiden Study protocol P11.116, which was approved by the Medical Ethical Committee of the Leiden University Medical Centre and was performed according to the Declaration of Helsinki. All participants gave written informed consent for participation.
Clinical protocol
The study commenced at 8:00 am with the iv insertion of a catheter in the forearm of the nondominant hand. Blood sampling started at 9.00 am, and blood was withdrawn every 10 minutes for 24 hours. All participants received standardized feeding at three fixed times during the day (between 9:00 and 10:00 am, 12:00 and 1:00 pm and 6:00 and 7:00 pm), each consisting of 600 kcal Nutridrink (Nutricia Advanced Medical Nutrition). Lights were switched off between 11:00 pm and 8:00 am. No naps were allowed during the day and ambulation was limited to the bathroom only. Full details on the 24-hour blood sampling procedure are described elsewhere (13).
Assays and assay performance
Measurements were performed at the Department of Clinical Chemistry and Laboratory Medicine of Leiden University Medical Center, which is accredited according to the National Coordination Committee for Quality Assurance for Health Care Laboratories in The Netherlands using fully automated equipment and diagnostics from Roche Diagnostics and Siemens Healthcare Diagnostics. TSH and TH were measured in serum samples by an electrochemoluminescence immunoassay using a Modular E170 immunoanalyzer (Roche Diagnostics; catalog numbers TSH 11731459 122, FT4 gen II 06437281 190, and FT3 03051986 190). Antithyroid peroxidase antibodies (anti-TPO Abs) were measured using an Immulite 2000 Xpi Immunoassay system (catalog number anti-TPO Ab L2KTO2). The TSH method has been standardized against the second International Reference Preparation World Health Organization reference standard 80/558. The limits of detection were, respectively, 0.005 mU/L for TSH, 0.3 pmol/L for fT4, 1 pg/mL for fT3, and 5.0 IU/mL for anti-TPO Abs. For each participant, all samples from one time series were measured within the same lot number and in the same batch. For this study, the precision and quality of all assayed analytes met or surpassed the level of desirable quality specifications (14). For TSH, fT4 and fT3 Randox controls (catalog numbers IA 3109 and IA 3111) were used to determine the coefficients of variation. The coefficients of variation in our study ranged between 1.41% and 4.16% for TSH, between 2.41% and 3.49% for fT4, between 2.16% and 2.91% for fT3, and between 7% and 9% for anti-TPO Abs. In our laboratory the reference values for TSH are 0.3–4.8 mU/L, for fT4 10–24 pmol/L, for fT3 3–8 pmol/L, and for anti-TPO Ab less than 35 IU/mL.
Deconvolution analyses
The TSH hormone concentration time series were analyzed using a validated deconvolution method (15), with an automated Matlab program (the Mathworks, Inc). The first step was to detrend the data and normalize concentrations to the unit interval (0,1). Thereafter successive potential pulse-time sets, each containing one fewer burst, were created by a smoothing process. Lastly, a maximum-likelihood expectation deconvolution method estimated all secretion and elimination rates simultaneously for each candidate pulse-time set. The outcome parameters of main interest are basal and pulsatile secretion, the sum of both (the total secretion), pulse frequency (number of pulses per 24 h), mean pulse mass, and the regularity of the burst intervals (Weibull-γ).
Circadian rhythmicity
We derived the circadian parameters from a locally weighted polynomial regression analysis, developed by Devlin (16). The software program Matlab (the Mathworks, Inc) was used to compute the locally weighted polynomial regression fitting (with span = 0.2). We defined the acrophase of TSH as the time point at which TSH reaches its highest point (maximum) in the early phase of the night. The nadir of TSH was defined as the lowest point (minimum) in the evening after which the nocturnal surge of TSH starts. The circadian timing refers to the clock time of the nadir. The amplitude was calculated as the difference between the minimum and the maximum TSH levels in the early phase of the night.
Cross-correlation
Cross-correlation was used to quantitate the temporal relationship between pairs of hormones (TSH-fT4 and TSH-fT3). The cross-correlation analysis assesses the strength between two signals from a hormone pair for all possible time shifts.
Cross-approximate entropy (ApEn)
Cross-ApEn is a bivariate, scale-, and model-independent two-variable regularity statistic used to quantitate the relative pattern synchrony of coupled hormone series (17). With high sensitivity and specificity cross-ApEn of fT4-TSH reflects changes in the feedback synchrony and cross-ApEn of TSH-fT4 reflects changes in the feedforward synchrony (17, 18).
Statistical analysis
A χ2 test and an independent t test were used to describe differences between offspring and partners regarding sex, age, age of the parents, body composition, medical history, medication, lifestyle, and mean 24-hour parameters of TSH and TH. All other analyses were performed using linear regression adjusted for age, sex, and BMI to investigate differences between offspring and partners unless otherwise indicated. All the data are presented as geometric means with 95% confidence intervals (CI). Logarithmic transformation of data that were not normally distributed was used to decrease the variation.
For all above-mentioned analyses, SPSS for Windows, version 20 (SPSS Inc) was used. Graphs were made using GraphPad Prism version 5 (GraphPad Inc). P ≤ .05 was considered statistically significant.
Results
Group characteristics
Study characteristics of offspring and partners are presented in Table 1. The parents of the offspring were older than those of the partners, a difference that was significant for the mothers (P = .001). Offspring and partners were of similar age and had comparable body composition. No differences in disease history and medication use were observed between the groups. There was no difference in mean (95% CI) fasted serum leptin levels between offspring and partners adjusted for age, sex and BMI (10.3 [8.1–13.1] μg/L vs 10.4 [8.0–13.3] μg/L, P = .99). Significantly increased mean 24-hour TSH levels, but no differences in mean 24-hour fT4 and fT3 levels, were found in the offspring compared with the partners.
Group Characteristics of 20 Offspring From Nonagenarian LLS Participants and 18 Partners Thereof
| Offspring (n = 20) | Partners (n = 18) | P Value | |
|---|---|---|---|
| Demographics | |||
| Male n, % | 10 (50.0) | 10 (55.6) | .73 |
| Age, y | 65.6 (5.4) | 64.6 (4.9) | .52 |
| BMI, kg/m2 | 25.4 (4.0) | 25.5 (3.9) | .91 |
| Fat mass, kga | 23.5 (7.1) | 23.7 (7.8) | .93 |
| Fat-free mass, kga | 51.3 (12.0) | 52.5 (11.4) | .75 |
| Parental characteristics | |||
| Age of mother, y | 92.4 (7.9) | 78.6 (13.9) | .001 |
| Age of father, y | 82.5 (18.9) | 76.8 (9.2) | .25 |
| Medical history | |||
| Cardiovascular disease, n, % | 0 (0) | 1 (5.5) | .29 |
| Medication | |||
| Statins, n, % | 0 (0) | 1 (5.6) | .29 |
| Antihypertensives, n, % | 3 (15.0) | 2 (11.1) | .72 |
| Lifestyle | |||
| Smoking current, n, % | 0 (0) | 1 (5.6) | .29 |
| Alcohol > 21 U/wk, n, % | 1 (5.0) | 2 (11.1) | .49 |
| Thyroid parameters | |||
| Mean 24-h TSH, mU/L | 2.4 (1.2) | 1.5 (0.6) | .006 |
| Mean 24-h fT4, pmol/L | 14.3 (2.0) | 14.3 (2.0) | .97 |
| Mean 24-h fT3, pmol/L | 4.0 (0.4) | 3.9 (0.3) | .52 |
Unless indicated otherwise, data are presented as mean (SD).
Data were not available for one male partner due to technical problems.
Ultradian rhythmicity of TSH secretion
The results of the deconvolution analysis are displayed in Table 2. Offspring had significantly higher mean basal TSH secretion (95% CI) compared with the partners (34.3 [27.2–43.1] mU/L per 24 h vs 18.5 [14.4–23.7] mU/L per 24 h, P = .001), whereas the pulsatile secretion was not significantly different between groups (Table 2). No differences were found in the number of pulses, mean pulse mass, or the time that the pulse reaches its maximum during day or night (mode) between offspring and partners. In addition, no differences were found between the offspring and partners in pulse frequency (λ) or regularity of the pulses (γ) and in the fast or slow TSH half-life between the groups (Table 2).
TSH Secretion Parameters in 20 Offspring From Nonagenarian LLS Participants and 18 Partners Thereof
| Offspring (n = 20) | Partners (n = 18) | P Value | |
|---|---|---|---|
| Basal secretion, mU/L per 24 h | 34.3 (27.2–43.1) | 18.5 (14.4–23.7) | .001 |
| Pulsatile secretion, mU/L per 24 h | 19.0 (14.0–25.6) | 14.9 (10.8–20.6) | .28 |
| Total secretion, mU/L per 24 h | 54.9 (43.5–69.2) | 34.2 (26.6–44.0) | .008 |
| Pulse number (per 24 h) | 17.3 (15.5–19.3) | 17.7 (15.7–19.9) | .79 |
| Mean pulse mass, mU/L | 1.1 (0.8–1.5) | 0.8 (0.6–1.1) | .22 |
| Fast half-life, min | 21.7 (18.5–25.4) | 21.0 (17.6–24.9) | .77 |
| Slow half-life, min | 74.2 (66.3–83.0) | 81.9 (72.5–92.5) | .24 |
| Mode day, min | 11.5 (8.1–14.9) | 14.4 (10.8–18.1) | .23 |
| Mode night, min | 9.2 (6.8–12.5) | 12.1 (8.7–16.9) | .19 |
| λ (unitless) | 16.2 (14.5–18.1) | 16.3 (14.5–18.4) | .91 |
| γ (unitless) | 2.1 (1.9–2.4) | 2.0 (1.8–2.3) | .62 |
Data are shown as mean with 95% confidence interval. Differences between the groups were evaluated with a linear mixed model adjusted for age, sex, and body mass index.
Circadian rhythmicity of TSH concentration
Representative 24-hour TSH profiles of one male offspring and one male partner are displayed in Figure 1. Maximum TSH and the nadir were both significantly higher in the offspring compared with the partners (Table 3), whereas no significant difference was observed in the amplitude between groups. Circadian timing and the acrophase were also not different between offspring and partners (Table 3).
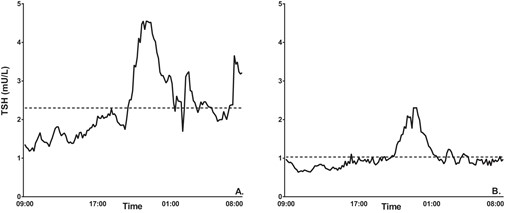
Representative 24-hour TSH profiles of one male offspring and one male partner.
Twenty-four-hour serum TSH concentration profile with mean 24-hour TSH represented by the dotted line. A, One male offspring whose mean 24-hour TSH is 2.30 mU/L. B, One male partner whose mean 24-hour TSH is 1.03 mU/L.
Circadian Rhythmicity of TSH in 20 Offspring From Nonagenarian LLS Participants and 18 Partners Thereof
| Offspring (n = 20) | Partners (n = 18)a | P Value | |
|---|---|---|---|
| Maximum, mU/L | 3.1 (2.4–4.0) | 2.1 (1.6–2.8) | .05 |
| Nadir, mU/L | 1.8 (1.4–2.2) | 1.1 (0.8–1.4) | .01 |
| Acrophase time, min | 23:40 (23:10–00:20) | 23:40 (23:00–00:20) | .91 |
| Circadian timing, min | 20:20 (19:30–21:00) | 20:00 (19:20–20:50) | .64 |
| Amplitude, mU/L | 1.2 (0.9–1.7) | 1.0 (0.7–1.4) | .30 |
Data are shown as mean with 95% confidence interval. Differences between the groups were evaluated with linear mixed model adjusted for age, sex, and body mass index.
Data for one female partner was excluded due to the absence of a pattern.
Temporal relationship of TSH and TH
The cross correlation of TSH and fT4 did not show a strong temporal relationship in both groups. The strongest (mean ± SD) temporal relationship (0.21 ± 0.3, P = .006) in the offspring was at time delay of zero, and the strongest temporal relationship in the partners (0.18 ± 0.2, P = .004) was at time advance of 2 hours.
There was a strong temporal relationship (mean ± SD) in our study population between TSH and fT3 (0.38 ± 0.3, P < .001) at zero delay. The cross-correlation was stronger in the offspring (0.48 ± 0.2) compared with the partners (0.26 ± 0.4) (P = .05) (Figure 2A). However, in the partner group, the strongest temporal relationship was found at time advance of 1 hour (0.28 ± 0.4, P = .01). Next, we explored the temporal relationship of TSH and fT3 during the day (Figure 2B), during the nocturnal surge (Figure 2C), and during the night (Figure 2D). No differences between the offspring and partners were found in the temporal relationship during the day or night. However, during the nocturnal surge, the temporal relationship between TSH and fT3 was significantly stronger in offspring than in partners (0.52 ± 0.4 vs 0.19 ± 0.5, P = .04).
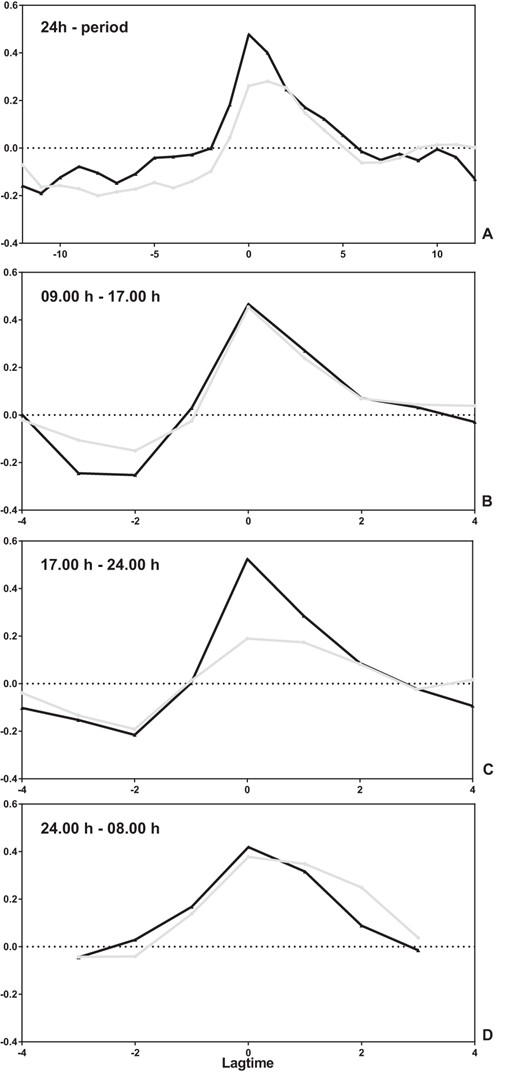
Temporal relationship between TSH and fT3 in 20 offspring of nonagenarian LLS participants and 18 partners thereof.
Temporal relationship of TSH and fT3 in offspring (black line) and partners (gray line) over a 24-hour period (A), between 9:00 am and 5:00 pm (B), between 5:00 pm and 12:00 am (C), and between 12:00 am and 8:00 am (D). In the graphs, the y-axis displays the correlation between the TSH and fT3 profiles and the x-axis the different periods of delay (negative number) or advance (positive number). If TSH and fT3 were both identical in profile and timing, there would be a peak correlation of one at zero delay.
There was no evidence of relationships between strength of rhythmicity and age or sex. There was a trend correlation between age of the mother and the strongest temporal relationship (Pearson correlation 0.29, P = .07) but not with the age of the father.
TSH-TH interaction
The feedforward pattern synchrony of TSH on fT4 (cross ApEn TSH fT4) and feedback pattern synchrony of fT4 on TSH (cross-ApEn fT4 TSH) as well as feedforward synchrony of TSH on fT3 (cross-ApEn TSH fT3) and feedback synchrony of fT3 on TSH (cross-ApEn fT3 TSH) were also not significantly different between offspring and partners (Figure 3).
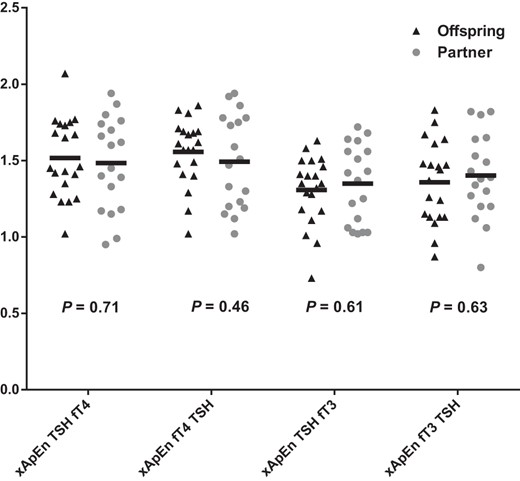
Cross-ApEn of TSH and thyroid hormones in 20 offspring of nonagenarian LLS participants and 18 partners thereof.
The black triangles represent the offspring (n = 20) and the gray circles the partners (n = 18). The black bar represents the geometric mean.
Restricted analyses
Medical screening was performed by a medical doctor and included assessment of history and presence of thyroid disease. Retrospectively, we measured anti-TPO Abs and found that three participants (all offspring) had increased anti-TPO Abs (>35 IU/mL) and one participant (offspring) had missing values for anti-TPO Abs. Therefore, additional restricted analyses were performed. Exclusion of the four participants having elevated or missing anti-TPO Ab values did not materially change the results. Compared with the partners, offspring had significantly (P = .01) higher mean basal TSH secretion (33.0 [26.4–39.6] mU/L per 24 h vs 20.8 [14.5–27.1] mU/L per 24 h) but similar ultradian or circadian rhythmicity of TSH (data not shown). Compared with the partners, offspring tended to have stronger mean ± SD cross-correlation between TSH and fT3 (0.47 ± 0.24 vs 0.26 ± 0.38, P = .065), whereas the feedback and forward interplay between TSH and TH were similar between groups (data not shown).
Discussion
In this study, we investigated whether human familial longevity is associated with changes in ultradian or circadian rhythmicity of TSH and whether the temporal relationship between TSH and TH or the feedback and feedforward synchrony between TSH and TH was changed. The main findings in offspring enriched for familial longevity compared with the partners are as follows: 1) TSH secretion was characterized by higher basal but not pulsatile secretion; 2) the circadian rhythm of TSH was characterized by a significantly higher maximum and minimum but no differences in amplitude or circadian phase; 3) the temporal relationship was stronger between TSH-fT3 but not for TSH-fT4; and 4) no differences were found in feedforward or feedback synchrony of TSH and TH.
Like other pituitary hormones, TSH secretion is partially pulsatile and nonpulsatile (basal), although relative proportions vary between the hormone systems (5, 19). The basic mechanisms involved in the generation of TSH pulses are unknown. Infusions with TRH do not change the intrinsic pulse frequency but increase pulse amplitude (20). In this study, TSH pulse frequency, as well as the pulse mass, was similar between offspring and partners. This finding suggests that the increased TSH secretion is not mediated by enhanced hypothalamic TRH release. In line with this view, we previously found that the ApEn of TSH was unchanged (9), which should be increased under amplified TRH drive, as observed in primary hypothyroidism (21).
TSH secretion is also under restraint of inhibitory hormones and neurotransmitters. Somatostatin (22) and dopamine directly inhibit the thyrotrophs via specific receptors, whereas leptin (23) acts indirectly by diminishing the TRH signal (24). Cortisol also has a physiological important inhibitory effect on TSH secretion (21). Because there was no difference between offspring and partners in serum leptin levels and body weight and body composition were similar in offspring and partners, a role of leptin in causing the TSH difference is unlikely. With respect to cortisol, a detailed analysis of ACTH-cortisol secretion in this cohort did not reveal major differences between the two groups, indicating that the adrenal gland is not likely involved in the increased TSH in longevity (25). Another possibility for increased basal TSH secretion is diminished central dopaminergic tone. Interestingly, TSH profiles in obese women closely resemble those of the offspring participants, by increased basal secretion, but unchanged pulse frequency, secretory regularity (ApEn), and serum fT4 concentration (24).
It may seem counterintuitive that both longevity, which is associated with superior metabolic health (26), and obesity, which is associated with reduced metabolic health, are associated with increased TSH secretion. However, other examples exist of common features that are observed both in long-lived and short-lived models. For example, it was shown that the transcription profile of mice that are short lived due to mutations in DNA repair resembled that of long-lived mice, suggesting that in short-lived mice protective transcriptional programs are activated by the accumulation of damage that are constitutively active in long-lived mice (27). Theoretically it is possible that increased TSH secretion represents a constitutive feature of familial longevity, whereas in obesity it represents a response to overweight. In rats, overconsumption of palatable food gradually decreased responsiveness of dopaminergic brain circuits (28). Administration of low-dose bromocriptine, a dopamine agonist, normalized TSH secretion, whereas fT4 levels remained unchanged in obese premenopausal women (29). In addition, we had no clinical evidence for iodine deficiency. Another less likely mechanism may be impaired production of iodine, caused by reduced iodine intake or impaired storage/processing. Iodine is needed for the production of thyroid hormones, and during a shortage of iodine, the euthyroid state can be maintained through adaptation to preferential synthesis and secretion of T3 over T4 (30, 31). However, because most offspring and partners have shared the previous decades of their lives with each other and had no medical history of goiter, reduced iodine levels because of reduced intake or other underlying mechanisms is not very likely.
The circadian properties of TSH, including the acrophase and circadian timing, were not different between offspring and partners. Generally, these properties of the hypothalamic-pituitary-thyroid axis are very robust in healthy participants (32) unless the sleep-wake cycle is manipulated (5) or in diseases including depression (33), Alzheimer‘s disease (10), and metabolic decompensation in diabetes mellitus types 1 and 2 (34).
Remarkably, TH concentrations were similar in offspring and partners despite a 60% higher TSH secretion. This observation may be the result of either diminished biological activity of TSH, increased peripheral deiodinase activity, or decreased sensitivity of the thyroid gland to TSH. Recently we found that the biological TSH activity was not different between groups (9). In this study we found that the temporal relationship between TSH and fT3 was significantly stronger in the offspring, mainly caused by a significantly increased cross-correlation during the nocturnal surge. fT3 is predominantly produced by peripheral conversion, whereas a small amount is secreted by the thyroid gland. In a previous study, we did not find differences between offspring and partners in estimates of peripheral conversion (9); therefore, it seems likely that changes in fT3 relate to TSH stimulation of thyroid hormone release. Because the fT3 and total T3 levels were comparable between offspring and partners, all together this may be indicative for decreased sensitivity of the thyroid gland to TSH. We found in both offspring and partners a strong pattern synchrony between diurnal pulsatile TSH and TH concentrations and vice versa. This reflects the known stimulating effect of TSH on the release of TH and conversely its negative feedback mechanism. However, no differences were found between offspring and partners in pattern synchrony between TSH-TH and TH-TSH, indicating no loss of coupling between TSH and TH and vice versa.
The strength of our study is that we measured TSH every 10 minutes and TH hourly over a 24-hour period and that we were therefore able to study the hypothalamic-pituitary-thyroid axis in detail using state of the art mathematical techniques. From a methodological viewpoint, the potentially confounding effect of intraindividual variation and reagent batch variation were abolished as per participant all analyses from all time points were run using the same reagent and calibrator batches. Moreover, we performed our study in a special cohort, in which we are able to study familial human longevity. One of the limitations of this study was that not every offspring of a nonagenarian LLS participant is enriched for longevity, which may have diluted potential differences.
In population-based studies, mean TSH levels tend to increase with age (35–38), although some studies suggest that 24-hour TSH levels are decreased in aging men (39). In other studies, in participants aged up to 85 years (40) or even 90 years (6), higher levels of TSH have been associated with lower mortality. Also, long-lived siblings and their offspring were shown to have higher levels of TSH compared with controls, although underlying mechanisms remained elusive. In this study, evaluating 24-hour hypothalamic pituitary thyroid axis activity in depth, we found that familial longevity is associated with increased basal TSH secretion and a stronger temporal relationship between TSH and fT3, especially during the nocturnal TSH surge. We did not detect differences in ultradian or circadian rhythmicity of TSH release between offspring enriched for longevity and partners or in the pattern synchrony between TSH and TH. Underlying mechanisms of the increased basal TSH secretion may include an enhanced resistance of the thyroid gland to TSH and/or diminished central dopaminergic tonus. Challenge experiments using TSH, TH, or dopamine agonist are needed to mechanistically unravel these mechanisms. Further studies are also needed to investigate the pleiotropic effects of increased basal TSH secretion and its role in human healthy longevity.
Acknowledgments
We thank all the participants, the secretarial staff (M. van der Star and E. Bemer-Oorschot), the research nurse (R. de Wilde), the research assistant (B. Ladan), the database manager (S. Henquet), and the laboratory personnel (J. Verhagen, G. van Steen, S. Buitendijk, and M. van Schie-Troost) for their valuable contributions.
This work was supported by the European Commission Project Switchbox Grant FP7, Health-F2-2010-259772.
Disclosure Summary: The authors have nothing to disclose.
Abbreviations
- ApEn
approximate entropy
- BMI
body mass index
- CI
confidence interval
- fT3
free T3
- fT4
free T4
- LLS
Leiden Longevity Study
- TH
thyroid hormone
- TPO Ab
thyroid peroxidase antibody.
