


Abstract
A study of the biochemical, nutritional, and functional modifications in underutilised and neglected food ingredients during processing is vital for promoting dietary diversity, addressing malnutrition, and strengthening food security. This study investigates the impact of food processing techniques, including malting, fermentation, and ultra-sonication, on enhancing the quality attributes of finger millet and edible cricket flour. Finger millet was processed for malting and fermentation at 35 °C for 24 hr, while edible crickets were fermented for 24 hr at 35 °C. Both flours were ultra-sonicated at 50 kHz for 10 min. The processed finger millet (malted, fermented, and ultra-sonicated) and edible cricket (fermented and ultra-sonicated) flours were examined for their biochemical, nutritional, and functional qualities. The results indicate that both traditional (malting and fermenting) and emerging (ultra-sonication) techniques enhance the composition of the food sources investigated. These improvements suggest that combining the processed flours could yield a composite product rich in protein, with improved nutritional content, functional properties, and potential health-promoting benefits.
Introduction
Despite substantial advancements in increasing global food production over the past 25 years, close to 795 million people worldwide are still food insecure and malnourished (Pourmotabbed et al., 2020). The re-introduction and utilisation of underutilised and neglected foods, such as cereal, finger millet (FM), and edible insects like crickets, hold great potential for addressing malnutrition and food insecurity while expanding the diversity of crops in mainstream agriculture (Ulian et al., 2020). Finger millet (Eleusine coracana) is a climate-resilient and nutritional food crop that has been reported to be superior to most other cereals, making it a favourable crop to address malnutrition. Finger millet grains are rich in vitamins, minerals, fibre, and energy compared to other cereals; some FM genotypes have a calcium content as high as 400–500 mg/100 g and can reportedly be developed into a preventative “drug” against osteoporosis (Gupta et al., 2017).
Finger millet is a climate-resilient crop, thus making it an indispensable product within the ecosystem (Sood et al., 2019). In addition, FM is processed into intermediate flours and flakes and used as a component in finished products like bread or snack foods intended for human consumption, as with many other cereals (Selladurai et al., 2022). Edible insects, such as crickets (Acheta domesticus), have long been part of the human diet in tropical countries and are considered a delicacy in Africa (von Hackewitz, 2018). The consumption of edible insects, like crickets, has increased over the past years, indicating they can serve as an alternative protein source for human consumption (Kim et al., 2019; von Hackewitz, 2018). Its appealing nutritional profile has made it the most promising insect to be farmed (Fernandez-Cassi et al., 2019).
In their dry-weight form, edible crickets (ECs) have a high protein content and a beneficial composition of monounsaturated fatty acids (MUFAs) and polyunsaturated fatty acids (PUFAs). In addition, they constitute a rich source of micro-nutrients, such as calcium (Ca), potassium (K), magnesium (Mg), and phosphorus (P), commonly deficient in the human diet (Pilco-Romero et al., 2023). Recently, attention has shifted from harvesting insects in the tropics to farming insects worldwide for food and animal feed applications (van Huis, 2022). In ECs like A. domesticus, proteins can be extracted and incorporated into food matrices (complex systems with variable characteristics). These proteins can interact with other components, thus modifying their functional properties in final products like baked goods and noodles (Gravel and Doyen, 2020; Pilco-Romero et al., 2023).
However, both FM and EC foods are underutilised for human consumption in sub-Saharan Africa, partly due to a lack of knowledge about efficient processing methods to transform them (Maiyo, 2022). Nowadays, FM is considered in many African diets due to its low-glycemic-index food properties and is a good choice for people with coeliac diseases or diabetes since consuming the grain assists in regulating blood glucose (Ramashia et al., 2019). On the contrary, the consumption of insects is not a new phenomenon, as it dates to the development of agriculture when humans relied on gathering plants and hunting wild animals. Particularly in Africa, edible insects have played a vital traditional role in nutritious diets in various communities (Hlongwane et al., 2020).
Furthermore, the valuable nutritional and healthy components of FM, as well as its gluten-free traits, merit the grain as unconventional substrates for biomodification processes and subsequent application for food use (Selladurai et al., 2022). In addition, for edible insects like the A. domesticus, food processing methods need to be applied to balance the food safety concerns and the nutritional benefits (Imathiu, 2020). Fermentation and malting are traditional and inexpensive methods to convert food grains into intermediate products. These products offer desired and improved food features: nutrient composition, technological and desired sensory properties, enriched and healthy food components, and reduced antinutritional factors (Kewuyemi et al., 2022). Experimental studies have reported the effect of various fermentation treatments on FM flour, which resulted in an enhancement in total phenolic contents (TPCs) and antioxidant activity (Azeez et al., 2022). Fermentation by lactic acid bacteria and yeasts has also been observed to generate increased crude proteins and decreased fat contents (Azeez et al., 2022; Jan et al., 2022).
Malting millet has long been a traditional African practice in producing infant food, lactic acid, and alcoholic fermented beverages. It has also been reported to increase methionine and cysteine content (Owheruo et al., 2018). In addition, when observed in edible insects, applying fermentation has been shown to improve flavour, rheology, and texture and change perceptions about processed insects (Castro-López et al., 2020). These processing techniques remain in current food processing methods and still guarantee the microbiological safety and stability of products. However, these techniques can destroy some food ingredients, especially the heat-sensitive vitamins and polyphenols related to food quality (Zhang et al., 2018). The deteriorating vitamins and polyphenols could be caused by enzymatic activity, oxidation, and microbial metabolism during the fermentation or malting stages. Wang et al. (2019) report a decrease in phenolic content ranging from 20% to 24% when comparing unfermented millet flour to fermented millet flour.
These outcomes have led to the application of nonthermal technologies being introduced into the food industry, such as low-processing temperatures with a short treatment period and minimal or no changes in food flavours and essential nutrients (Zhang et al., 2018). Nonthermal processing techniques like ultra-sonication technology could replace traditional, well-established preservation processes either partially or completely. In addition, they can ensure the sensory quality and nutrient values of food in shorter processing times and lower temperature conditions yet still enhance food safety and extend the shelf life of food products (Zhang et al., 2018). The energy generated during the action of ultrasonic waves has a positive impact on the texture, organisational structure, and flavour of food characteristics. In addition, technology plays an essential role in starch and protein modification (Zhang et al., 2023). The process has been shown to increase solubility and foaming capacity and assist in reaching high emulsion activity and stability in cereal grains (Gill et al., 2023).
Given the potential benefits of the modification techniques mentioned above, investigating the effects of fermentation, malting, and ultra-sonication in FM and EC may help in understanding the complementary qualities that enhance their use in innovative food products. However, such knowledge is limited, particularly regarding newer methods like ultra-sonication in processing FM and edible insects. Thus, this research investigates the effects of both emerging (ultra-sonication) and traditional (malting and fermenting) processing methods on the quality attributes of EC (A. domesticus) and FM (E. coracana).
Materials and methods
Samples
Finger millet (E. coracana) grains were obtained from a local supermarket (SAI Wholesale) in Newtown, Johannesburg, South Africa. Live ECs (A. domesticus) were purchased from Jozi Bugs, a farm in Randburg, Johannesburg, South Africa. The live ECs were received at room temperature (25 °C) in an enclosed 5 L plastic container with holes punched all around. The ECs were stacked in recycled egg trays.
Chemicals
The study’s analytical-grade chemicals were purchased from Merck Chemicals (Pty) Ltd. in Germiston, South Africa.
Sample preparation
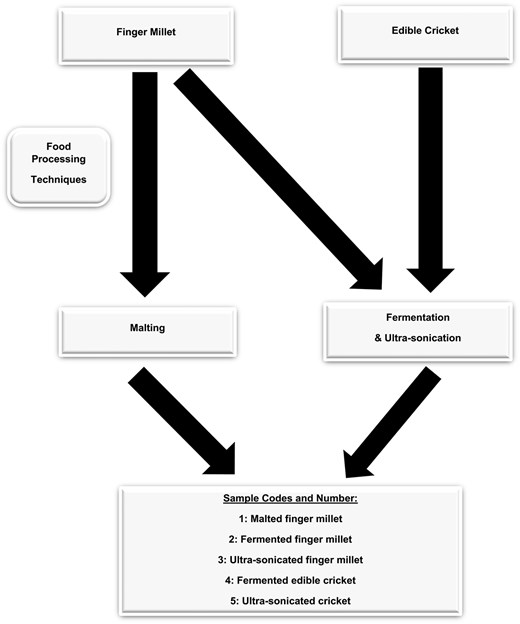
Finger millet cereal grains were washed with tap water until the grains were free from dirt. The clean grains were rinsed with distilled water to remove any remaining dirt and dried for 24 hr at 45 °C in a drying oven (Incotherm, Labotec, Johannesburg, South Africa). A portion of the dried FM grains was reserved for malting, and the rest was milled in a platinum dry miller (KJ-1250, Castelfranco Veneto, Italy) and sieved using a 100 μm mesh shaking sieve (Analysette 3 Spartan; Fritsch GmbH, Idar-Oberstein, Germany) to produce flour and stored for analysis. The ECs were not fed for 24 hr to ensure an empty intestinal tract and then placed in a −4 °C freezer for 1 hr to put down humanely. The ECs were washed with tap water to remove dirt and rinsed with distilled water to eliminate all dirt. The ECs were sterilised in boiling water at 100 °C for 6 min and, thereafter, dried in a hot air oven (Incotherm, Labotec, Johannesburg, South Africa) at 45 °C for 36 hr and then milled (Phillips Series 5000 blender, Shanghai, China) to produce EC flour, which was stored in a 4 °C refrigerator for analysis. The clean FM grains were prepared for malting, and the milled FM and EC flours were prepared for fermentation and ultra-sonication. The process resulted in three FM samples (raw, malted, and ultra-sonicated) and two EC samples (raw and ultra-sonicated).
Sample processing
Malting
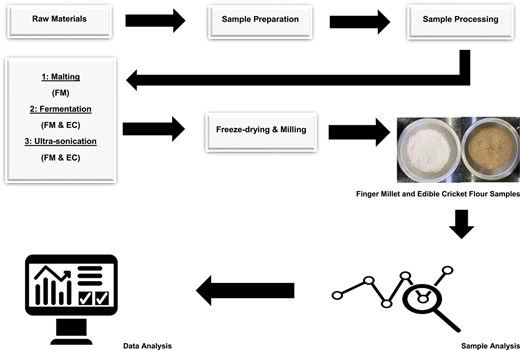
The prepared samples were treated in accordance with the experimental design in Figure 1. After being cleaned and steeped in distilled water at a ratio of 1:3 (sample to water) for 24 hr at 35 °C, the grains were spread out on a tray and allowed to germinate for another 24 hr at 35 °C. While germinating, the grains were sprinkled after 12 hr to keep them moist. The recovered wet-sprouted FM was dried in an oven (Incotherm, Labotec, Johannesburg, South Africa) for 24 hr at 35 °C and milled into flour (Platinum dry miller KJ-1250, Castelfranco Veneto, Italy). The flour samples were passed through a 100 μm mesh sieve (Analysette 3 Spartan; Fritsch GmbH, Idar-Oberstein, Germany), packed in a Zip-lock bag labelled as malted FM (MFM), and then stored for further analysis.
Flowchart of experimental design.
Fermentation
The FM and EC flours were fermented using the submerged fermentation process. The fermented FM (FFM) and fermented EC (FEC) were processed using methods by Kewuyemi et al. (2024), whereby 0.4 g of lactic acid bacteria freeze-dried starter culture (YC-XII Thermophilic Yoghurt Culture, CHR Hansen) was dissolved in 100 ml of sterile distilled water. The mixture was added to 100 g of FM flour and 100 g of EC flour, mixed gently (Figure 1), and then incubated at 35 °C for 24 hr in an incubator (Incotherm, Labotec, Johannesburg, South Africa). The fermented samples were freeze-dried for 24 hr (LyoQuest freeze dryer, Telstar, Spain), milled (Platinum dry miller KJ-1250, Castelfranco Veneto, Italy), sieved with a 100 μm mesh sieve (Analysette 3 Spartan; Fritsch GmbH, Idar-Oberstein, Germany), stored in a Zip-lock bag, and labelled as FFM and FEC for further analysis.
Ultra-sonication
The EC flour and FM flour obtained from sample processing (Sample Preparation) were ultrasonically sonicated using a range of theories and references by Zhang et al. (2023) and Jamalabadi et al. (2019). Thirty grammes (30 g) of both flour samples were submerged into 100 ml of distilled water and placed under the ultra-sonicated probe (Misonix Ultrasonic Liquid Processor FB705, Fisher Scientific, Mississauga, Canada) at 50 kHz for 10 min. The sample was freeze-dried (LyoQuest freeze dryer, Telstar, Spain), sieved with a 100 μm mesh (Analysette 3 Spartan; Fritsch GmbH, Idar-Oberstein, Germany), stored in a Zip-lock bag, and labelled as ultra-sonicated FM (UFM) and ultra-sonicated EC (UEC) for further analysis.
Methods
Biochemical properties, pH, titratable acidity, total soluble solids
A handheld pH meter was used (Oakton WD-35419-03 Instruments Series pH 700, Darmstadt, Germany) to check the samples’ pH in triplicate after appropriate calibration. The study employed a procedure by Olukomaiya et al. (2020) and Kewuyemi et al. (2022) to determine titratable acidity (TA). The mixture was left to settle after combining 10 g of the sample material with 90 ml of distilled water. Nil point 1 (0.1) mol of NaOH was added during titration to raise the pH of the recovered supernatant to 8.3. Total soluble solids (TSSs) were determined by using a refractometer (Hanna Instrument HI96801 0%–85%, Woonsocket, United States). One millilitre of the hydrated flour sample was placed in the refractometer sample holder and measured; the results were recorded in percentage (%).
Phytochemicals and antioxidant activities
Extraction
The malted, fermented, and ultra-sonicated FM and fermented and ultra-sonicated EC flours were extracted using methods by Arouna et al. (2020). Five millilitres (5 ml) of acidified methanol (1% in 80% methanol) in a 0.25 g of raw and processed flour sample (FM and EC) was placed into a centrifuge tube. The mixture was then shaken to homogenise in a mixer (Model 36110740 Mixer, Darmstadt, Germany). Thereafter, the mixture was sonicated in an ultra-sonic bath (AU 220, Agro Lab, Capri, Italy) for 1 hr at 4 °C and then centrifuged at 4,000 rpm for 10 min (Eppendorf 5702, Sigma Aldrich, Darmstadt, Germany). The supernatant was passed through 0.22 μm filters (Nanotong filterBio Membrane, Jiangsu, China) into a new centrifuge tube, transferred into the 2 ml Eppendorf tubes, and stored at 4 °C in the dark.
Total phenolic content
A modified procedure by Arouna et al. (2020) determined the TPC, whereby flour samples were assayed using the Folin–Ciocalteu reagent. Ten microlitres (10 μl) of the extracted aliquot were added to the microplate wells (Hirschmann Laborgeräte GmbH & Co., Eberstadt, Germany) and combined with 50 μl of 7.5% sodium carbonate Na2CO3 and 1:15 dilution of Folin–Ciocalteu phenol reagent with distilled water. Aluminium foil was used to enclose the infected plate, which was then placed in darkness and incubated for 30 min (Incotherm, Labotec, Johannesburg, South Africa). The absorbance was then measured (Accuris Instruments, Smart Reader 96, Darmstadt, Germany) at 750 nm, and the gallic acid standard curve (0–0.2 mg/ml) was also constructed. The gallic acid calibration curve was applied to quantify the TPC, which was then represented as milligrams of gallic acid equivalent per gramme of the sample (mg GAE/g sample).
Total flavonoid content
The study employed a modified procedure by Moyo et al. (2020) to determine the total flavonoid content (TFC) of the flour samples. Ten microlitres (10 μl) of the extracted aliquot were accurately pipetted in a 96-well microplate (Hirschmann Laborgeräte GmbH & Co., Eberstadt, Germany), followed by the addition of 30 μl of 2.5% of sodium nitrate NaNO2, 30 μl of 1.25% aluminium chloride A1C13 and then 100 μl of 2% sodium hydroxide NaOH. The resulting mixture volume (170 μl) and quercetin standard curve (0–2.0 mg/ml) were prepared. Absorbance was measured at 450 nm via a microplate absorbance reader (Accuris Instruments, Smart Reader 96, Darmstadt, Germany). The quercetin calibration curve was used to compute the TFC, which was then reported as milligrams of quercetin per gramme of sample (mg QE/g sample).
2,2-Azinobis-(3-ethylbenzthiazolin-6-sulfonic acid)/radical cation assay
A slightly modified method by Sadh et al. (2017) was used to determine the 2,2-azinobis-(3-ethylbenzthiazolin-6-sulfonic acid) (ABTS) assay. A mixed solution containing 7.6 mM of ABTS+ and 2.6 mM of potassium persulphate solutions (19 mg/5 ml and 3.5 mg/5 ml, respectively) and 5 ml of distilled water was incubated in the dark at room temperature for 12 hr, and the solution was used within 16 hr of preparation. The ABTS+ working solution (0.26 mM) was prepared by diluting the stock solution 30 times in 0.1 M phosphate-buffered saline. A standard curve of Trolox between 0 and 1 mM was used, and a 1 mM stock solution of Trolox was prepared by weighing 0.0025 g of Trolox into 10 ml of phosphate-buffered saline in a volumetric flask. Thereafter, the reagent was pipetted in a microplate (Hirschmann Laborgeräte GmbH & Co., Eberstadt, Germany) using the following order: first, 10 μl standard/extract, followed by 290 μl of the ABTS+ working solution; then, the resulting mixture was incubated at 37 °C for 15 min. The coloured mixture was measured at 750 nm. The results were then expressed as TEμM/g dry mass.
Ferric-reducing activity power assay
The study utilised a method by Sharma et al. (2018) (with slight modification) to determine the ferric-reducing activity power (FRAP) assay of the flour samples. The FRAP working solution was prepared by mixing 7.5 ml acetate buffer, 7.5 ml 2, 4, 6-tripyridyl-s-triazine, and 7.5 ml ferric chloride (FeCI3 6 HO). After mixing, the temperature of the working solution was raised to 37 °C using a water bath. Ten microlitres of the extracted sample and 240 μl of FRAP working solution were pipetted into a microplate (Hirschmann Laborgeräte GmbH & Co., Eberstadt, Germany) and incubated for 5 min at 37 °C, and the results were measured at 593 nm. The standard curve of Trolox was used, and 0 and 1 mM in 75% ethanol was prepared by adding 0.0025 g of Trolox in 10 ml of 75% ethanol. The absorbance changes in the test mixture were compared to those obtained from a standard mixture of Trolox equivalent (0.1–1.0 μM/L). Ferric-reducing activity power values were expressed as μM Trolox equivalents per gramme.
Physico-chemical properties
Colour
The colour profile of the raw and processed flours was measured using a twofold system consisting of a measuring head and data processor (CR-410 and DP-400 Ver. 1.20, respectively; Konica Minolta, Inc., Tokyo, Japan). Before triplicate measurements for consistent values, the chromameter was standardised using the provided calibration plate [Y (85.0), x (0.3165) and y (0.3231)]. The colour parameters were: lightness (L*), redness/greenness (a*/−a*), and yellowness/blueness (b*/−b*) between the unprocessed and processed FM and EC flours. Further to this, the browning index (BI) was estimated following Emerald et al. (2020), using Equation 1.
where y = (a* + 1.75 L*)/(5.645 L* + a – 0.3012 b*)
Nutritional properties
Proximate composition, total energy value, and carbohydrate content
AOAC (2006) procedures were applied to determine the proximate composition of the unprocessed and processed FM and EC flour samples. Moisture content (934.01) and ash content [923.03 (32.1.05)] were measured, and a fibre analyser (ANKOM200/220; ANKOM Technology, Macedon, NY, USA) was used to determine the fibre content (Ba 6a-05), while the crude fat was quantified using Soxhlet extraction [920.39 (A)], and diethyl ether was the selected solvent. The crude protein content (990.03) was determined according to the Kjeldahl method expressed using 6.25 as the nitrogen conversion factor.
Functional properties
Bulk and loose bulk density
The packed bulk density (PBD) and loose bulk density (LBD) of the FM and EC flours were measured per the method proposed by Amandikwa et al. (2015). Approximately 10 g of the sample was weighed in a weighing boat and transferred to a 25 ml measuring cylinder to obtain the LBD. The PBD was obtained by tapping the bottom of the cylinder several times until a constant volume of FM and EC flours was observed. The flour weight per flour volume was used to calculate LBD and PBD (g/cm3).
Water absorption capacity and oil absorption capacity
The water absorption capacity (WAC) and oil absorption capacity (OAC) of the FM and EC flours were measured per the method described by Mudau et al. (2022). About 1 g of the flour sample was weighed in a weighing boat, transferred into a centrifuge tube, and combined with distilled for WAC or oil for OAC. The combination was then vortexed for 30 min at room temperature ± (25 °C) (Model 36110740 Mixer, Darmstadt, Germany) and centrifuged at 3,000 rpm for 25 min (Eppendorf 5702, Sigma Aldrich, Darmstadt, Germany). After centrifugation, the supernatant was added to a beaker, and the sample weight was recorded before and after adding distilled water and subtracting oil to determine the WAC and OAC. The findings were given as grammes of oil or water per gramme of flour.
Swelling capacity
The method outlined by Adebiyi et al. (2016) was used to calculate the swelling capacity of the FM and EC flours. The flour sample was poured into a graduated cylinder measuring 100 ml until it reached the 10 ml mark. Subsequently, distilled water was added until the total volume reached 50 ml. To ensure that the contents were well combined, the tops of the graded cylinders were securely covered and turned inside out. The suspension was reversed again after 2 min and given 30 min to settle. The sample volume was taken 30 min later.
Pasting properties
A rheometer (Anton Paar MCR 72, Ostfildern, Austria) was used to analyse the pasting profile breakdown (cP), pasting temperature (°C), peak time (min), final viscosity (cP), peak viscosity (cP), setback viscosity (cP), and trough viscosity (cP), following methods by Kewuyemi et al. (2024) and Adeyanju et al. (2025). The predetermined moisture content of the flour samples was readjusted to 3.50 g dry weight and then mixed with 25 ml of distilled water in an aluminium canister. The testing process was initiated by maintaining the slurry at 50 °C for 1 min and stirring for 10 s at 960 rpm for even dispersion. At 160 rpm, the slurry was heated to 95 °C (3.42 min), held at 95 °C (2.70 min), cooled at 50 °C (3.88 min), and held at 50 °C for (20 min).
Thermal properties
The thermal properties of the raw and processed FM and EC flour samples were analysed using differential scanning calorimetry (DSC) 3 STARe System (CH-8606, Mettler Toledo, Greifensee, Switzerland), following a slightly modified method by Murungweni, Ramashia and Mashau (2024). Approximately 10 mg of flour sample was weighed into an aluminium pan, and 30 μl of distilled water was added to the pan. The samples were equilibrated for 24 hr at room temperature. The samples were then placed into the differential scanning calorimetry furnace and heated together with a reference sample (empty pan) from 25 to 140 °C at a rate of 10 °C/min. The gelatinisation temperature and melting enthalpy (ΔH in J/g) were measured in duplicate.
Statistical analysis
All experimental data were executed in triplicate and statistically analysed using a one-way analysis of variance (IBM SPSS ver. 27.0, New York, NY, USA). The means were compared using the Turkey s-b, Duncan multiple range test at p ≤ .05 significance level of probability, and values were represented as the M of SD.
Results and discussion
Biochemical properties (pH, TA, TSS), phytochemicals (TFC, TPC), antioxidants (ABTS, FRAP), and proximate composition of raw and processed FM and EC flour samples
The pH and acidity of traditional and novel processed FM and EC flours are the result of much interplay between endogenous (enzymes and microbes inherently present in the flour) and exogenous (dough yield, temperature, and time) factors (Chinma et al., 2024; Van Kerrebroeck et al., 2016). As presented in Table 1, MFM and FFM flours showed a significant decrease (p ≤ .05) in pH (5.74 and 4.48) compared to raw FM (RFM) and UFM (6.11 and 6.17). In addition, UFM showed no significant difference (p ≤ .05) in pH compared to RFM. This result could be subject to the ultrasonic low-frequency range treatment of 50 kHz; such a low frequency caused no variation in physicochemical characteristics (Gill et al., 2023). Consequently, MFM and FFM showed a significant increase (p ≤ .05) in titratable acidity (2.50 and 9.00 ml 0.1 mol NaOH/10 g) compared to the titratable acidity presented in RFM and UFM (1.06 and 1.63 ml 0.1 mol NaOH/10 g). This outcome could be due to the short fermentation time (24 hr), which aligns with previous reports finding a low pH in cereals and legumes when fermented for less than 48 hr (Kewuyemi et al., 2022). The observed high acidity in FFM could be due to the fermenting organisms responsible for fermentation utilising sugars and, subsequently, producing lactic acid (Adisa et al., 2019). When observed in MFM, the increase in acidity (TA) might be due to the degradation of some complex organic molecules, such as lipids, phytin, and proteins, into simpler compounds. Thus, the increase in acidity during germination could be related to the rate at which complex compounds were hydrolysed (Owheruo et al., 2018). Fermented edible cricket showed a significantly low (p ≤ .05) pH compared to REC and UEC (6.79 and 6.69), which could be due to the accumulation of organic acids produced by some fermenting organisms. In addition, FEC displayed a significantly high (p ≤ .05) acidity (11.00) compared to the low similarity observed between REC and UEC (5.00 and 5.06), ultimately indicating that a low pH could result in high acidity.
Biochemical properties (pH, TA, TSS), phytochemical (TFC, TPC), antioxidant properties (ABTS, FRAP), and proximate composition of unprocessed and processed finger millet and edible cricket flour samples.
| Parameters | MFM | MFM | FFM | UFM | REC | FEC | UEC |
|---|---|---|---|---|---|---|---|
| pH | 6.11c ± 0.01 | 5.74b ± 0.30 | 4.48a ± 0.02 | 5.17cd ± 0.02 | 6.79b ± 0.05 | 5.84a ± 0.11 | 6.69b ± 0.02 |
| TA (ml 0.1 mol NaOH/10 g) | 1.06a ± 0.11 | 2.50c ± 0.10 | 9.00d ± 0.00 | 1.63b ± 0.05 | 5.00a ± 0.00 | 11.00c ± 0.00 | 5.06b ± 0.05 |
| TSS (Brix %) | 3.80b ± 0.00 | 4.76c ± 0.61 | 6.73d ± 0.30 | 0.66a ± 0.15 | 3.36b ± 0.15 | 18.16c ± 0.15 | 2.46a ± 0.05 |
| TFC (mg QE/g) | 0.92b ± 0.17 | 0.66a ± 0.16 | 0.85c ± 0.18 | 1.23d ± 0.22 | 1.67b ± 0.11 | 3.47c ± 0.04 | 0.85a ± 0.15 |
| TPC (mg GAE/g) | 2.79c ± 0.18 | 3.38d ± 0.24 | 2.63b ± 0.16 | 2.47a ± 0.13 | 2.88a ± 0.16 | 6.54b ± 0.89 | 1.94a ± 0.21 |
| ABTS (mM TE/g) | 18.07a ± 1.08 | 21.60c ± 1.21 | 25.65d ± 2.30 | 18.29b ± 1.23 | 27.04b ± 2.43 | 25.32a ± 1.90 | 27.31b ± 2.67 |
| FRAP (μmol TE/g) | 31.51a ± 1.32 | 31.73a ± 0.99 | 41.50c ± 1.90 | 33.57b ± 0.89 | 61.51a ± 2.01 | 71.98b ± 2.50 | 79.40c ± 2.89 |
| Moisture content (%) | 6.64d ± 0.10 | 6.63c ± 0.16 | 5.66b ± 0.78 | 4.89a ± 0.16 | 4.89b ± 0.16 | 7.95c ± 0.52 | 3.53a ± 0.98 |
| Crude ash (%) | 1.65b ± 0.11 | 1.09a ± 0.06 | 1.85c ± 0.03 | 1.88d ± 0.32 | 3.81a ± 0.08 | 4.57b ± 0.90 | 4.94c ± 1.92 |
| Crude fibre (%) | 6.57b ± 0.77 | 6.04a ± 0.18 | 6.84c ± 0.33 | 7.83d ± 0.16 | 11.62c ± 2.50 | 9.16a ± 1.93 | 11.49b ± 2.72 |
| Crude fat (%) | 0.79c ± 0.05 | 0.90d ± 0.10 | 0.65a ± 0.20 | 0.70b ± 0.15 | 15.79b ± 1.11 | 15.50a ± 4.51 | 16.57c ± 0.90 |
| Crude protein (%) | 7.88a ± 0.00 | 7.90b ± 0.00 | 8.12c ± 0.00 | 7.90b ± 00 | 75.62a ± 1.09 | 76.96b ± 1.61 | 77.22c ± 0.57 |
| Carbohydrate (%) | 76.89b ± 0.14 | 77.51c ± 0.06 | 76.79b ± 0.10 | 76.47a ± 0.72 | -8.45c ± 0.39 | -3.38b ± 0.15 | 387.22a ± 4.86 |
| Energy value (kcal/g) | 341.19a ± 0.85 | 344.06b ± 0.50 | 346.15c ± 0.13 | 347.22d ± 2.34 | 388.38b ± 9.72 | 4.48a ± 0.14 | 404.81c ± 1.04 |
Note. Values represent mean ± standard deviation of triplicate measurements. Different letters within a row are significantly different at p ≤ .05. TA = titratable acidity; TSS = total soluble solids; TFC = total flavonoid content; TPC = total phenolic content; ABTS = 2,2-azinobis-(3-ethylbenzthiazolin-6-sulfonic acid); FRAP = ferric-reducing activity power; RFM = raw finger millet; MFM = malted finger millet; FFM = fermented finger millet; UFM = ultra-sonicated finger millet; REC = raw edible cricket; FEC = fermented edible cricket; UEC = ultra-sonicated edible cricket.
Measuring TSSs is essential to identifying adulteration and contamination in food products (Vitalis et al., 2020). The raw and processed FM flours showed significant differences (p ≤ .05) in TSSs (%), as seen in Table 1. Ultra-sonicated finger millet displayed a significantly low (p ≤ .05) (0.66%) compared to the significantly high (p ≤ .05) TSSs in FFM (6.73%). This outcome could be a result of the ultra-sonication carbohydrate breakdown process, resulting in a decrease in sugar content (Gill et al., 2023), and the increase in FFM could be a result of the hydrolysis of starch, cellulose, and hemicellulose since both xylose and glucose increased on fermentation (Lamichhane et al., 2021). Raw and processed EC flour also differed significantly when TSSs were observed. Fermented edible cricket showed a significantly high (p ≤ .05) TSS (18.16%) compared to UEC (2.46%), which further emphasises that fermentation impacts inducing sugar content during fermentation, whereby microorganisms break down complex carbohydrates into simpler sugars, which can increase the concentration of sugars. A similar trend was also observed in FFM flours (Perez-Santaescolastica et al., 2022).
A diet high in essential phytochemicals, including fermented, malted, and standard processed foods, may strengthen the body’s defences against metabolic diseases (Adebo and Medina-Meza, 2020; Kewuyemi et al., 2021). In Table 1, TFC showed significantly low (p ≤ .05) values in MFM and FFM (0.66 and 0.85 mg QE/g) compared to RFM (0.92 mg QE/g), suggesting that traditional processing techniques, such as malting and fermentation, within the conditions in the current study could indicate that 24 hr processing can result to insufficient time in the uptake of bioactive compounds (Hassani et al., 2016). Furthermore, the low values could suggest that the decrease might align with the grain type, microorganism species, and condition process (Abioye et al., 2022). As observed, traditional processing, such as fermentation or malting, has been shown to increase TFC within the specified condition mentioned in this study. On the other hand, ultra-sonication can increase flavonoid content in FM at 50 kHz in 10 min. Ultra-sonicated finger millet showed significantly high (p ≤ .05) (1.23 mg QE/g). Accordingly, as Gill et al. (2023) have indicated, ultra-sonication is a nonthermal processing technique used to enhance the production of bioactive compounds; therefore, the increase in TFC could be due to the increased capacity of solvents to extract flavonoid compounds. Malted finger millet flour showed significantly higher (p ≤ .05) TPC values (3.38 mg GAE/g) than FFM and UFM flour extracts (2.63 and 2.47 mg GAE/g) (see Table 1). Similar studies have observed that a high TPC in malted cereal grains could be attributed to the increased enzyme activity during germination and the Maillard reaction during kilning, producing endogenous antioxidants (Vingrys et al., 2022). Fermented finger millet and UFM displayed significantly lower TPC values (p ≤ .05) (2.63 and 2.47 mg GAE/g) compared to RFM, suggesting that both processing techniques, i.e., fermentation and ultra-sonication, can potentially reduce phenolic radicals in FM flours.
Previous research has hypothesised that flours derived from insects would contain phenolic compounds because insects are herbivores and have the capacity to retain and metabolise plant phenolic compounds from their diet. For instance, phenolic chemicals have been found in many different types of insects, including lepidopterans (Mendoza-Salazar et al., 2021). Fermented edible cricket showed significantly high (p ≤ .05) (2.47 mg QE/g) TFC and TPC (6.54 mg GAE/g) values compared to UEC (0.85 mg QE/g) and TFC (6.54 mg GAE/g), indicating that in the fermentation process for edible insects, certain bacteria hydrolyse galloyl moieties, remove sugar moieties, and release free flavonoid and phenolic chemicals. (Mendoza-Salazar et al., 2021). UEC showed a significantly low (p ≤ .05) (0.85 mg QE/g) TFC and (1.94 mg GAE/g) compared to REC (1.67 mg QE/g) TFC and (2.88 mg GAE/g) TPC values, suggesting that longer ultra-sonicating time is required to extract flavonoids and phenolics in edible insects. Ssepuuya et al. (2021) have found that the total amount of phenolic content is higher at 45 and 60 min of sonication than at 15 and 30 min.
A diet high in antioxidants might reduce the risks of contracting many diseases, including heart diseases and certain cancers (Luo et al., 2021). Table 1 illustrates that the ABTS and FRAP concentration of MFM (21.6 mM TE/g, 31.73 μmol TE/g) had a significant increase (p ≤ .05) in MFM, suggesting that the breaking of the peptide bond released protons and electrons that were responsible for the significant reduction potential of the peptides. Furthermore, the FFM also increased significantly (p ≤ .05) in ABTS and FRAP (25.65 mM TE/g and 41.50 μmol TE/g). This increase could be associated with the microorganisms involved in fermentation, like lactic acid bacteria, which enhance the production or release of antioxidant compounds (Adebo and Medina-Meza, 2020). The FEC showed a significant increase (p ≤ .05) in the ABTS and FRAP assays (25.65 mM TE/g and 41.50 μmol TE/g) compared to UEC (18.29 mM TE/g and 33.57 μmol TE/g), which could suggest that chitin remained, and some oligosaccharides might still be allowing for high antioxidant content. Mendoza-Salazar et al. (2021) have reported the same finding in fermented grasshopper flour. In addition, Ssepuuya et al. (2021) and Gill et al. (2023) have posited that comparatively low values of UEC could suggest that the flour requires a longer processing period to retrieve sufficient antioxidant compounds.
Table 1 presents the proximate composition and energy values (kcal/g) of raw and processed FM and EC flours. In raw and processed FM flours, the moisture content (%) of the flours significantly decreased (p ≤ .05) (6.64% to 4.89%) as they were processed using malting, fermentation, and ultra-sonication, thus indicating that FM flours might be more resistant to microbial deterioration. Fermented finger millet and UFM increased significantly (p ≤ .05) (1.85% and 1.88%) in crude ash and crude fibre (6.84% and 7.83%) compared to MFM crude ash and crude fibre (1.09 and 6.04). Such a decrease in fibre content might be connected to how the developing embryo uses nutrients during germination (Kewuyemi et al., 2021; Krishnan et al., 2012). In addition, the decline in ash content could be attributed to the metabolic losses of water-soluble minerals that occur when the grains steep (Jan et al., 2018; Kewuyemi et al., 2021). In contrast, MFM showed a significant increase (p ≤ .05) in crude fat (0.90%) compared to RFM (0.79%), and, in FFM (0.65%) and UFM (0.70%), the level of lipolytic enzyme activity, which converts accessible fat into glycerol and fatty acids, might be the cause of this (Jan et al., 2018; Kewuyemi et al., 2021). A significant protein (%) increase (p ≤ .05) is observed in all processed FM flours (MFM, FFM, and UFM), particularly in FFM (8.12%) flour. This result could be because, during fermentation, smaller peptides might have been broken down into free amino acids by microbial enzymes during sourdough fermentation, boosting the protein concentration (Kewuyemi et al., 2021; Li et al., 2020). Moreover, the anabolism of proteins from accessible carbohydrates might have caused the rising protein levels observed (Aguilar et al., 2019). A decrease (p ≤ .05) in carbohydrates in UFM (76.47%) was observed compared to increased levels of carbohydrates in MFM (77.51%) and FFM (76.79%). The decrease in UFM could be due to the ultrasound wave frequency, which, in turn, produces pores on the surface of the grain due to the porous nature of the surface of the grain, altering the starch and protein native characteristics (Bonto et al., 2018; Gill et al., 2023). Alternatively, the significant increase (p ≤ .05) observed specifically in carbohydrates in MFM could be the reason the grain coat becomes softer during steeping, possibly releasing structural carbohydrates like cellulose and hemicellulose, thereby raising the carbohydrate content (Kewuyemi et al., 2021; Kumar et al., 2021). The energy (kcal/g) in MFM (344.06 kcal/g), FFM (346.15 kcal/g), and UFM (347.22 kcal/g) showed a significant increase (p ≤ .05) compared to the RFM (341.19 kcal/g). Ultra-sonicated finger millet similarly displayed a significantly high energy value (347.22 kcal/g) compared to the traditional (malting and fermenting) processing techniques. This result could be linked to the ultra-sonication physical process that causes bubbles (or cavities) to form, grow, and eventually collapse, resulting in a minimum radius that produces extremely high shear energy inside a liquid (Gallo et al., 2018; Gill et al., 2023; Majid et al., 2015).
As presented in Table 1, the proximate composition of raw and processed EC flours, FEC moisture content showed that a significant increase (p ≤ .05) (7.95%) compared to the significant decrease in UEC (3.53%) could indicate microbes such as bacteria, metabolise carbohydrates, proteins, and fats within the insects during the fermentation process. This metabolic activity produces water as a by-product. The breakdown of macromolecules can also release water previously bound within the insect tissues, resulting in a high moisture content (Vasilica et al., 2022). Both FEC and UEC ash content increased significantly (p ≤ .05) (4.57% and 4.94%) compared to REC, suggesting that both fermentation and ultra-sonication processes improve the mineral composition of edible insects. Furthermore, a significant decrease (p ≤ .05) in the fibre content of both FEC and UEC (9.16% and 11.49%) confirms reports by Kouřimská and Adámková (2016) that edible insects like crickets consist of insoluble fibre called chitin, mainly found on the exoskeleton. Thus, the decrease in fibre after processing (milling, water addition) could be linked to particle reduction that allows for fibre breakage and, ultimately, reduces its content (Melgar-Lalanne et al., 2019). Furthermore, extended exposure to high temperatures can cause glycosidic bond breaks and alter the fibre composition (Errico et al., 2021). Fat content showed a significant decrease (p ≤ .05) in FEC (15.50%) in contrast to the significant increase (p ≤ .05) observed in UEC (16.57%). The significant increase (p ≤ .05) in fat content in UEC could be due to the confirmed reports that ultra-sonication is utilised as an effective extraction tool for isolating fats and oils from various matrices, such as animal tissues, plant seeds, and insects, thus leading to an increased fat content unlike in FEC (Khadhraoui et al., 2021). In addition, the edible insect’s general lipid composition is different, which affects the total content (Otero et al., 2020). A significant increase (p ≤ .05) in protein content is observed in all processed EC flours compared to REC (75.62%), specifically in UEC (77.22%). Ultra-sonication can enhance the solubility of proteins by breaking down large protein aggregates into smaller, more soluble units. This makes the proteins more easily extractable, which can lead to a perceived increase in protein content when analysed, especially in assays that measure soluble protein (Gharibzahedi & Smith, 2020).
Functional properties of raw and processed FM and EC flour samples
The applicability of processed flours (malted, fermented, ultra-sonicated) for postprocessing depends on excellent functional characteristics. There was a significant difference (p ≤ .05) in all processed (malted, fermented, and ultra-sonicated) FM flours. As shown in Figure 2 (the functional properties of raw and processed finger millet and edible cricket flour), UFM showed a significant decrease (p ≤ .05) in both packed bulk density and loose bulk density (0.56 and 0.43 g/cm) compared to MFM (0.75 and 0.54 g/cm) and FFM (0.64 and 0.48 g/cm). Low bulk and loose density are desirable to improve digestion in developing supplements and complementary meal composition (Chinma et al., 2020). When observing EC flour samples, the packed bulk density and loose bulk density in UEC showed a significantly low (p ≤ .05) bulk and loose density (0.31 and 0.23 g/cm) compared to FEC (0.44 and 0.35 g/cm), indicating a similar trend compared to UFM flours, indicating that ultra-sonication can also alter the particle size distribution of grains (Gnanavelbabu et al., 2020). In addition, when the grains are ground into flour or the flour is blended into smaller particles, sonication might further reduce particle size or affect agglomeration. Hence, the smaller the particle size, the more uniform particles can have lower bulk density because they tend to pack less efficiently compared to larger, irregular particles (Ye et al., 2024).
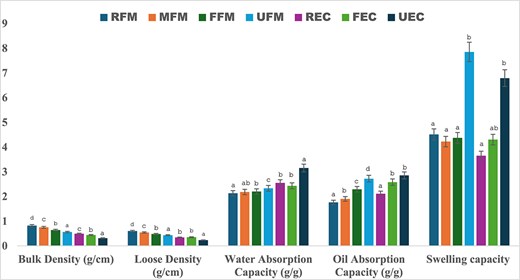
Functional properties of raw and processed finger millet and edible cricket flour. Different letters within a group of bars are significantly different at p ≤ .05.
The swelling power (ml) of FM flour samples decreased significantly (p ≤ .05) in MFM (16.00 ml) and FFM (16.50 ml) compared to RFM (18.50 ml), which could be linked to the decrease in fibre observed in Table 1, whereby it decreased the intensity of swelling (Yang et al., 2022). Furthermore, a significant increase (p ≤ .05) was observed in UFM (19.25 ml), suggesting that EC flours significantly increased (p ≤ .05) in swelling power compared to REC (19.50 ml), i.e., FEC (20.50 ml) and UEC (23.00 ml). Increased swelling power due to ultra-sonication can be advantageous in producing softer and more palatable food products (Gill et al., 2023). The increased swelling power in UFM (19.25 ml) and UEC (23.00 ml) indicates that the disruption of cell walls increases the surface area and availability of starch for water absorption, thereby increasing the swelling power of the flour samples (Gill et al., 2023).
The water absorption index (WAC) and oil absorption capacity (OAC) of flour are crucial functional properties of flour and play a significant role in food processing and the quality of the final product. For example, a moderate amount of OAC is preferred for the in-process holding fat, retaining flavour, and maintaining palatability, while a high WAC is recommended for greater thickening capacity, hydration, and satiety (Gupta et al., 2018). UFM showed a significantly higher (p ≤ .05) WAC and OAC (2.33 and 2.72 g/g) compared to FFM (2.20 and 2.29 g/g) and MFM (2.18 and 1.90 g/g), further emphasising that ultra-sonication impacts functional properties positively. In addition, UEC also showed a significantly higher (p ≤ .005) WAC and OAC (3.15 and 2.85 g/g) compared to FEC (2.43 and 2.58 g/g). Overall, ultra-sonication emerged as a more suitable technique for improving the quality of the functionality of flour products in both FM and EC flours.
Pasting properties of unprocessed and processed FM and EC flour samples
Table 2 presents the pasting properties of FM and EC unprocessed and processed flours. Finger millet is a cereal grain with a carbohydrate content of close to 81.5%; it can be used in various ways and is an excellent substitute for other grains such as rice and other starchy grains. Therefore, the pasting behaviour of flour may be significantly affected by the starch properties (Dash et al., 2021). The FFM pasting profile was considerably higher (p ≤ .05) compared to MFM and UFM samples, ultimately suggesting a longer cooking time. A significantly high (p ≤ .05) breakdown in the FFM flour sample (763.35 cP) indicates an inadequate stability of its starch paste as a result of the enlarged granules’ susceptibility to heat shearing (Amoo, 2014; Kewuyemi et al., 2021). In contrast, the significantly low (165.35 cP) breakdown in the MFM flour sample suggested that owing to its cross-linking qualities, starch is more resilient to heat and shear stress when cooking (Kewuyemi et al., 2021). In addition, the breakdown demonstrates the stability of paste during cooking, and the increased level of EC in a composite could lead to significantly lower starch granules’ propensity to dissolve during therapy (Combrzyński et al., 2023). The FEC flour sample showed a significantly low (p ≤ .05) breakdown (2.07 cP) compared to the UEC (12.30 cP) and REC (12.53 cP); in this instance, the FEC is more acceptable since the breakdown signifies much better stability than the UEC.
Pasting properties profile of unprocessed and processed finger millet and edible cricket flour samples.
| Parameters | RFM | MFM | FFM | UFM | REC | FEC | UEC |
|---|---|---|---|---|---|---|---|
| Breakdown (cP) | 305.10b ± 5.09 | 165.35a ± 23.40 | 763.35d ± 26.94 | 506.35c ± 7.70 | 12.53b ± 7.42 | 2.07a ± 2.93 | 12.03b ± 0.00 |
| Peak viscosity (cP) | 345.25b ± 10.81 | 175.00a ± 19.65 | 2019.50d ± 103.94 | 624.85c ± 1.90 | 12.55b ± 7.42 | 2.81a ± 1.90 | 12.80b ± 0.00 |
| Final viscosity (cP) | 49.18b ± 8.83 | 11.49a ± 4.29 | 1275.00d ± 87.68 | 139.85c ± 11.52 | 4.56a ± 2.50 | 10.25b ± 0.39 | 11.93c ± 0.00 |
| Pasting temperature (°C) | 93.35b ± 0.07 | 92.30a ± 0.28 | 94.95c ± 0.07 | 93.30b ± 0.00 | 94.85b ± 0.35 | 90.65a ± 5.02 | 94.85b ± 0.07 |
| Peak time (min) | 20.45a ± 0.07 | 20.20a ± 0.42 | 25.35b ± 0.49 | 20.50a ± 0.00 | 17.40b ± 9.05 | 18.90b ± 4.94 | 11.65a ± 0.07 |
| Setback (cP) | 296.10b ± 1.97 | 163.55a ± 23.97 | 744.50d ± 16.54 | 484.95c ± 9.54 | 14.33b ± 0.96 | 13.07b ± 1.50 | 0.86a ± 0.00 |
| Trough viscosity (cP) | 256.00b ± 3.95 | 153.90a ± 27.71 | 511.25d ± 61.16 | 366.45c ± 19.16 | 14.29b ± 0.98 | 12.33b ± 2.53 | 0.09a ± 0.00 |
Note. Values represent mean ± standard deviation of triplicate measurements. Different letters within a row are significantly different at p ≤ .05. cP = centipoise; RFM = raw finger millet; MFM = malted finger millet; FFM = fermented finger millet; UFM = ultra-sonicated finger millet; REC = raw edible cricket; FEC = fermented edible cricket; UEC = ultra-sonicated edible cricket.
Higher peak viscosity indicates more starch damage, which suggests that the starches in the flour have a greater capacity to swell freely and produce a viscous paste before the breakdown of viscosity (Palabiyik et al., 2017). The FFM flour sample had a significantly higher (p ≤ .05) peak viscosity (2019.50 cP) compared to MFM (175.00 cP) and UFM (624.85 cP), implying that the FFM flour is a good choice for culinary applications that require considerable flexibility and gel strength. It is possible that fermentation altered the FFM in a way that made it easier for moisture to enter its starch granules, increasing amylose leaching and enhancing peak viscosity (Adepehin, 2020; Kewuyemi et al., 2021). In contrast, FEC had a significantly low (p ≤ .05) peak viscosity (2.81 cP), suggesting a poor viscous paste unless fortified with FM flour. The low peak viscosity in edible insects, like grey crickets in this study could be because the proteolysis reduces the structural integrity of proteins, which weakens their ability to form strong networks that trap water and contribute to viscosity. The UEC showed a significantly high (p ≤ .05) peak viscosity (12.80 cP), which correlates with the scientific findings on the functional properties in Table 2, thus proving that ultra-sonication is a technique that successfully improves the functional properties of insects. Furthermore, the modifications to the structure of proteins, carbohydrates, and other components in fermented insects ultimately affect peak viscosity during the pasting process (Carvalho et al., 2023).
During cooling, final viscosity is the degree of structural realignment of leached starch molecules, and the interactions between intact remaining granules are related to the ultimate viscosity (Kewuyemi et al., 2021; Ma et al., 2022). MFM showed significantly low (p ≤ .05) final viscosity (11.49 cP) compared to FFM (1275 cP) and UFM (139.85 cP). This result suggests that the low final viscosity in MFM could have been a result of the capacity to create a gel or thick paste, which might have come about as a result of starch molecules breaking down in the presence of metabolic byproducts such as organic acids (Kewuyemi et al., 2021). In addition, the proteolytic activity of the fermenting microbe, which unfolds starch from the protein matrix, may have contributed to the rise in ultimate viscosity in FFM (1,275 cP) (Garrido-Galand et al., 2021; Kewuyemi et al., 2021). Ultra-sonicated edible cricket showed a significantly high (p ≤ .05) final viscosity (11.93 cP) compared to FEC (10.25 cP).
Pasting temperature is the reference temperature for the initial viscosity change caused by the swelling of starch granules (Kumar & Khatkar, 2017). Furthermore, the heat in pasting involves mediated granular swelling and the transformation of the starch granules in excess water from an ordered to a disordered state, the exudation of the molecular components, and, eventually, the total rupture of the starch granules (Kumar & Khatkar, 2017). In addition, FFM was shown to increase significantly (p ≤ .05) in pasting temperature (94.95 °C) compared to MFM and UFM (92.20 and 93.30 °C), which decreased significantly (p ≤ .05) in pasting temperature. The possibility of the decrease in the pasting temperatures of MFM and UFM flour samples could be attributed to the impact of enzymatic biomodification and the presence of their metabolic products (Garrido-Galand et al., 2021). Moreover, it is related to the endosperm cell wall of the grain being broken down by enzymes, which allow the exposed starch and protein to absorb water and quickly achieve a pasting temperature (Roman et al., 2017). The lower pasting temperature of most isolated pure cereals is attributed to the high water-holding capacity of the starches and the starch concentration (Onwurafor et al., 2020).
Fermented edible cricket displayed a significantly low (p ≤ .05) pasting temperature (90.65 °C) compared to UEC (94.85 °C), suggesting a shorter cooking time than with UFM, thus indicating that fermentation leads to the production of organic acids (e.g., lactic acid and acetic acid), which lower the pH of the cricket powder (Galli et al., 2020). Thus, an acidic environment destabilises the interactions between proteins, fibres, and any starches present in the mixture, thereby weakening their structures. The weakened structure reduces the temperature required to disrupt these molecules, resulting in a lower pasting temperature. The peak times of the unprocessed and processed FM flour samples demonstrated that MFM (20.45 min), UFM (20.50 min), and RFM (20.45 min) did not differ significantly (p ≤ .05), whereas FFM (25.35 min) was significantly higher (p ≤ .05), suggesting that MFM and UFM can be cooked within a short duration compared to FFM. Fermented edible cricket (18.90 min) demonstrated that it can be cooked much longer than UEC (11.65 min).
The significant reduction (p ≤ .05) setback of MFM (163.55 cP) compared to FFM (744.50 cP) and UFM (484.95 cP) might suggest increased starch molecule breakdown by enzymes during germination in the malting process, which would slow down the rate at which starch chains reassemble structurally (Kewuyemi et al., 2021; Xu et al., 2019). On the other hand, FFM had a significantly higher (p ≤ .05) setback viscosity (744.50 cP), which can result from the starch chains quickly realigning and the hydrogen bonds getting stronger (Kewuyemi et al., 2021; Xu et al., 2019). In contrast, UEC (0.86 cP) showed a significantly reduced (p ≤ .05) setback compared to FEC (13.07 cP), which jointly reduced significantly (p ≤ .05) compared to REC (14.33 cP). The latter result aligns with Khatun et al. (2021), who have found that the setback viscosity of processed cricket flour leads to lower gel stability and sensitivity to retrogradation, probably caused by the more difficult re-association of the starch molecules due to the higher protein and lipid content. The trough viscosity of MFM (153.90 cP) significantly decreased (p ≤ .05) compared to the significantly high (p ≤ .05) trough viscosity of FFM (511.25 cP) and UFM (366.45 cP), respectively. The decrease might indicate that the degraded starch granules of the malted flours had a low hot paste viscosity (Kewuyemi et al., 2021). The trough viscosity in EC flours showed a significant reduction (p ≤ .05) in UEC (0.09 cP) compared to FEC (12.33 cP), which jointly displayed a significant reduction (p ≤ .05) compared to REC (14.29 cP).
Colour properties of unprocessed and processed FM and EC flour samples
Colour is a key factor in determining people’s preferences and is an early indicator of desired food quality (Muniz et al., 2023). Table 3 presents the objective colour profiling of the flours. Generally, the results revealed that RFM (4.21 a*) and MFM (4.21 a*) had a significantly higher (p ≤ .05) redness (a*) compared to FFM (3.81 a*) and UFM (3.54 a*). Both RFM (29.96) and MFM (27.21) had a significantly high (p ≤ .05) corresponding BI. In contrast, the FFM and UFM flour samples significantly increased (p ≤ .05) in lightness (L*), (ranging from 48.56 to 51.11) and yellowness (b*), (9.54 and 9.12). The colour of the grain seed coat might impact these notable variations significantly. FFM exhibited a significant increase (p ≤ .05) in lightness (48.56 L*) and the lowest redness (a*). The reduced redness of the flour sample might have led to its total low BI. The higher BI indicates the extent to which the browning is impacted by the fermentation process. In other words, the fermentation and ultra-sonication process with FM flour reduced its redness and BI and heightened the intensity of the yellowness (b*) and lightness (L*) slightly. Conversely, the UFM displayed a better lightness intensity (51.11), and the FFM had a better redness intensity (9.54). The proteolytic breakdown might have produced monomers for biosynthesis, such as amino acids, which could have caused the maximum redness, BI, overall colour variations, and lowest lightness of the RFM and MFM (Kewuyemi et al., 2021; Siepmann et al., 2019). The probable differences in the lightness of the FM sample are partly related to the earlier observed low MFM TPC (3.79 mg GAE/g, Table 1), suggesting that the leaching of polyphenol constituents during the germination step improved the lightness intensity.
Colour properties of unprocessed and processed finger millet and edible cricket flour samples.
| Parameters | RFM | MFM | FFM | UFM | REC | FEC | UEC |
|---|---|---|---|---|---|---|---|
| L* | 44.13a ± 0.08 | 44.13a ± 0.09 | 48.56b ± 0.11 | 51.11c ± 0.16 | 16.80a ± 0.09 | 29.48c ± 0.21 | 17.36b ± 0.18 |
| −a*/a* | 4.21c ± 0.07 | 4.21c ± 0.07 | 3.81b ± 0.04 | 3.54a ± 0.04 | 4.57b ± 0.06 | 4.87c ± 0.06 | 4.17a ± 0.04 |
| b* | 9.19a ± 0.04 | 9.19a ± 0.04 | 9.54b ± 0.05 | 9.12a ± 0.03 | 16.85b ± 0.11 | 17.15c ± 0.12 | 16.09a ± 0.12 |
| BI | 29.96d ± 0.28 | 27.21c ± 0.23 | 24.35b ± 0.20 | 22.71a ± 0.20 | 228.35c ± 2.29 | 95.29a ± 1.24 | 196.04b ± 1.89 |
Note. Values represent mean ± standard deviation of triplicate measurements. Different letters within a row are significantly different at p ≤ .05. BI = browning index; RFM = raw finger millet; MFM = malted finger millet; FFM = fermented finger millet; UFM = ultra-sonicated finger millet; REC = raw edible cricket; FEC = fermented edible cricket; UEC = ultra-sonicated edible cricket.
In contrast, REC and UEC showed a significantly high (p ≤ .05) BI (ranging from 228.35 to 196.04) compared to FEC (95.29), suggesting a higher intensity in the BI in FEC in contrast to UEC. The lightness of REC and UEC lightness decreased (p ≤ .05), (ranging from 16.80 to 17.36), and the lightness of FEC (29.48) significantly increased (29.48), which could be attributed to the nonenzymatic reaction during fermentation, participation of Amadori rearrangement compounds, and Maillard reaction intermediates, such as melanoidins and reductones (Cho et al., 2018).
Thermal properties of raw and processed FM and EC flour samples
Processing methods, malting, fermentation, and ultra-sonication significantly increased (p ≤ .05) the onset (98.49–112.37 TO) (see arrow in Figure 3A indicating the range of onset temperature), peak (108.23–112.93 TP), and conclusion temperatures (129.01–131.53 TC) of the raw and processed FMFs. Endothermic enthalpy (ΔH) significantly decreased (p ≤ .05) (3,083.99–2,858.09 J/g). The increase in onset, peak and conclusion temperatures could be associated with the increase in acid concentrations, as observed in the reduced pH after the processes (Figure 3A and B), which promoted modifications of the starch granules. Further to this, the starch–sugar interactions during the germination step and fermentation processes lead to competition for water and a modification of the thermal properties. Previous studies have reported such observations with the ultra-sonication process, ascribing it to the increase of starch molecular interaction and the interplay between starch and other food constituents, such as proteins, sugars, and fats (Azeez et al., 2022). FFM and UFM flour samples had the highest gelatinisation temperatures, followed by MFM, while FFM and UFM had a significantly low temperature (p ≤ .05) ΔH.
Figure 3A Endothermic flow chart of results obtained for FM flour samples, which align with Azeez et al. (2022) on brown FM, i.e., increased gelatinisation temperatures and decreased in ΔH after processing. Furthermore, the increase in gelatinisation temperatures may be attributed to the modification of proteins during germination and/or fermentation that resulted in the production of amino acids (Azeez et al., 2022). Endothermic enthalpy decreased from (3083.99 J/g) in MFM to (1996.95 J/g) in FFM, suggesting that MFM has higher crystallinity and molecular order than fermented and ultra-sonicated FM flour samples. Furthermore, the decrease observed in FFM could suggest that the processing method disrupted the structural organisation of crystallite and amorphous regions. This finding also implies that less energy would be required to disintegrate the starch granules’ intermolecular hydrogen bonds of fermented flour (Chinma et al., 2020). On the other hand, when ECs were fermented and ultra-sonicated, the outcome showed a significant decrease (p ≤ .05) in onset (89.82–87.50 TO), and a significant increase (p ≤ .05) in peak (105.28–108.61 TP) and endset temperatures (123.62 and 134.15 TC). Endothermic enthalpy (ΔH) showed a significant increase (p ≤ .05) in REC (2755.23 J/g) compared to the significant decrease (p ≤ .05) in FEC and UEC (1481.05 to 1746.78 J/g). This result ultimately suggests that fermentation had a significant impact on the decrease of enthalpy, and ultra-sonication significantly increased (p ≤ .05) enthalpy in both FM and EC flours.
Conclusion
The impact of traditional and novel processing techniques on the biochemical, nutritional, and functional properties of FM and EC exhibited a significant increase in nutritional, functional, and health-promoting benefits. Ultra-sonication notably increases TFC levels in FM, while fermentation improves TFC in ECs. Antioxidant levels, measured by ABTS and FRAP assays, significantly increased across all processing methods. These improvements underscore the potential health benefits of malting, fermentation, and ultra-sonication. The processed FM samples, particularly FFM and UFM, exhibited enhanced protein, fibre, and ash content, suggesting their suitability for creating nutrient-dense food products. The reduced fibre and increased energy content in processed EC flours suggest improved digestibility. Ultra-sonication also significantly enhanced the functional properties of both FM and EC flours, making them ideal for thickening agents in food product development, further food processing, and increasing consumer acceptability. Furthermore, the favourable bulk density suggests a potential for improving texture in baked goods. Thermal and pasting properties indicated that FFM and FEC indicate superior gelatinisation temperatures and peak viscosities. In light of these findings, future research could further investigate fermentation and ultra-sonication as processing techniques to improve underutilised food sources like FM and ECs.
Data availability
The data supporting the findings of this study are available upon request from the corresponding author.
Author contributions
Zamancwane Pretty Mahlanza (Investigation, Methodology, Visualisation, Validation, Writing—original draft), Oluwaseun Peter Bamidele (Methodology, Visualisation, Validation, Writing—review & editing), Samson Adeoye Oyeyinka (Methodology, Visualisation, Validation, Writing—review & editing), Jon Wilkin (Methodology, Resources, Visualisation, Validation, Writing—review & editing), and Oluwafemi Ayodeji Adebo (Conceptualisation, Methodology, Funding acquisition, Project administration, Resources, Validation, Supervision, Visualisation, Writing—review & editing), Oluwaseun Peter Bamidele (Methodology, Supervision, Validation, Visualisation, Writing—review & editing [equal]), Samson Oyeyinka (Methodology, Supervision, Validation, Visualisation, Writing—review & editing [equal]), Jonathan Wilkin (Methodology, Resources, Supervision, Validation, Visualisation, Writing—review & editing [equal]), and Oluwafemi Ayodeji Adebo (Conceptualization, Funding acquisition, Project administration, Supervision [lead], Methodology, Resources, Validation, Visualisation, Writing—review & editing [equal]).
Funding
The authors acknowledge the National Research Foundation (NRF) of South Africa Doctoral Scholarship (Grant number: PMDS22072143585) and the South African Association of Food Science and Technology (SAAFoST) Brian Koeppen Scholarship awarded to Zamancwane Pretty Mahlanza. We also appreciate funding through NRF of South Africa Support for Rated and Unrated Researchers (Grant number: SRUG2204285188), the University of Johannesburg Faculty of Science and University Research Committee Grant and the South African Medical Research Council (SAMRC) Self-Initiated Research (SIR) Grant awarded to Oluwafemi Ayodeji Adebo. This study was also supported through the European Union Erasmus + Key Action 107 International Credit Mobility Project.
Conflicts of interest
The authors declare no conflict of interest.
References
Gupta, S., Chhabra, G. S., Liu, C., Bakshi, J. S., & Sathe, S. K. (2018). ``
