


Abstract
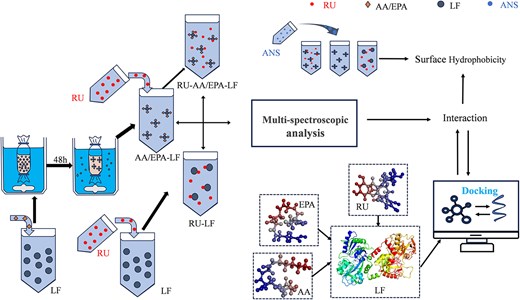
The interaction mechanism of lactoferrin (LF) with arachidonic acid (AA)/eicosapentaenoic acid (EPA) and rutin (RU) was investigated by spectroscopic method and molecular docking technique. The investigation revealed that LF and AA/EPA bind to form a stable complex. The quenching mechanism of RU on LF and the LF-fatty acid complex was identified as static quenching. The thermodynamic analysis further substantiated that the bonding process was characterised by an endothermic nature and driven by entropy, with hydrophobic interaction serving as the predominant driving force. Synchronous fluorescence analysis revealed a closer proximity of the interaction site to the tryptophan residue, which was further confirmed by three-dimensional fluorescence and 8-Amino-1-naphthalenesulfonic acid fluorescence assays. The molecular docking study revealed the binding sites of LF with unsaturated fatty acids and RU. The present study elucidated the microscale interactions between LF and bioactive compounds, thereby providing a theoretical foundation for the creation of innovative functional foods and supplements.
Introduction
Functional foods, containing bioactive ingredients that modulate physiological processes, possess inherent nutritional value and hold potential for promoting health benefits, thereby garnering extensive attention (Essa et al., 2023). Lactoferrin (LF), an iron-binding glycoprotein abundant in emulsion, exhibited a diverse range of biological activities including antibacterial, antitumour, and immunomodulatory effects (Jiang & Lonnerdal, 2017). Moreover, it exerted regulatory influence over the processes of cell proliferation and differentiation. The polyunsaturated fatty acid (PUFA), an essential nutrient for the human body, has been found to play a crucial role in the regulation of inflammation, cholesterol metabolism, as well as brain and neural tissue development (Palacios et al., 2022). Rutin (RU), the main glycoside discovered in quercetin, possesses a flavonoid chemical structure and functions as a fat-soluble bioactive compound (Semwal et al., 2021). This compound exhibited high efficacy in combating bacteria, possessed a strong capacity for metal chelation, and displayed resistance to oxidation. These properties not only improved the quality of food products but also underscored its considerable biological potential (Guo et al., 2023).
The molecular weight of bovine lactoferrin (bLF) was approximately 80 kDa, and it consisted of nearly 700 amino acid residues (Dyrda-Terniuk & Pomastowski, 2023). The polypeptide chain underwent folding, resulting in the formation of two homologous globular lobes that were further divided into N and C leaves. Each lobe consisted of approximately 345 amino acids and was comprised of distinct structural regions, namely N1, N2, C1, and C2 (Figure 1) (Bastos et al., 2018). LF was administered to children as a dietary supplement in numerous countries due to its extensive range of functional properties, such as immunomodulatory effects, bacteriostatic activity, anticancer properties, and promotion of tissue cell regeneration (Moreno-Exposito et al., 2018). Yan et al. (2021) conducted a study on the interaction mechanism of ginsenoside (Rg3) and LF, which aimed to overcome the water insolubility issue of Rg3 and broaden its application in the field of food health biology. The interaction between proanthocyanidins and LF was investigated by Li et al. (2021). The results showed that the addition of proanthocyanidins significantly enhanced the foaming properties of LF. The interaction between bovine α-whey protein and β-lactoglobulin was investigated by Meng et al. (2020), who found that C18 unsaturated fatty acids facilitated the development of protein structure and enhanced its hydrophobicity. LF-specific cell surface receptors have been identified on various tissues and cell types, including macrophages, monocytes, platelets, intestinal cells, and low-density lipoprotein receptors. Oral supplementation of LF can exert beneficial effects on the human body through its interaction with intestinal epithelial cells (Gajda-Morszewski & Brindell, 2021).
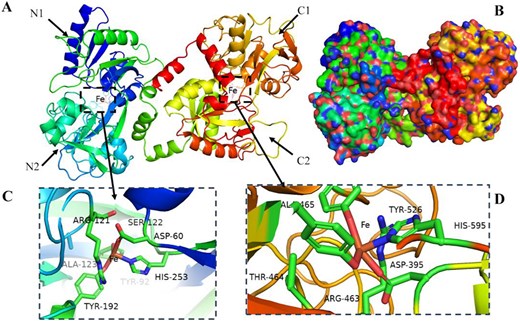
Lactoferrin secondary structure (A), surface model (B), and binding iron site structure (C, D).
The long-chain PUFA arachidonic acid (AA) was found to be the most abundant and widely distributed n-6 fatty acid in the human body, comprising 40%–50% of total PUFAs in the brain and nervous tissue (Tallima & El Ridi, 2018). AA serves as a precursor for the synthesis of diverse bioactive compounds within the human body, including prostaglandins, leukotrienes, and platelet-activating factors, while its metabolites play a pivotal role in immune response regulation and haemostasis promotion (Zhang et al., 2023). Since the human body cannot synthesise AA, it must be obtained through the diet and metabolised accordingly (Kawashima, 2019). Recently, AA has been increasingly incorporated into food health products, particularly in infant formula, milk, and related items, as a nutritional supplement (Lien et al., 2018).
Eicosapentaenoic acid (EPA) is a pivotal member of the omega-3 PUFA series. Previous research has demonstrated that prolonged consumption of EPA-rich foods can exert numerous advantageous effects on human physiology, encompassing lipid metabolism regulation, attenuation of atherosclerosis (Loor et al., 2019), anti-inflammatory and antioxidant properties, facilitation of pneumonia treatment, enhancement of endothelial function (Banaszak et al., 2024), and overall improvement in bodily well-being. Furthermore, administration of a highly refined and quality-controlled prescription formulation containing 4 g/day of EPA was found to confer significant cardiovascular benefits (Sherratt et al., 2020). The unsaturated double bonds in fish oil rich in EPA are susceptible to degradation from light, heat, oxygen, and metal ions during food processing, leading to significant alterations in its structure and function (Chen et al., 2022). Furthermore, the marine environment deteriorated and resulted in fish oil products containing organic compounds such as dioxins and dioxin-like polychlorinated biphenyls that exceeded the maximum allowable limit for human consumption (Merkle et al., 2017). As a result, the supplementation of EPA through fish oil presented risks. The research demonstrated that the incorporation of microalgae into feed significantly enhanced the levels of unsaturated fatty acids, including EPA and docosahexenoic acid (DHA), in milk (Orzuna-Orzuna et al., 2023), which could serve as a substantial source of EPA supplementation for human consumption.
The low water solubility, limited stability, and restricted membrane permeability of RU hinder its application in functional foods as a nutritional supplement (Lopez-Polo et al., 2024). Studies utilising β-casein encapsulation of RU have demonstrated enhanced bioavailability, sustained release, and effective preservation of antioxidant activity through protein binding (Sengupta et al., 2023). The utilisation of glucoseglycosylated zein encapsulating RU enhanced the bioaccessibility of RU in a simulated gastrointestinal environment (Yang et al., 2024).
In this study, eicosane unsaturated fatty acids (AA, EPA) were combined with LF to form a complex of fatty acids and proteins. The binary system (RU-LF) and ternary systems (RU-AA-LF, RU-EPA-LF) were constructed by gradually adding RU. The spectroscopic method was employed to investigate the binding mode, binding site, thermodynamic parameters, and the impact of these interactions on protein structure. The molecular docking method was utilised to predict interactions between small and large molecules (Xie et al., 2024). The scoring was utilised to predict the binding strength or binding affinity between two molecules, providing supportive insights for spectroscopic investigations on biological macromolecules. This study aimed to elucidate the interaction mechanisms of bioactive substances within food systems, using LF as a carrier to deliver functional compounds such as unsaturated fatty acids and RU to the human body. These complexes exerted their effects through specific binding to protein receptors. The findings provided a theoretical foundation and insights for the development of functional foods and nutritional products with targeted biological activities.
Materials and methods
Materials
Transferrin (purity ≥95%) was obtained from Shanghai Yuan Ye Biotechnology Co., Ltd. RU (purity ≥98%), AA (purity ≥95%), and EPA (purity ≥95%) were purchased from Shanghai Macklin Biochemical Technology Co., Ltd. The above were analytical standards. ANS (8-Amino-1-naphthalenesulfonic acid) (purity ≥97%, analytical grade) was sourced from Sigma-Aldrich. Disodium hydrogen phosphate, monosodium phosphate, and anhydrous ethanol of analytical grade were supplied by Tianjin Ke Mi Ou Chemical Reagent Co., Ltd.
Sample solution preparation
The LF and RU were dissolved in a 10 mM phosphate-buffered saline (PBS, pH = 7.0) to prepare LF stock solution with a concentration of 1 mg/ml and RU stock solution with a concentration of 0.4 mg/ml, respectively. These solutions were stored at 4 °C for subsequent use.
The LF and AA/EPA complexes were prepared according to the method described by (Fang et al., 2014). LF, AA, and EPA were mixed at a molar ratio of 1: 50 and swirled at 45 °C for 20 min. The unreacted AA and EPA were then removed by low temperature centrifugation (10,000 rpm at 4 °C for 15 min). Subsequently, the dialysis bag (model: MW3500D) was immersed in PBS buffer solution continuously stirred at low temperature for 48 hr (4 °C), and the buffer was changed every 8 hr. After dialysis, the resulting AA-LF and EPA-LF complexes were stored in equal parts at −20 °C for future application.
The LF, AA-LF, and EPA-LF were diluted to a uniform solution of 0.2 mg/ml. Then, the RU solution was added 1:1 in gradient (0, 0.0025, 0.005, 0.0075, 0.01, 0.025, 0.05 mg/ml). The mixture was gently swirled for 2 min and allowed to react at room temperature for 10 min while maintaining LF at a controlled temperature of 45 °C for reference purposes human lactoferrin (hLF). The analysed samples included LF, hLF, AA-LF, EPA-LF, RU-LF, RU-AA-LF, and RU-EPA-LF.
The determination of fatty acid content in protein-fatty acid complex
The final molar ratio of fatty acid to protein in AA-LF and EPA-LF complexes was determined using a free fatty acid (FFA) kit (colorimetric method) and calculated using formula (1).
In formula (1), Ameasure, Ablank, and Astandard represent the absorbance of the measurement tube, blank tube, and palmitic acid standard, respectively. Cstandard represents the concentration of the palmitic acid standard (1,000 μmol/L).
UV–visible absorption spectra
The UV spectrum of the mentioned test sample was scanned at room temperature within a wavelength range of 250–400 nm.
Fluorescence spectrum determination
The fluorescence quenching spectra of LF, hLF, AA-LF, and EPA-LF samples were scanned at room temperature. The excitation wavelength was set to 280 nm with a gain photomultiplier tube (PMT) of 350 V. The excitation and emission bandwidth were both set to 10 nm.
The scanning speed was set to 1,000 nm/min within the range of 295–450 nm. RU-LF, RU-AA-LF, and RU-EPA-LF samples were reacted in a water bath for 10 min at temperatures of 298, 304, and 310 K, respectively. Subsequently, the fluorescence spectra were scanned using the same parameters as mentioned above. The final working liquid should not contain more than 2% (vol/vol) ethanol.
Quenching type
The fluorescence quenching mechanism of RU on LF and LF-fatty acid complex was determined using the Stern–Volmer equation (2).
In equation (2), F0 represents the intrinsic fluorescence of LF, while F represents the intrinsic fluorescence of LF after binding with RU. Kq denotes the quenching rate, and τ0 signifies the fluorescence lifetime of LF, which is 10−8 s (Yan et al., 2021); KSV corresponds to the Stern–Volmer quenching constant.
Binding constant and binding site
The binding constants and number of binding sites for the complexes of RU and LF, as well as LF and AA, and EPA were determined using the double logarithm equation (3).
In formula (3), Ka denotes the association constant, while n represents the number of associating units.
Thermodynamic parameters and forces
The thermodynamic parameters (enthalpy change, entropy change, and Gibbs free energy) are determined by employing the Van’t Hoff equation (4) and the thermodynamic equation (5). Based on these calculated parameters, we infer the driving force of the reaction between RU and LF as well as the interaction between LF and AA in EPA complexes.
In equations (4) and (5), K represents the association constant; T represents absolute temperature; R represents the gas constant, which is 8.314 J·mol−1 K−1; ΔH represents enthalpy change; ΔS represents entropy change; and ΔG represents Gibbs free energy change. The type of interaction force can be determined based on the magnitude and sign of these parameters: electrostatic interaction occurs when ΔH < 0 and ΔS > 0, hydrophobic interaction occurs when ΔH > 0 and ΔS > 0, while hydrogen bonding and van der Waals forces occur when ΔH < 0 and ΔS < 0 (Ren et al., 2019).
Bonding distance
The energy transfer efficiency E and the binding distance r between LF and RU are calculated using formula (6), where: E represents the energy transfer efficiency; F0 denotes the fluorescence intensity of LF in the absence of RU; F indicates the fluorescence intensity when LF and RU are present at a 1:1 concentration ratio; R0 represents the critical distance at which the transfer efficiency is 50%; r signifies the binding distance between LF and RU.
The R0 value is calculated using formula (7): In the formula, K2 represents the spatial orientation factor with a fixed value of ⅔; N denotes the refractive index of the medium, which is measured as 1.336; ϕ indicates the quantum yield and its value is set at 0.15; J represents the spectral overlap integral between LF’s fluorescence emission spectrum and RU’s ultraviolet absorption spectrum.
The value of J is calculated based on formula (8), where F(λ) represents the fluorescence intensity of the LF system at wavelength λ, and ε(λ) denotes the molar absorption coefficient of RU at wavelength λ.
Synchronous fluorescence spectrometry
Synchronous fluorescence spectroscopy was employed to analyse the sample at ambient temperature. In the reaction system, the excitation and emission wavelength intervals (△λ) were set at 15 and 60 nm, respectively, with a scanning range of wavelengths adjusted between 200 and 500 nm. The data acquired from synchronous fluorescence measurements were recorded under identical conditions as those utilised for fluorescence spectrometry.
Three-dimensional fluorescence spectrometry
The three-dimensional fluorescence spectrum of the sample was recorded at room temperature. The spectral recording range extended from 200 to 500 nm with a step size of 10 nm, and the scanning rate was set at 10,000 nm/min. All other experimental conditions remained consistent with those employed in fluorescence spectrometry.
Surface hydrophobicity measurement
The impact of AA, EPA, and RU on the surface hydrophobicity of LF was evaluated by employing ANS as a fluorescent probe. The fluorescence spectrum was configured with an excitation wavelength of 390 nm, both excitation and emission slit widths set at 10 nm, and a voltage of 350 V applied. All other conditions remained consistent with those employed in fluorescence spectrometry. The volume ratio of ANS to sample was maintained at 1:200, while PBS served as the blank control group. The surface hydrophobicity of the solution was quantified through measurement of the emitted fluorescence intensity by ANS.
Fluorescence spectroscopy
RU was added at the maximum concentration (0.05 mg/ml), and the sample was lyophilised using a freeze-dryer. The lyophilised sample was then mixed with dried KBr at a 1:100 ratio, ground, and compressed into tablets for analysis (Racz et al., 2023). Fourier-transform infrared (FT-IR) analysis was conducted using a Nicolet 6700 FT-IR spectrometer (Thermo Fisher Scientific, Shanghai, China) over a wavelength range of 4,000–400 cm−1. The spectral resolution was set to 4 cm−1, and 32 scans were recorded (Wang et al., 2024).
Molecular docking
The CDOCKER method was employed for molecular docking analysis, utilising the three-dimensional structure of LF (PDB: 1blf) retrieved from the RCSB PDB protein database. The 2D structures of RU (CID: 45479757), AA (CID: 444899), and EPA (CID: 446284) were obtained from the PubChem database. Subsequently, these structures were imported into Discovery Studio for optimisation using default parameters for docking procedures. The active site coordinates of LF were defined as (83.6606, 41.8473, 6.92322, 13.6766), with an active radius of 14 Å. Based on interaction energy calculations, the optimal docking positions between LF and the three samples were determined and further analysed.
Data analysis
Origin 2022, Peakfit 4.12, and Spass20.0 were utilised for data analysis and visualisation, while PyMol software and Discovery Studio 2019 were employed for molecular docking result visualisation.
Results and discussion
Molar ratio of fatty acid-LF complex
The final molar ratio of protein macromolecule to fatty acid small molecule in the AA-LF and EPA-LF complex was determined using an FFA detection kit. According to the kit instructions, FFAs can react with copper ions to form copper salts of fatty acids, which dissolve in chloroform. The content of these salts is proportional to the amount of FFAs present. The concentration of copper ions can be measured using a spectrophotometer colorimetric method, enabling the calculation of FFA content. Based on formula (1), the molar ratios of AA-LF and EPA-LF in the compound were found to be 26.5 and 25.4, respectively. Results suggested that postdialysis residual AA and EPA might result from their conjugation with LF, engendering sizable molecular assemblies resistant to dialytic elimination.
Ultraviolet spectrum
The interaction between LF and small molecules can be evaluated by analysing the UV absorption spectra (Wang et al., 2021). LF exhibits a distinct absorption peak at approximately 280 nm due to the presence of tryptophan (Trp), tyrosine (Tyr), and phenylalanine residues (Yan et al., 2021). As illustrated in Figure 2, the UV–VIS spectrum was measured for the sample within the wavelength range of 250–400 nm. In Figure 2A, it was observed that LF exhibited an absorption peak at 280 nm, with slightly reduced absorbance under heating treatment compared to unheated conditions, indicating minimal impact on LF stability from 45 °C heating. Upon addition of fatty acids, a significant decrease in LF absorbance was observed without any discernible blue or red shift phenomenon. The results suggest that the two fatty acids had specific effects on amino acid residues within LF, potentially interacting with exposed Tyr and Trp residues on its protein surface. This interaction enhanced the polarity and reduced the hydrophobicity of the protein molecule. These findings indicate that there were alterations in the secondary structure of LF when it bound to fatty acids.
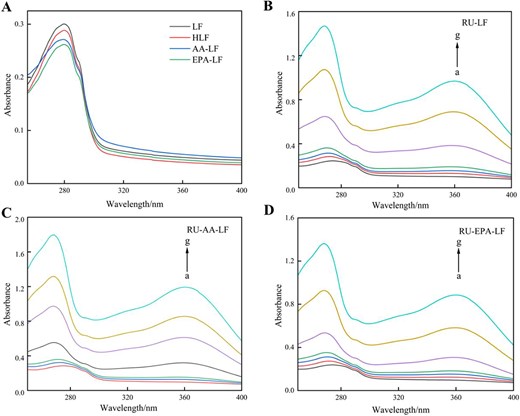
UV absorption spectra of lactoferrin, heat treatment, and its complexes with fatty acids (A) and the interaction of RU with LF (B), AA-LF (C), and EPA-LF (D). Note: Curves a–g represent to the rutin concentrations of 0, 0.409, 0.819, 1.228, 1.638, 4.095, and 8.190 × 10⁻⁵ mol/L that were added for analysis. AA = arachidonic acid; EPA = eicosapentaenoic acid; LF = lactoferrin; RU = rutin.
According to the ultraviolet absorption spectra of LF (Figure 2B), LF-AA (Figure 2C), and LF-EPA (Figure 2D), it was observed that the absorbance of binary and ternary systems increased in a concentration-dependent manner with the rise in RU concentration, resulting in a slight blue shift of the maximum absorption peak from 275 to 268 nm (Figure 2). This shift indicated covalent binding between RU and LF (Guo et al., 2023), leading to exposure of colour-rendering and hydrophobic groups (Tyr, Trp) on the protein surface as well as enhanced hydrophobicity (Liao et al., 2022). These findings suggest that hydrophobic interaction was the primary driving force behind the interaction between RU and LF. In addition, a weak absorption peak was observed at a wavelength of 375 nm, which could be attributed to the characteristic absorption peak of RU resulting from the cinnamoyl chromophore and corresponding to the π → π* (B ring) electronic transition (Calabro et al., 2005).
Fluorescence spectrum
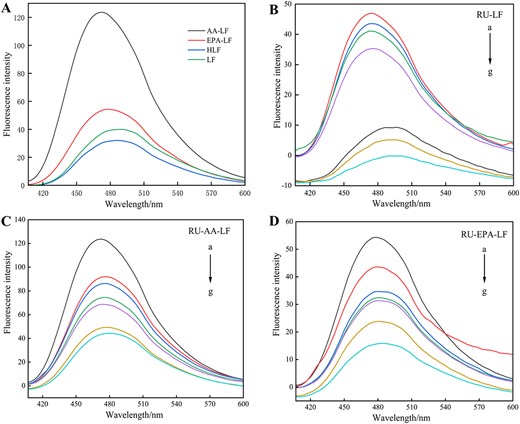
The emission spectrum of LF without ligand was measured at an excitation wavelength of 280 nm, as shown in Figure 3. It exhibited a peak emission wavelength at 333 nm, which primarily originated from the fluorescence emitted by Tyr and Trp residues (Liu et al., 2024). This characteristic was utilised for evaluating protein polarity and conformational changes (Aprodu et al., 2020), as well as discerning the tertiary structure of proteins. The shift in the position of the maximum emission intensity (λmax) corresponded to alterations in polarity surrounding chromophore molecules and the hydrophobic cavity within LF (Yang et al., 2018). A blue shift in λ occurred when the indole group of Trp residue was buried within the native protein structure, while a red shift took place during protein unfolding (Xiao et al., 2010).
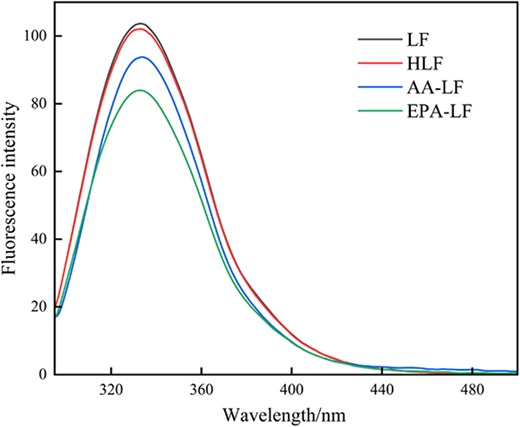
Fluorescence spectra of LF, heat treatment, and its complexes with fatty acids (298 K). LF = lactoferrin.
According to Figure 3, it was observed that heat treatment had a negligible effect on LF. However, the fluorescence intensity of LF decreased significantly when bound with unsaturated fatty acids, indicating quenching of intrinsic protein fluorescence caused by fatty acid binding. As shown in Figure 4A, the fluorescence intensity of the solution system was quenched in a concentration-dependent manner with increasing RU concentration. Additionally, there was a distinct blue shift phenomenon (4 nm), indicating a strong interaction between RU and LF. These findings suggest that the presence of RU resulted in a decrease in fluorescence intensity and caused a shift towards shorter wavelengths, indicating an interaction between RU and LF. The observed blue shift suggests an increase in hydrophobicity surrounding Trp residues (Sengupta et al., 2023), leading to their relocation towards nonpolar environments and subsequent embedding within the protein structure, resulting in fluorescence quenching. The interaction of RU with AA-LF and EPA-LF complexes, as shown in Figure 4D and G, aligned consistently with the aforementioned results. As the concentration of RU increased, a decrease in fluorescence intensity was observed along with a blue shift of approximately 2–4 nm. However, it was also noted that in the presence of fatty acids, the rate at which RU quenched LF diminished gradually. Furthermore, the impact of AA exceeded that of EPA.
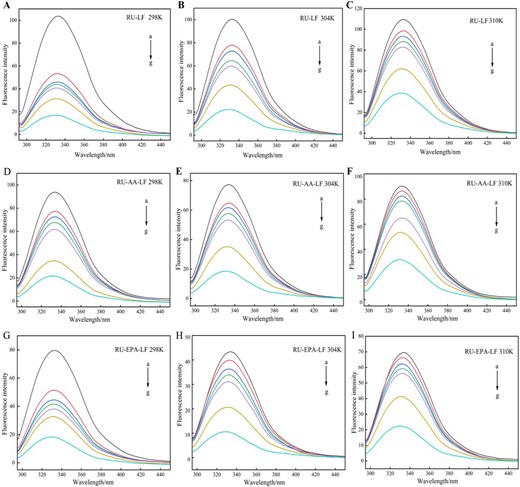
Fluorescence spectra of RU-LF at 298 K (A), 304 K (B), 310 K (C); fluorescence spectra of RU-AA-LF at 298 K (D), 304 K (E), and 310 K (F); fluorescence spectra of RU-EPA-LF at 298 K (G), 304 K (H), and 310 K (I). Note: Curves a–g corresponded to the rutin concentrations of 0, 0.409, 0.819, 1.228, 1.638, 4.095, and 8.190 × 10⁻⁵ mol/L that were added for analysis. AA = arachidonic acid; EPA = eicosapentaenoic acid; LF = lactoferrin; RU = rutin.
Previous studies have suggested that fluorophores with greater accessibility exhibit higher sensitivity to quenching agents, resulting in a more pronounced decrease in fluorescence intensity. In contrast, less accessible fluorophores display lower sensitivity to quenchers and experience only minor decreases (Dos Santos Rodrigues et al., 2023). Therefore, the decelerated decline in quenching observed in this study can be attributed to the presence of carbon–carbon double bonds within unsaturated fatty acids. The presence of these double bonds led to an interaction with Trp residues on fluorophore molecules, resulting in a decrease in their accessibility and sensitivity towards quenchers. Furthermore, despite having the same carbon chain length, AA and EPA exhibited differences in unsaturation and double bond position, potentially contributing to inconsistent effects on the system.
The quenching of proteins induced by small molecules occurred through three mechanisms: static quenching (formation of a ground state complex), dynamic quenching (molecular collision), and combined static and dynamic quenching (Wang et al., 2016). In this study, fluorescence quenching spectroscopy experiments were conducted at three different temperatures (298, 304, and 310 K) as depicted in Figure 4. The fluorescence intensity of the system decreased with increasing RU concentration; however, with elevated temperature, the decrease in fluorescence intensity became less pronounced. This phenomenon could be attributed to temperature-induced conformational changes in proteins, resulting in an increased exposure of fluorophores to the solution. The quencher RU formed complexes with these exposed fluorophores, thereby hindering fluorescence occurrence before excitation/emission (Jiang et al., 2024).
Quenching type, binding constant, and binding site
The quenching constants (KSV) and quenching rates (Kq) of RU for LF, AA-LF, and EPA-LF samples at different temperatures were presented in Table 1. Figure 5 illustrated the Stern–Volmer plots and double logarithmic curves at all three temperatures, demonstrating excellent linear relationships. According to Table 1, it was observed that the quenching constants of RU decreased with increasing temperature for all three samples. The minimum quenching rate was 0.2223 × 10¹³ L·mol−1·s−1, which significantly exceeded the maximum dynamic quenching rate of 2 × 10¹⁰ L·mol−1·s−1, Harimana et al. (2024) indicating a static quenching process for RU in LF, AA-LF, and EPA-LF samples. In addition, lower KSV and Kq values were observed in protein-fatty acid complex systems compared to pure protein systems. The phenomenon of static quenching arose from the interaction between the ground state protein and a quencher, resulting in the formation of a nonfluorescent complex (Liu et al., 2023). It could be inferred that the presence of unsaturated fatty acids in the system likely first interacted with the protein’s functional groups, reducing the sensitivity of LF to the quencher RU, which consequently decreased its binding rate.
Quenching equations and quenching constants of rutin on lactoferrin and the interaction between lactoferrin and fatty acid complexes at 298, 304, and 310 K.
| Sample | T/K | Stern–Volmer equation | KSV/(105L·mol−1) | Kq/(1013 L·mol −1·s−1) | R2 |
|---|---|---|---|---|---|
| 298 | F0/F = 0.5314[Q] + 1.4647 | 0.5314 | 0.5314 | 0.9603 | |
| RU-LF | 304 | F0/F = 0.4261[Q] + 1.0397 | 0.4261 | 0.4261 | 0.9878 |
| 310 | F0/F = 0.2194[Q] + 0.9786 | 0.2914 | 0.2914 | 0.9925 | |
| 298 | F0/F = 0.4116[Q] + 0.9558 | 0.4116 | 0.4116 | 0.9964 | |
| RU-AA-LF | 304 | F0/F = 0.3793[Q] + 0.9125 | 0.3793 | 0.3793 | 0.9831 |
| 310 | F0/F = 0.2223[Q] + 0.9366 | 0.2223 | 0.2223 | 0.9813 | |
| 298 | F0/F = 0.4115[Q] + 1.3528 | 0.4115 | 0.4115 | 0.9708 | |
| RU-EPA-LF | 304 | F0/F = 0.3757[Q] + 0.8583 | 0.3757 | 0.3757 | 0.9798 |
| 310 | F0/F = 0.2554[Q] + 0.8842 | 0.2554 | 0.2554 | 0.9699 |
Note. AA = arachidonic acid; EPA = eicosapentaenoic acid; LF = lactoferrin; RU = rutin.
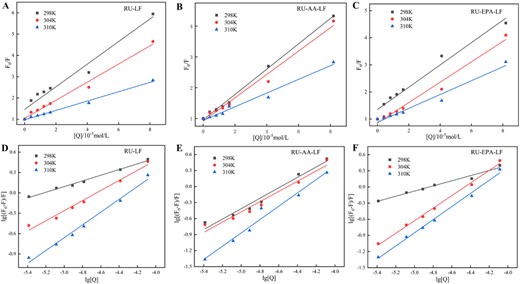
Stern–Volmer equation fitting diagram (A–C) and log–log curve diagram (D–F) of rutin to lactoferrin and lactoferrin and fatty acid complex at 298, 304, and 310 K temperatures.
Combining constant (Ka) values are commonly employed to assess the strength of protein–ligand interactions, with higher Ka values indicating more robust interactions between the two molecules and vice versa (Mokaberi et al., 2020). The Ka values and binding sites (n) for three samples, namely RU-LF, AA-LF, and EPA-LF, were determined at different temperatures using a double logarithmic equation (Equation 3), as shown in Table 2. With the increase in temperature, the binding constants for all three samples showed an upward trend along with an increase in observed binding sites. The increase in temperature indicated that it was beneficial for the combination of RU and LF. Furthermore, when compared to the binary system that tended towards one binding site, the ternary system exhibited higher binding constants and a greater number of binding sites. The inclusion of unsaturated fatty acids in the system enhanced the level of interaction between RU and LF.
Binding constants and binding sites of rutin to lactoferrin and the interaction between lactoferrin and fatty acid complexes at 298, 304, and 310 K.
| Sample | T/K | Log–log equation | Ka/(L·mol−1) | n | R2 |
|---|---|---|---|---|---|
| 298 | lg[(F0 − F)/F] = 0.4186lg[Q] + 2.1867 | 1.54 × 10² | 0.4186 | 0.9916 | |
| RU-LF | 304 | lg[(F0 − F)/F] = 0.7429lg[Q] + 3.4534 | 2.84 × 10³ | 0.7429 | 0.9828 |
| 310 | lg[(F0 − F)/F] = 0.9421lg[Q] + 4.0508 | 1.12 × 10⁴ | 0.9421 | 0.9868 | |
| 298 | lg[(F0 − F)/F] = 0.9759lg[Q] + 4.4664 | 2.93 × 10⁴ | 0.9759 | 0.9688 | |
| RU-AA-LF | 304 | lg[(F0 − F)/F] = 0.9576lg[Q] + 4.314 | 2.06 × 10⁴ | 0.9576 | 0.9601 |
| 310 | lg[(F0 − F)/F] = 1.247lg[Q] + 5.3677 | 2.33 × 10⁵ | 1.2470 | 0.9735 | |
| 298 | lg[(F0 − F)/F] = 0.4783lg[Q] + 2.3148 | 2.06 × 10² | 0.4783 | 0.9781 | |
| RU-EPA-LF | 304 | lg[(F0 − F)/F] = 1.1672lg[Q] + 5.2091 | 1.62 × 10⁵ | 1.1672 | 0.9952 |
| 310 | lg[(F0 − F)/F] = 1.2204lg[Q] + 5.2502 | 1.78 × 10⁵ | 1.2204 | 0.9939 |
Note. AA = arachidonic acid; EPA = eicosapentaenoic acid; LF = lactoferrin; RU = rutin.
Thermodynamic parameters and forces
The thermodynamic parameters of RU for LF, AA-LF, and EPA-LF samples at different temperatures were presented in Table 3. If ΔH > 0 and ΔS > 0, hydrophobic interaction has role in the interaction of RU with LF, ΔH < 0 and ΔS > 0 are indicative of electrostatic bond formation and ΔH < 0 and ΔS < 0 propose the occurring of the van der Waals force or hydrogen force (Fathi et al., 2018). From the table, it was observed that ΔH and ΔS exhibited positive values while ΔG showed negative values for both binary and ternary systems. The results indicated that hydrophobic interaction was the predominant type of interaction in these three systems. Hydrophobic interactions might contribute significantly to the stability of the complex (Cunha et al., 2024). The binding processes were found to be exothermic and driven by entropy, which suggesting spontaneous processes. The more negative the value of ΔG, the more favourable the reaction (Olsson et al., 2008). As the temperature increased, the ΔG became smaller, and the ΔG of the ternary systems was smaller than that of the binary system, interactions within the system were enhanced, as evidenced by an increase in binding constants. It could be postulated that the presence of unsaturated fatty acids facilitates the interaction between RU and LF, thereby enhancing their binding.
Thermodynamic parameters and force types of rutin on lactoferrin and the interaction between lactoferrin and fatty acid complexes at 298, 304, and 310 K.
| Sample | T/K | ΔG/(KJ·mol −1) | ΔH/(KJ·mol −1) | ΔS/(KJ·mol −1·K−1) | Type of force |
|---|---|---|---|---|---|
| RU-LF | 298 | −12.47 | 274.72 | 0.96 | Hydrophobic interaction |
| 304 | −20.10 | ||||
| 310 | −24.04 | ||||
| RU-AA-LF | 298 | −25.48 | 132.83 | 0.53 | Hydrophobic interaction |
| 304 | −25.11 | ||||
| 310 | −31.85 | ||||
| RU-EPA-LF | 298 | −13.21 | 4.75 | 1.50 | Hydrophobic interaction |
| 304 | −30.32 | ||||
| 310 | −31.16 |
Note. AA = arachidonic acid; EPA = eicosapentaenoic acid; LF = lactoferrin; RU = rutin.
Combined distance
The fluorescence emission spectra of LF, AA-LF, and EPA-LF showed significant overlap with the ultraviolet absorption spectra of RU, as shown in Figure 6. The binding distance was calculated using formula (6) and presented in Table 4. It was noteworthy that all three samples demonstrated a binding distance less than 7 nm with RU, indicating an occurrence of nonradiative energy transfer between LF and RU leading to quenched fluorescence of LF. However, the presence of unsaturated fatty acids increased the energy transfer efficiency E in the system and reduced the binding distance r between LF and RU, promoting energy transfer. This was specifically manifested as an increase in the binding constant when unsaturated fatty acids were present, which was consistent with previous conclusions.
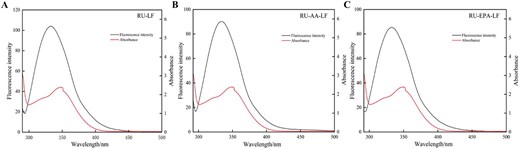
Overlap of RU UV absorption spectra with LF (A), AA-LF (B), and EPA-LF (C) fluorescence spectra. AA = arachidonic acid; EPA = eicosapentaenoic acid; LF = lactoferrin; RU = rutin.
Binding distances of RU to LF, AA-LF, and EPA-LF interactions.
| Sample | E | J/(10−14 L·cm−3·mol−1) | R0/nm | r/nm |
|---|---|---|---|---|
| RU-LF | 0.86 | 1.63 | 2.77 | 2.05 |
| RU-AA-LF | 0.87 | 1.58 | 2.75 | 2.00 |
| RU-EPA-LF | 0.90 | 1.58 | 2.75 | 1.91 |
| Sample | E | J/(10−14 L·cm−3·mol−1) | R0/nm | r/nm |
|---|---|---|---|---|
| RU-LF | 0.86 | 1.63 | 2.77 | 2.05 |
| RU-AA-LF | 0.87 | 1.58 | 2.75 | 2.00 |
| RU-EPA-LF | 0.90 | 1.58 | 2.75 | 1.91 |
Note. AA = arachidonic acid; EPA = eicosapentaenoic acid; LF = lactoferrin; RU = rutin.
Synchronous fluorescence
Synchronous fluorescence spectra exhibit excellent sensitivity and specificity in both qualitative and quantitative analysis (Genis et al., 2019), effectively mitigating spectral profile overlap and suppressing interference from light scattering (Włodarska et al., 2018). Alterations in the microenvironment surrounding specific amino acids can be discerned through changes in synchronous fluorescence peaks, with Tyr and Trp being reflected at wavelength spacings of 15 and 60 nm, respectively (Chen et al., 2021). Synchronous fluorescence spectra were measured for three samples, namely the RU-LF complex and the RU-LF-fatty acid complex, under two conditions: Δλ = 15 nm (Figure 7A–C) and Δλ = 60 nm (Figure 7D–F). The objective of this investigation was to explore alterations in internal conformation and microenvironment during their binding process. This study aimed to investigate the alterations in LF’s conformation and microenvironment during the binding process induced by RU. The results revealed that the fluorescence intensity and quenching degree under Δλ = 60 nm (Trp) conditions were found to be higher compared to those observed under Δλ = 15 nm (Tyr), indicating a closer proximity of the binding sites of RU, AA, and EPA with LF towards the Trp residue. In addition, an increase in RU concentration resulted in a decrease in LF’s fluorescence intensity. This suggests that RU effectively quenches LF’s intrinsic fluorescence, which is consistent with previous research findings. Furthermore, the addition of unsaturated fatty acids caused both Tyr and Trp residues to exhibit a reduction in fluorescence intensity. However, EPA caused a more significant decrease compared to AA. This observation indicates that the presence of unsaturated fatty acids affects LF’s internal conformation and may potentially correlate with their level of unsaturation.
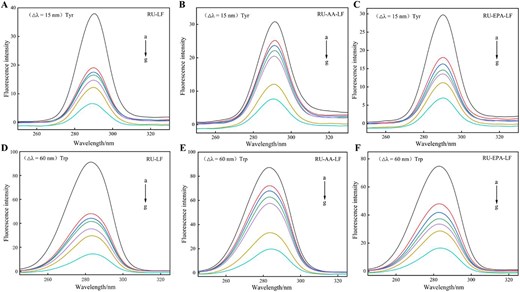
Simultaneous fluorescence spectra of LF, AA-LF, EPA-LF samples by RU at △λ = 15 nm (A, C, E) and △λ = 60 nm (B, D, F). Note: Curves a–g corresponded to the rutin concentrations of 0, 0.409, 0.819, 1.228, 1.638, 4.095, and 8.190 × 10⁻⁵ mol/L that were added for analysis. AA = arachidonic acid; EPA = eicosapentaenoic acid; LF = lactoferrin; RU = rutin.
Three-dimensional fluorescence
In order to gain further insights into the conformational and microenvironmental changes of LF in the presence or absence of RU, three-dimensional fluorescence spectroscopy experiments were conducted. Figure 8 presented the three-dimensional fluorescence spectra of LF (A), AA-LF (B), and EPA-LF (C). Peak a and Peak b were identified as the first-order Rayleigh scattering peaks (λ em = λ ex) and second-order Rayleigh scattering peaks (λ em = 2λ ex) (Shen et al., 2022), respectively. Peak 1, observed at an excitation wavelength of 280 nm, represented the fluorescence characteristics associated with Trp and Tyr residues in LF, while Peak 2 indicated the fluorescence characteristic of LF polypeptide chain skeleton (Yan et al., 2018). The results presented in Figure 8 indicated that the inclusion of unsaturated fatty acids AA and EPA resulted in a decrease in LF’s fluorescence intensity, suggesting the formation of complexes between unsaturated fatty acids and LF. This interaction subsequently influenced the microenvironment of the system and caused alterations in amino acid conformation. Furthermore, it was observed that AA supplementation induced protein Peak 2 production, suggesting an impact on the polypeptide chain structure resulting in modifications within its configuration (Ding et al., 2012). These findings were consistent with those obtained from fluorescence spectra analysis as well as synchronous fluorescence spectra measurements. It can be inferred that unsaturated fatty acids may interact with hydrophobic cavities present in LF, thereby influencing the spatial arrangements within polypeptide chains.
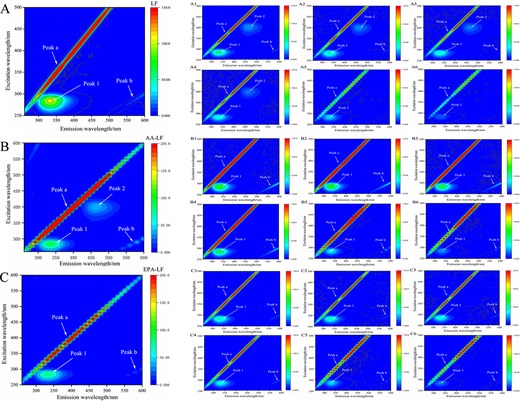
Three-dimensional fluorescence spectra of LF (A), AA-LF (B), and EPA-LF (C); 3D fluorescence spectra of different concentrations of RU interacting with LF (A1–A6), AA-LF (B1–B6), EPA-LF (C1–C6). Note: Curves 1–6 corresponded to the rutin concentrations of 0.409, 0.819, 1.228, 1.638, 4.095, and 8.190 × 10⁻⁵ mol/L that were added for analysis. AA = arachidonic acid; EPA = eicosapentaenoic acid; LF = lactoferrin; RU = rutin.
The three-dimensional fluorescence spectra of interactions between RU and LF at different concentrations were presented in Figure 8A1–A6. With an increasing concentration of RU, the fluorescence intensity of Peak 1 and Peak 2 decreased. Additionally, a blue shift of 4 nm was observed at Peak 1, while Peak 2 disappeared. These observations indicated the formation of a complex between RU and LF, which resulted in changes to the polypeptide chain structure of proteins and affected the polarity of amino acid residues. Figure 8B1–B6 and C1–C6 presented the three-dimensional fluorescence spectra obtained from interactions between RU and AA-LF as well as EPA-LF at varying concentrations, respectively. The results obtained are consistent with the aforementioned findings, indicating that an increase in RU concentration led to a decrease in fluorescence intensity within these systems in a concentration-dependent manner. Furthermore, it was observed that the addition of RU led to the disappearance of Peak 2, indicating structural modifications in LF’s polypeptide chain resulting from its interaction with RU.
Surface hydrophobicity determination
ANS, a fluorophore that exhibits fluorescence exclusively in nonpolar environments, primarily binds to the hydrophobic surface of proteins through its nonpolar aniline-naphthalene groups (Tang et al., 2021). The hydrophobicity of LF was enhanced after heat treatment and combination with unsaturated fatty acids, as evidenced by Figure 9A. This enhancement could be attributed to the unfolding of protein structure caused by heat treatment and the conformational changes induced by reaction with unsaturated fatty acids. These alterations exposed hydrophobic groups within protein molecules, thereby increasing their surface hydrophobicity (Wang et al., 2024). In addition, it was observed that AA had a more pronounced effect compared to EPA, possibly due to differences in the positions of unsaturated double bonds in these fatty acids. Furthermore, the addition of both fatty acids resulted in a blue shift ranging from 11 to 16 nm.
ANS fluorescence patterns of LF, HLF, AA-LF, and EPA-LF (A) and the effects of different concentrations of RU on the ANS fluorescence changes of LF (B), AA-LF (C), and EPA-LF (D). Note: Curves a–g corresponded to the rutin concentrations of 0, 0.409, 0.819, 1.228, 1.638, 4.095, and 8.190 × 10⁻⁵ mol/L that were added for analysis. AA = arachidonic acid; ANS = 8-Amino-1-naphthalenesulfonic acid; EPA = eicosapentaenoic acid; LF = lactoferrin; RU = rutin.
As shown in Figure 9B–D, the fluorescence signal of ANS decreased with the gradual increase in RU concentration, indicating a decrease in LF’s surface hydrophobicity and an increase in its surface polarity. This phenomenon was attributed to the binding of RU to LF’s hydrophobic region, which resulted in the distribution of RU on the protein surface and subsequently reduced the availability of hydrophobic surfaces for ANS binding. As a result, there was a decrease in fluorescence intensity (Fu et al., 2023). Another possibility was that RU binding induced conformational changes in LF, causing rearrangement of its folding pattern and exposing fewer hydrophobic groups on its surface, thereby reducing the occupied area by hydrophobic residues (Li et al., 2018). The greater the change in surface hydrophobicity, the stronger the binding between RU and LF, which was consistent with the previous research findings.
FTIR measurement
FT-IR spectroscopy was an important method for detecting changes in protein secondary structure (He et al., 2016). The amide I band, located in the range of 1,600–1,700 cm−1, was particularly sensitive to alterations in protein secondary structure and was commonly used for its analysis (Yu et al., 2022). According to previous studies, the wavenumber ranges of 1,615–1,637, 1,638–1,648, 1,649–1,660, 1,661–1,680, and 1,681–1,692 cm−1 were typically assigned to β-sheet, random coil, α-helix, β-turn, and antiparallel β-sheet, respectively (Zhao et al., 2020). The FT-IR data were processed using PeakFit 4.12, and the calculated structural content was presented in Table 5. As shown in the table, in the binary system, the binding of RU, AA, and EPA led to a slight increase in the α-helix content of LF. This increase was primarily attributed to a reduction in the random coil content, indicating that the binding of small molecules promoted the transition of the random coil region to a more ordered structure. The interaction between small molecules and the protein induced changes in the protein structure (Fevzioglu et al., 2020). In the ternary system, the content of β-turn structures in LF significantly increased, with the contribution coming from a decrease in the content of other secondary structures, and the increase in β-turn content was more pronounced in the ternary system with the addition of EPA compared to AA. Glycine, proline, asparagine, and aspartic acid were the most common residues involved in β-turn formation, primarily located on the protein surface, making them well-suited for participation in protein–ligand binding, molecular recognition, and protein–protein or small molecule interactions (Marcelino & Gierasch, 2008). It could be inferred that the small molecules bound to the amino acids on the protein surface, and interactions occurred among the three substances. The presence of unsaturated fatty acids facilitated the binding of RU, which was consistent with the results of the thermodynamic analysis.
Change of LF secondary structure content in binary and ternary systems after adding AA/EPA and RU.
| System | β-Sheet (%) | Random coil (%) | α-Helix (%) | β-Turn (%) | Antiparallel β-sheet (%) |
|---|---|---|---|---|---|
| LF | 24.3482 ± 0.0772a | 17.506 ± 0.0608d | 18.6359 ± 0.0066c | 28.0471 ± 0.137e | 11.4606 ± 0.0052a |
| AA-LF | 23.3316 ± 0.0040d | 18.1073 ± 0.0065b | 19.6814 ± 0.0054b | 28.3241 ± 0.0080c | 10.5555 ± 0.0159c |
| EPA-LF | 23.4781 ± 0.0448c | 18.2012 ± 0.0196a | 19.7648 ± 0.0034b | 28.2451 ± 0.0072cd | 10.3107 ± 0.0214d |
| RU-LF | 23.2391 ± 0.0247d | 17.8746 ± 0.0130c | 20.0627 ± 0.0039a | 28.1123 ± 0.0878de | 10.7114 ± 0.0103b |
| RU-AA-LF | 23.9658 ± 0.0711b | 15.2511 ± 0.0097e | 15.8879 ± 0.0705e | 34.957 ± 0.0037b | 9.9381 ± 0.0054e |
| RU-EPA-LF | 21.6913 ± 0.0394e | 14.8432 ± 0.0103f | 16.6556 ± 0.0456d | 36.1336 ± 0.0434a | 10.6762 ± 0.0393b |
Note. AA = arachidonic acid; EPA = eicosapentaenoic acid; LF = lactoferrin; RU = rutin. Means with different letters (a–f) differ significantly (P < 0.05).
Molecular docking
The minimum binding interaction energies of LF with AA, EPA, and RU were −42.08, −45.27, and −51.55 kcal/mol, respectively, as presented in Table 6. Under these experimental conditions, LF formed the most stable and probable complexes with these three small molecular substances. The active sites of AA, EPA, and RU binding with LF were located on the C lobe of the protein, as shown in Figure 10A1–A3.
Minimum interaction energy of LF with AA, EPA, and RU.
| Ligand | Receptor | -Minimum interaction energy (Kcal/mol) |
|---|---|---|
| AA | LF | 42.0854 |
| EPA | 45.2740 | |
| RU | 51.5520 |
| Ligand | Receptor | -Minimum interaction energy (Kcal/mol) |
|---|---|---|
| AA | LF | 42.0854 |
| EPA | 45.2740 | |
| RU | 51.5520 |
Note. AA = arachidonic acid; EPA = eicosapentaenoic acid; LF = lactoferrin; RU = rutin.
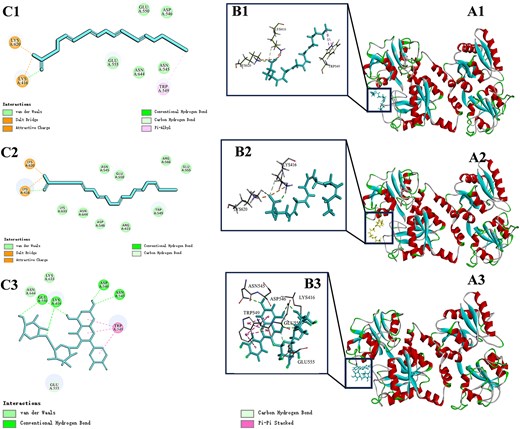
Diagram of the docking site between AA, EPA, RU, and LF molecule (A1–A3) and enlarged detail (B1–B3); schematic diagram of the interaction between AA, EPA, RU, and LF amino acid residues (C1–C3). AA = arachidonic acid; EPA = eicosapentaenoic acid; LF = lactoferrin; RU = rutin.
As depicted in Figure 10C1, AA exhibited interactions with LYS620, LYS416, ASN644, ASP546, TRP549, ASN545, GLU550, and GLU555 on LF. In comparison to EPA, the number of amino acid residues bound by AA was reduced. A hydrophobic interaction via Pi-Alkyl bonding was observed between AA and TRP549. The interaction between AA and LF was found to be comparatively weaker than that of EPA, which is consistent with the results obtained from UV and fluorescence spectroscopy. Furthermore, both LYS620 and LYS416 were involved in the formation of salt bridges and hydrogen bonds with the carboxyl group of fatty acids, indicating their significant role in the LF binding process while influencing the conformation of amino acid residues.
The interaction between EPA and LYS620, LYS416, LYS633, ASN644, ASP546, ARG415, TRP549, ASN545, GLU550, ARG566, and GLU555 on LF was mediated by van der Waals forces, hydrogen bonds, salt bridges, and electrostatic attractions as depicted in Figure 10C2. In the magnified view of Figure 10 B2, the amino acid residues LYS416 and LYS620 were connected to the carboxyl group of AA through salt bridges and hydrogen bonds. Salt bridge is a noncovalent interaction that combined electrostatic attraction and hydrogen bonding (Zhang et al., 2023). This interaction surpasses the strength of simple hydrogen bonds and contributes to a relatively stable structure crucial for maintaining protein stability (Spassov et al., 2022). The remaining amino acids were distributed around the carbon chain of EPA, indicating a strong and stable bond formation between EPA and LF.
As depicted in Figure 10C3, RU interacted with LYS416, LYS633, ASN644, ASP546, ARG415, TRP549, ASN545, and GLU555 on LF. Among them, GLU550, LYS416, ASP456, and ASN545 were connected to the RU molecule through hydrogen bonds. It is worth noting that TRP549 interacted with the 2-phenylchromone structure of the RU molecule through pi–pi stacked interaction force. Pi–pi stacked belongs to hydrophobic interaction forces. Amino acid molecules in proteins can specifically interact with small molecules through pi–pi stacked and form stable structures (Kumar et al., 2023). The 2-phenylchromone structure represents a fundamental scaffold of flavonoids; The structure of 2-phenylchromone belongs to the basic skeleton of flavonoid compounds. Based on this, it can be inferred that other flavonoid compounds can interact with TRP549 in LF through hydrophobic forces, which is consistent with the synchronous fluorescence results.
Conclusion
In summary, through investigating the interaction mechanism of RU, AA/EPA, and LF, this study overcame the non-water-soluble disadvantage of AA/EPA. Conjoining unsaturated fatty acids and natural bioactive compounds with LF markedly expands their application spectrum in functional foodstuffs and nutritional addenda. The interactions among the three substances in both binary and ternary systems were investigated employing multispectral analysis, thermodynamic analysis, ANS analysis, and molecular docking methods. The findings demonstrated that AA/EPA formed a stable complex with LF. The introduction of RU resulted in an enhancement of the hydrophobicity in the microenvironment surrounding the protein’s Trp residues. Furthermore, the presence of AA/EPA enhanced the energy transfer efficiency of the system and reduced the binding distance between RU and LF. The interaction process was accompanied by alterations in protein conformation, encompassing the exposure of hydrophobic groups and modifications in the spatial conformation of the peptide chain. The molecular docking results confirmed the spectroscopic experimental findings, demonstrating the presence of van der Waals forces, hydrogen bonds, and hydrophobic interactions between RU and LF. Unsaturated fatty acids exhibited interactions with LF involving van der Waals forces, hydrogen bonds, salt bridges, and electrostatic attractions. The presence of unsaturated fatty acids, in particular, could enhance the interaction between small molecules and LF. As an effective natural supplement, LF played a crucial role in studying the synergistic effects between bioactive components and food-derived therapeutic substances. This research significantly contributes to the development of all-natural functional foods, particularly through the self-assembly of AA and EPA with LF, which holds substantial potential in the field of health supplements.
Data availability
Data will be made available on request.
Author contributions
Chen Yuan (Data curation [equal], Writing—original draft [equal], Writing—review & editing [equal]), Anna Wang (Data curation [equal], Writing—review & editing [equal]), and Ligen Wu (Supervision [equal], Writing—review & editing [equal])
Funding
The authors acknowledge the financial support by Chinese National Natural Science Foundation (Grant No. 31201294), Project supported by and the Scientific Research Start-up Fund Project of High-level Talents of Henan University of Technology (2021BS057). Henan Province Key R&D Special Project, Key Processing Technology and Application Demonstration of Traditional Characteristic Wheat Flour Food (221111112000).
Conflicts of interest
No conflict of interest exists in the submission of this manuscript, and the manuscript is approved by all authors for publication. I would like to declare on behalf of my co-authors that the work described was original research that has not been previously published and was not contemplated for publication elsewhere, in whole or in part. All the authors listed have approved the manuscript that is enclosed.
Acknowledgements
None.
