


Abstract
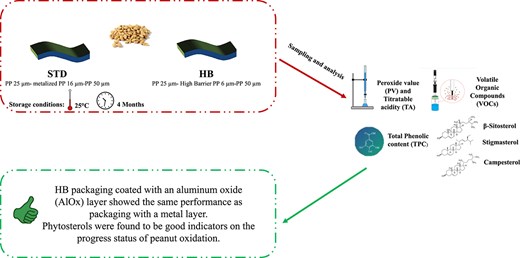
Peanuts are a fat-rich matrix that necessitates packaging designed to ensure the best preservation of the product. Over time, the chemical composition of peanuts can degrade, particularly affecting the lipids and volatile compounds, especially during storage. Nowadays, the multilayer packaging used involves the presence of a layer of aluminium in the packaging, which however has high costs and makes the laminate difficult to recycle. In this study, the performance of two packaging for 4 months (standard with metalized polypropylene (PP) and alternative with PP coated with AlOx) on the influence of the lipid and volatile components were evaluated. Specifically, the oxygen barrier property, the peroxide value, the titratable acidity, volatile organic compounds, the phytosterols, and polyphenols content during the storage of peanuts were tested. The result showed no statistically significant difference between peanuts packaged in the two films. Regarding VOCs, the most present were aldehydes and pyrazines with no important difference between the two tested packagings. So, considering the obtained results, the aluminium layer is not a necessary condition to protect the peanuts from oxidation, and the development of high-barrier alternatives can be considered to produce new films.
Introduction
Peanuts (Arachis hypogaea L.) belong to the legume family, and they are characterised by high protein, fibre, fat (mostly unsaturated fatty acids), vitamins, and mineral content (Hosseini Taheri et al., 2024). China leads global peanut production with approximately 15 million tons per year, followed by India, Nigeria, and the United States in second, third, and fourth place, respectively. (Muñoz-Arrieta et al., 2021). The composition of peanuts includes in order about 50% of fat, 24% of protein, 21.51% of carbohydrates, 8% of fibre, and 1.55% of water providing an energy value of about 2,448 kJ (585 kcal) (Settaluri et al., 2012). In terms of fatty acids, peanuts contain 53.77% monounsaturated fatty acids, 26.96% polyunsaturated fatty acids (PUFAs), and 19.27% saturated fatty acids (Bonku & Yu, 2020; Davis & Dean, 2016). Peanuts are used in food processing in the form of roasted peanuts or to produce foods such as peanut butter, peanut oil, peanut paste, sauces, flour, milk, beverages, snacks (both salty and sweet), and peanut cheese analogues (Arya et al., 2016; Bonku & Yu, 2020).
Because of their high unsaturated fatty acid content, peanuts are particularly susceptible to lipid autoxidation, which happens during storage and causes the formation of oxidation products. These products are correlated with changes in the flavour and nutritional characteristics of the food (Liu et al., 2019). Free radicals act as intermediates in the oxidation of lipids, initiating the formation of hydroperoxides. The breakdown of these hydroperoxides leads to the creation of secondary compounds such as aldehydes, ketones, hydrocarbons, and alcohols, which contribute to unpleasant flavours and rancidity (Samotyja & Malecka, 2015). In particular, hexanal, which is formed during oxidation of linoleic acid, has a “grassy” odour and is easily detected due to its low odour threshold (Carrizo et al., 2016). Various factors, including moisture, light, oxygen, and high temperatures, can accelerate oxidation. Therefore, selecting the appropriate packaging materials and controlling storage temperature are essential to maintain both the nutritional value and oxidative stability of peanuts. The most common packaging solutions include polymeric films and modified atmospheres (Martín et al., 2018). Modified atmosphere packaging (MAP) is a method of prolonging food preservation by replacing the air in the package with a specific gas mixture. Nitrogen (N2) is often used in MAP, as it helps reduce rancidity, lipid oxidation, fungal growth, aflatoxin production, and colour changes while also slowing the deterioration of peanut quality during storage (Wu et al., 2022). Studies have shown that MAP can effectively inhibit lipid oxidation and delay quality loss in dried peanuts (Groot et al., 2022; Opio & Photchanachai, 2018).
To reduce permeability in flexible packaging, high-barrier (HB) materials such as ethylene-vinyl alcohol and aluminium oxide (AlOx) coatings are increasingly used instead of traditional metal-based packaging materials (Dunno, 2017). Recent innovations have enabled the deposition of a transparent aluminium oxide (AlOx) layer through the injection of oxygen into aluminium vapour. This process replaces the traditional roll-to-roll aluminium metallization method (Struller et al., 2014).
Wang et al. (2017) evaluated the 2 months shelf life of six types of roasted high-oleic and normal-oleic peanuts and reported an increase in aldehydes over storage time linked to a decrease in pyrazines.
So, the study aimed to compare the chemical properties of peanuts packaged in two different films (metalized polypropylene [PP] and HB PP) during storage at 25 °C for 4 months. At specific times storage, oxygen in the headspace, peroxide value (PV), titratable acidity (TA), phytosterol content, total polyphenol content (TPC), and volatile organic compounds (VOCs) were evaluated.
Materials and methods
Chemicals
All solvents and reagents used for the experiments were purchased from Sigma–Aldrich Co. (Milano, Italy).
Packaging composition
Two types of packaging supplied were tested by Flessofab srl (Montemiletto, AV). The standard (STD) packaging was composed of PP with a thickness of 25 μm, a layer of metalized PP with a thickness of 16 μm, and a layer of PP with a thickness of 50 μm. The alternative packaging (HB) was composed of PP with a thickness of 25 μm, a layer of high barrier PP with a thickness of 6 μm, and a layer of PP with a thickness of 50 μm. The oxygen transmission rate at 23 °C and at 0% of relative humidity was < 0.1 cm3 m−2 day−1 and <0.5 cm3 m−2 day−1 for STD and HB, respectively. The light transmission (%) for HB and STD packaging were >50 and <1.5, respectively. The elastic modulus was 1,500 and 2,500 MPa for HB and STD packaging, respectively.
Experimental plan
The peanuts supplied by a local company were packaged in two sachets (STD and HB) in a protective atmosphere (100% N2). The sachets had dimensions of 130 mm × 170 mm, and they were closed through hot bar thermal sealing. Each sachet contained 250 g of peanuts. The peanuts were stored at 25 °C and at 60% of relative humidity in a climatic chamber for 4 months, and the sampling was carried out every month to determine the moisture content, lipid content, PV, and TA every month while every 2 months for VOCs, phytosterols content, and TPC. Three packages of peanuts for each packaging were taken for each time of sampling. In Figure 1, a schematic representation of the experimental plan is shown.
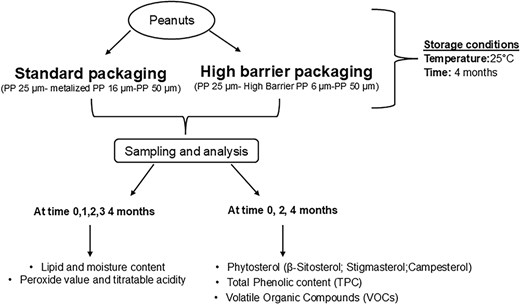
Schematic representation of experimental plan.
Moisture content
The moisture content was determined following the official method (AOAC, 1990). Briefly, 3 g of ground roasted peanuts was dried in an oven at 105 °C for 24 hr until constant weight. The results are expressed as a percentage weight/weight (% wt/wt).
Evaluation of oxygen percentage during storage
The oxygen percentage (%) in the packaging headspace was measured using a Witt Oxybaby 4.0 analyser during storage tests, prior to opening the packaging.
Lipid content
Lipid content was determined using the method proposed by Suri et al. (2019). Then, 10 g sample was added with 100 ml of hexane and sonicated for 30 min. The mixture was then centrifuged at 6,500 rpm for 5 min. The organic phase was separated, filtered, and dried at 40 °C using a rotavapor (Heidolph Instrument, Schwabach, Germany). The sample was stored at −18 °C until analysis. The lipid content was reported as grams of oil extracted per 100 g of peanuts.
Peroxide number and TA
The PV was determined using the official method (AOACS 965.33). Briefly, 1 g of fat was added to 10 ml of a solution of acetic acid and chloroform (3:2). After agitation, 0.25 ml of saturated KI solution was added, and the mixture was kept in the dark at room temperature for 5 min. Subsequently, the solution was titrated with 0.001 N Na2S2O3 after adding 1 ml of starch as indicator. The PV was calculated as milliequivalents of O2 per kg of oil. TA was determined according to Romano et al. (2021). In detail, 5 g of fat was dissolved in 80 ml of an ethanol-diethyl ether (1:2) solution and titrated with 0.01 N NaOH using phenolphthalein as an indicator. The results were expressed as grams of oleic acid per 100 g of oil.
Phytosterol determination
The sterol content (β-sitosterol, stigmasterol, and campesterol) was determined using a method adapted from Nota et al. (1995). Briefly, a 10% fat solution in chloroform was prepared and vortexed for approximately 1 min. Then, 400 μl of 2 N KOH in CH3OH was added, and the solution was vortexed again for 1 min. Next, 800 μl of 1 N HCl was added, and the mixture was vortexed for 1 min and centrifuged at 4,000 rpm for 5 min. A 1 μl of the supernatant was injected into an Agilent Technologies 6,890 N gas chromatograph equipped with a programmed temperature vaporizer (PTV), a flame ionisation detector (FID), and a capillary column (30 m × 0.25 mm ID; film thickness 0.10 μm) RTX-65 TG (Restek Corp., Bellefonte, PA, USA).
The operating conditions were as follows: PTV was set to 80 °C for 0.1 min, increasing at 500 °C/min to 380 °C for 7 min; the oven temperature was held at 80 °C for 1 min, with an increase of 50 °C/min up to 280 °C for 15 min. Helium was used with a flow rate of 2 ml/min. Calibration curves with specific standards in the linear range of 10–500 ppm were used to quantify the sterol content. The content of sterol was expressed such as mg/100 g.
Total polyphenols content determination
Polyphenol extraction and quantification were carried out following the method outlined by Izzo et al. (2020), with some modifications. Briefly, 2 g of the sample was mixed with 20 ml of a CH3OH:H2O (80:20 vol/vol) solution. The mixture was vortexed for 1 min and then sonicated in the dark at room temperature for 30 min. Afterward, the solution was centrifuged at 6,500 rpm for 10 min, and the supernatant was filtered through 0.22 μm PES (Polyethersulphone) filters to obtain the final extract.
To measure the TPC, 125 μl of the diluted extract was combined with 500 μl of deionised water and 125 μl of Folin–Ciocalteu reagent. The mixture was allowed to react for 6 min at room temperature. Next, 1.25 ml of a 7.5% Na2CO3 solution and 1 ml of deionised H2O were added, and the samples were incubated in the dark for 90 min. Finally, the absorbance of the samples was measured using a spectrophotometer (Shimadzu, Milan, Italy) at the wavelength of 760 nm. TPC was expressed as mg of gallic acid equivalent (GAE) per gram of fresh weight (f.w.), using a gallic acid calibration curve in the range of 10–500 mg/l (R2 = 0.99).
Volatile organic compounds
The VOCs analysis was conducted using solid-phase microextraction, based on the method described by Basile et al. (2024). In brief, 3 g of ground peanuts (particle size ≤ 2 mm) were placed into a 20-ml vial and kept at 60 °C for 10 min. A divinylbenzene/carboxen/polydimethylsiloxane (DVB/CAR/PDMS) fibre was then introduced into the vial and exposed to the sample for 15 min at 60 °C. Afterward, the fibre was transferred to a gas chromatograph connected to a mass spectrometer (Agilent Technologies, Santa Clara, CA, USA) with a 5% diphenyl/95% dimethylpolysiloxane capillary column (30 mm × 0.25 mm ID × 0.25 μm) (Agilent). The thermal desorption was carried out at 240 °C for 7 min, with helium as the carrier gas at a flow rate of 1 ml/min. The oven temperature programme started at 60 °C for 1 min, subsequently an increase of 10 °C/min to reach 300 °C. The ionisation energy was set to 70 eV, and the mass-to-charge ratios were scanned from 40 to 450 amu in full-scan mode. The injection temperature was 250 °C, and the ion source was maintained at 230 °C.
For volatile compound identification, the NIST MS Search 2.0 database was utilised. Data regarding peak areas were processed with Chemstation software (Agilent Technologies, Palo Alto, CA, USA), and the results were expressed as relative percentages (%) of the identified VOCs.
Statistical analysis
All analytical measurements were carried out in triplicate, and the reported results are the mean of the different measurements ± standard deviation. The data were analysed using a one-way analysis of variance (ANOVA) followed by Tukey’s multiple comparison test (p ≤ .05). Additionally, a correlation analysis was performed using Pearson’s correlation method, according to the data. XLSTAT software (Addinsoft, New York, NY, USA) was used for statistical analysis.
Results
Moisture content and oxygen in the headspace
In Table 1, the moisture content of peanut samples during the storage period at room temperature was reported. All samples had a moisture content ranging from 3.04% to 3.21%, and no statistically significant differences between the samples and during the storage were found. These results are in agreement with Bagheri et al. (2019) and McDaniel et al. (2012), who evaluated the moisture content of peanuts after roasting treatment. In Figure 2, the oxygen in the headspace at time 0, 2, and 4 months was shown.
Moisture content (%) of peanuts packaged in standard and high barrier film during the storage period at room temperature.
| Moisture content (%) | ||
|---|---|---|
| Time (months) | STD | HB |
| 0 | 3.13 ± 0.05 | 3.07 ± 0.08 |
| 1 | 3.16 ± 0.04 | 3.04 ± 0.06 |
| 2 | 3.10 ± 0.05 | 3.09 ± 0.05 |
| 3 | 3.08 ± 0.07 | 3.13 ± 0.04 |
| 4 | 3.16 ± 0.02 | 3.21 ± 0.10 |
| Moisture content (%) | ||
|---|---|---|
| Time (months) | STD | HB |
| 0 | 3.13 ± 0.05 | 3.07 ± 0.08 |
| 1 | 3.16 ± 0.04 | 3.04 ± 0.06 |
| 2 | 3.10 ± 0.05 | 3.09 ± 0.05 |
| 3 | 3.08 ± 0.07 | 3.13 ± 0.04 |
| 4 | 3.16 ± 0.02 | 3.21 ± 0.10 |
Note. HB = high barrier; STD = standard.
No statistically significant differences were found (p > .05).
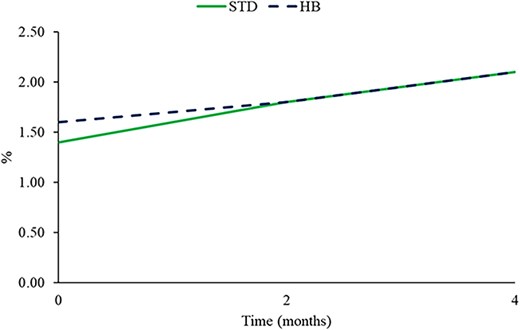
Percentage of oxygen in the headspace during the storage of peanuts packaged in standard and high barrier film. No significant difference between packaging was found (p > .05).
The two packages showed the same performance on oxygen permeability, leading to an increase of 0.7% for STD packaging and 0.5% for HB packaging but showing no statistically significant differences during the storage. The slight increase is related to storage time since the gas content permeating is proportional to storage time.
Lipid yield
In Table 2, the lipid yield of peanuts samples was reported.
Fat yield (%) of peanuts packaged in standard and high barrier film during the storage period at room temperature.
| Fat yield (%) | ||
|---|---|---|
| Time (months) | STD | HB |
| 0 | 47.93 ± 3.25 | 47.10 ± 1.48 |
| 1 | 47.36 ± 1.90 | 48.94 ± 1.00 |
| 2 | 47.70 ± 0.52 | 49.06 ± 0.65 |
| 3 | 48.84 ± 0.99 | 49.56 ± 0.31 |
| 4 | 49.69 ± 0.27 | 48.87 ± 0.16 |
| Fat yield (%) | ||
|---|---|---|
| Time (months) | STD | HB |
| 0 | 47.93 ± 3.25 | 47.10 ± 1.48 |
| 1 | 47.36 ± 1.90 | 48.94 ± 1.00 |
| 2 | 47.70 ± 0.52 | 49.06 ± 0.65 |
| 3 | 48.84 ± 0.99 | 49.56 ± 0.31 |
| 4 | 49.69 ± 0.27 | 48.87 ± 0.16 |
Note. HB = high barrier; STD = standard.
No statistically significant differences were found (p > .05).
The fat content ranged between 47.36% and 49.69% in peanuts packaged in STD and 47.10%–49.56% for peanuts stored in HB packaging, and these results are according to Liu et al. (2019) that analysed different cultivars at different temperatures and times of storage and to Arya et al. (2016).
Peroxide number and TA
The PV and TA of samples during the shelf-life in Table 3 were reported.
Peroxide value (meq O2/kg of fat) and titratable acidity (% oleic acid) of peanuts packaged in standard and high barrier film during the storage period at room temperature.
| PV (meq O2/kg fat) | TA (% oleic acid) | |||
|---|---|---|---|---|
| Time (mo) | STD | HB | STD | HB |
| 0 | 4.59 ± 0.08eA | 4.32 ± 0.19eA | 0.55 ± 0.03bA | 0.60 ± 0.02aA |
| 1 | 8.93 ± 0.05dA | 8.98 ± 0.01dA | 0.64 ± 0.01aA | 0.61 ± 0.02aA |
| 2 | 10.22 ± 0.15cA | 10.05 ± 0.39cA | 0.62 ± 0.02aA | 0.60 ± 0.01aA |
| 3 | 12.17 ± 0.01bA | 12.33 ± 0.12bA | 0.62 ± 0.01aA | 0.62 ± 0.02aA |
| 4 | 15.66 ± 0.14aA | 15.46 ± 0.60aA | 0.63 ± 0.01aA | 0.61 ± 0.02aA |
Note. HB = high barrier; PV = peroxide value; STD = standard; TA = titratable acidity.
Different lowercase letters indicate significant difference (p < .05) between two packaging at the same time, while different uppercase letters indicate significant difference (p < .05) during the storage of each packaging.
The PV increased during the storage in both packaging. In the sample packaged in STD packaging, the PV increased from 4.59 meq O2/kg of fat at time 0 to 15.66 meq O2/kg at time 4, while in peanuts packaged in TSP ranged from 4.32 meq O2/kg at time 0 to 15.46 meq O2/kg at time 4. The results at the end of storage were similar to Kazemian-Bazkiaee et al. (2020) who reported an increase in PV during the storage of peanuts at room temperature for 4 months. No difference among studied packaging was found.
PV is an indicator of primary lipid oxidation, and this parameter increases when the lipid deterioration advances during the storage of food. Peanut products are susceptible to lipid oxidation that occurs during the storage of peanut products contributing to the development of undesirable flavours. As reported by Wang et al. (2017), a PV of 10 meq O2/kg was sensory notable, but a value of 20 meq O2/kg was unacceptable. Furthermore, it was found that using 20 meq O2/kg as the unacceptable endpoint, the shelf-life was 4–6 weeks for normal-oleic roasted peanuts. In the case of TA, there was an increase in this parameter for the peanut samples packed in the two packages. In particular, the increase was approximately 15% and 2% for peanuts packaged in STD and HB, respectively. Anyway, no statistically significant differences between samples were found from the first month, and this may be due to the lack of moisture differences between samples. However, the small amount within the samples led to a slight increase in TA. The lack of significant differences for TA among the samples in this study could be due to the absence of significant differences in their moisture contents. As reported by López et al. (2022), TA is given by the release of fatty acids from the triglyceride during the hydrolytic rancidity of the triglycerides during storage, and in addition to the presence of an active lipase, this type of reaction relies on the presence of water. A positive correlation between PV and time (p < .0001), TA and time (p < .04) was found.
Phytosterol content
In Figure 3, the phytosterol content in peanuts was reported. The total phytosterol content at the end of storage is found to be 39.81 mg/100 g of fat and 44.23 mg/100 g of fat for peanuts packaged in STD and in HB, respectively. Thus, overall, at the end of the study, the samples stored in the two different packaging showed little difference in total phytosterol content.
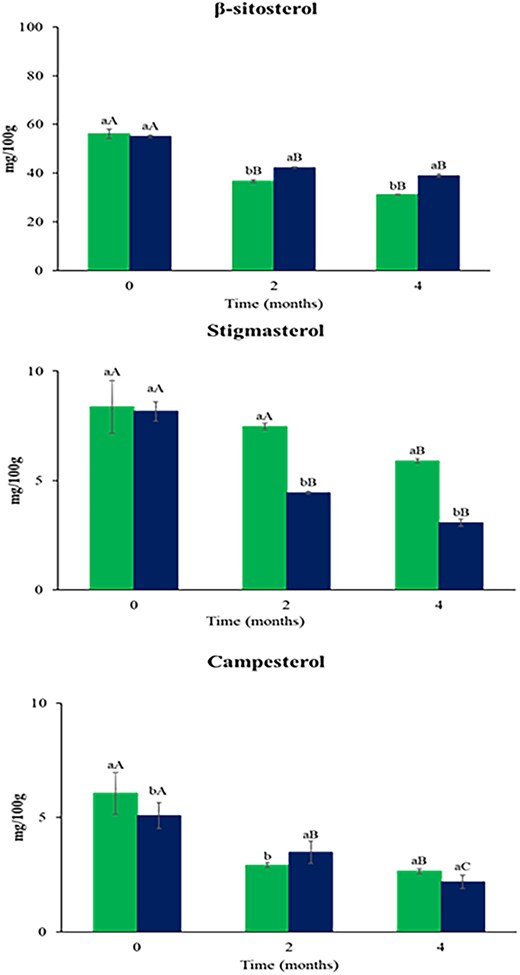
Phytosterols content (mg/100 g of fat) in peanuts packaged in standard (left bar) and high barrier (right bar) film during the storage period at room temperature. Different lowercase letters indicate significant difference (p < .05) between two packaging at the same time, while different uppercase letters indicate significant difference (p < .05) during the storage of each packaging.
The major phytosterol found in peanuts is β-sitosterol, followed by campesterol and stigmasterol (Çiftçi & Suna, 2022; Maguire et al., 2004). At the end of shelf-life, there was a reduction of 44% and 29% for β-sitosterol, 30% and 54% for stigmasterol, and 56% and 60% for campesterol, in peanuts packaged in STD and HB, respectively. So, the campesterol was more susceptible to oxidation as reported by Botelho et al. (2014) who hypothesised that hydroperoxides and free radicals formed during storage may affect the oxidation of phytosterols.
Phytosterols, because of their double bonds, undergo oxidation during food processing and storage. Roszkowska et al. (2015) evaluated the oxidative stability during the shelf life of rapeseed oil samples, and the results show that the greatest decay was to phytosterols, followed by tocopherols, carotenoids, polyphenols, and chlorophylls.
Total phenolic content
In Table 4, the TPC for the samples during the storage was reported. No statistically significant differences were found for TPC during the storage period. In fact no correlation between TPC and time was found (p > .05). Peanuts, being a very fatty matrix with low moisture content, are not particularly affected by the oxidation of polyphenols but mainly by the oxidation of the lipid component, and in this study, the polyphenols do not have a noticeable influence on the oxidation status of peanuts, as shown in Table 4. Talcott et al. (2005) evaluated the antioxidant activity and polyphenolic content of three different peanut cultivars over 4 months. They found small variations in overall polyphenolic concentrations indicating that these compounds have no appreciable impact on preventing lipid oxidation and are generally unrelated to antioxidant capacity over time. The TPC of roasted peanuts is highly variable and depends on some factors such as variety, cultivar, and roasting parameters. In general, TPC ranges from approximately 2–200 mg GAE/100 g fresh weight, as reported by several studies in the literature (Adhikari et al., 2018; Limmongkon et al., 2017; Salve et al., 2021; Sebei et al., 2013). The roasting can increase the polyphenolic content of peanuts because, through the Maillard reaction, there is the formation of antioxidative products (Nouruddeen et al., 2023).
Total phenolic content in peanuts packaged in standard and high barrier film during the storage period at room temperature.
| TPC (mg GAE/100 g) | ||
|---|---|---|
| Time (mo) | STD | HB |
| 0 | 84.46 ± 2.64 | 82.07 ± 7.52 |
| 2 | 82.26 ± 1.12 | 83.57 ± 1.09 |
| 4 | 82.93 ± 5.22 | 79.87 ± 2.04 |
| TPC (mg GAE/100 g) | ||
|---|---|---|
| Time (mo) | STD | HB |
| 0 | 84.46 ± 2.64 | 82.07 ± 7.52 |
| 2 | 82.26 ± 1.12 | 83.57 ± 1.09 |
| 4 | 82.93 ± 5.22 | 79.87 ± 2.04 |
Note. GAE = gallic acid equivalent; HB = high barrier; STD = standard.
No statistically significant differences were found (p > .05).
Volatile organic compounds
The VOCs of peanuts during the storage are reported in Table 5. The most common chemical classes found in peanuts are aldehydes, pyrazine, furans, and alcohol. Among the aldehydes, the hexanal was most present as reported also by Dean et al. (2023), and its concentration increased during storage in both types of packaging, as reported by Samotyja & Malecka (2015) and Grosso et al. (2008). This confirms that the deterioration phenomenon is more at the expense of the lipid component of peanuts, being the hexanal marker molecule of the advanced stages of lipid oxidation reactions, and it is a primary product of linoleic acid oxidation, resulting from the cleavage of 13-hydroperoxide (López et al., 2022; Riveros et al., 2022; Warner et al., 2001). Hexanal influences the odour of green, oily, and rancid (Dun et al., 2018; Xu et al., 2017).
Volatile organic compounds (%) of peanuts packaged in standard and high barrier film during the storage period at room temperature.
| Time 0 | 2 mo | 4 mo | ||||
|---|---|---|---|---|---|---|
| STD | HB | STD | HB | STD | HB | |
| ∑Aldehydes | 29.24 ± 1.64e | 32.86 ± 1.26d | 39.75 ± 1.43c | 49.31 ± 1.19b | 47.11 ± 2.68b | 55.61 ± 2.12a |
| 2-Methylbutanal | 6.40 ± 0.69f | 8.49 ± 0.37e | 10.61 ± 0.14d | 19.17 ± 0.08b | 13.02 ± 0.32c | 21.76 ± 0.82a |
| 3-Methylbutanal | 3.82 ± 0.29c | 4.38 ± 0.24bc | 4.97 ± 0.11bc | 6.72 ± 0.23a | 5.70 ± 0.70ab | 7.28 ± 0.64a |
| Hexanal | 15.42 ± 0.56d | 17.39 ± 0.23cd | 19.49 ± 0.81bc | 20.27 ± 0.36b | 23.24 ± 0.99a | 23.29 ± 0.50a |
| Heptanal | 0.87 ± 0.06abc | 0.41 ± 0.01d | 0.99 ± 0.03ab | 0.59 ± 0.12cd | 1.08 ± 0.08a | 0.70 ± 0.14bcd |
| 2-Heptenal | 0.17 ± 0.01abc | 0.12 ± 0.01c | 0.21 ± 0.01ab | 0.15 ± 0.01bc | 0.25 ± 0.04a | 0.18 ± 0.03abc |
| Benzaldehyde | 1.02 ± 0.01b | 1.17 ± 0.08ab | 1.07 ± 0.08ab | 1.49 ± 0.23a | 1.01 ± 0.09b | 1.41 ± 0.05ab |
| Benzene acetaldehyde | 0.42 ± 0.01ab | 0.32 ± 0.02b | 0.57 ± 0.01a | 0.36 ± 0.01ab | 0.49 ± 0.15ab | 0.37 ± 0.02ab |
| Nonanal | 1.14 ± 0.01c | 0.59 ± 0.10d | 1.84 ± 0.03b | 0.57 ± 0.06d | 2.33 ± 0.21a | 0.62 ± 0.02d |
| ∑Pyrazine | 31.99 ± 1.94a | 35.35 ± 0.94a | 23.91 ± 0.58c | 27.63 ± 1.44b | 19.85 ± 1.59d | 22.89 ± 0.58cd |
| Methyl–pyrazine | 2.22 ± 0.15c | 5.45 ± 0.16a | 2.02 ± 0.18c | 3.16 ± 0.07b | 1.29 ± 0.04d | 2.30 ± 0.00c |
| 2,5-Dimethyl-pyrazine | 18.20 ± 0.61ab | 19.92 ± 0.41a | 15.01 ± 0.13cd | 18.09 ± 0.82ab | 12.77 ± 1.02d | 17.20 ± 0.28bc |
| 2,6-Dimethyl-pyrazine | 0.56 ± 0.04a | 0.44 ± 0.03a | 0.09 ± 0.00c | 0.26 ± 0.09b | 0.05 ± 0.01c | 0.20 ± 0.01b |
| 2-Ethyl-6-methyl-pyrazine | 5.50 ± 0.06a | 5.47 ± 0.18a | 4.12 ± 0.05b | 4.15 ± 0.05b | 3.72 ± 0.03c | 1.58 ± 0.03d |
| 3-Ethyl-2,5-dimethyl-pyrazine | 5.52 ± 0.41a | 4.07 ± 0.08b | 2.68 ± 0.13c | 1.97 ± 0.12d | 2.02 ± 0.25d | 1.62 ± 0.01e |
| ∑Furans | 4.02 ± 0.26ab | 4.64 ± 0.68a | 2.66 ± 0.18c | 3.01 ± 0.34bc | 1.93 ± 0.17c | 2.21 ± 0.22c |
| 2-Furanmethanol | 2.12 ± 0.15a | 2.45 ± 0.62a | 1.54 ± 0.03ab | 1.69 ± 0.20ab | 0.76 ± 0.07b | 0.98 ± 0.08b |
| 2-Pentyl-furan | 1.90 ± 0.11a | 2.19 ± 0.06a | 1.12 ± 0.16b | 1.32 ± 0.14b | 1.17 ± 0.10b | 1.22 ± 0.14b |
| ∑Alcohols | 0.41 ± 0.01b | 0.48 ± 0.01ab | 0.44 ± 0.04b | 0.52 ± 0.04ab | 0.58 ± 0.07ab | 0.67 ± 0.10a |
| 1-Octen-3-ol | 0.20 ± 0.01a | 0.19 ± 0.01a | 0.21 ± 0.02a | 0.22 ± 0.04a | 0.27 ± 0.03a | 0.24 ± 0.00a |
| 3,5-Octadien-2-ol | 0.21 ± 0.00b | 0.29 ± 0.00ab | 0.23 ± 0.04b | 0.31 ± 0.01ab | 0.31 ± 0.04ab | 0.42 ± 0.08a |
| ∑Others | 34.36 ± 0.76a | 26.67 ± 0.47b | 33.24 ± 0.90a | 19.52 ± 1.38 | 30.53 ± 4.10ab | 18.63 ± 3.34d |
| 1-Methyl-1H-pyrrole | 21.65 ± 0.05a | 9.53 ± 0.19b | 21.17 ± 0.22a | 5.80 ± 0.92b | 18.17 ± 2.42a | 5.81 ± 1.13b |
| 2,4-Dimethyl-1-heptane | 2.90 ± 0.12c | 5.94 ± 0.04a | 2.50 ± 0.23c | 5.80 ± 0.03a | 3.84 ± 0.28b | 6.15 ± 0.24a |
| 4-Methyl-heptane | 5.24 ± 0.13ab | 5.29 ± 0.10ab | 5.60 ± 0.23a | 3.19 ± 0.11bc | 5.09 ± 0.95ab | 2.73 ± 0.95c |
| Heptyl ester 4-ethylbenzoic acid | 1.76 ± 0.18a | 1.94 ± 0.04a | 1.61 ± 0.07ab | 0.87 ± 0.02c | 1.13 ± 0.02bc | 0.62 ± 0.30c |
| 4,6-Dimethyl-undecane | 0.84 ± 0.08a | 0.92 ± 0.01a | 0.56 ± 0.01a | 0.90 ± 0.01a | 0.49 ± 0.11a | 0.43 ± 0.08a |
| 4-Methyl-octane | 0.49 ± 0.01b | 1.48 ± 0.03a | 0.31 ± 0.01b | 1.44 ± 0.17a | 0.23 ± 0.03c | 1.35 ± 0.16a |
| 3,5-Octadien-2-one | 0.66 ± 0.01a | 0.56 ± 0.00a | 0.68 ± 0.03a | 0.59 ± 0.02a | 0.76 ± 0.16a | 0.73 ± 0.05a |
| 4-Ethenyl-3-(1-methyl-1-propenyl)-cyclohexene | 0.37 ± 0.08b | 0.51 ± 0.00a | 0.35 ± 0.03b | 0.40 ± 0.02ab | 0.27 ± 0.02bc | 0.20 ± 0.01c |
| Tetrahydro2H-pyran-2-one | 0.29 ± 0.03a | 0.29 ± 0.01a | 0.33 ± 0.04a | 0.38 ± 0.02a | 0.43 ± 0.08a | 0.41 ± 0.01a |
| D-Limonene | 0.18 ± 0.01ab | 0.22 ± 0.01a | 0.13 ± 0.01bc | 0.18 ± 0.01ab | 0.12 ± 0.03c | 0.21 ± 0.02a |
Note. HB = high barrier; STD = standard.; ∑: Summation.
Different superscript letters in the same row indicate statistically significant differences (p < .05).
Nonanal is derived from 9- and 10-hydroperoxides during oleic acid autoxidation and during storage. There was a significant increase for STD packaging, whereas HB packaging showed no difference during storage. This compound has a green, oil, fruity, greasy and citrus-like aroma (Ma et al., 2024).
Pyrazines are among the major aromatic compounds in roasted peanuts (Cai et al., 2021), and their formation is due to the Maillard reaction that develops during roasting, influencing the roasted flavour (Cai et al., 2021) and the major molecules that impart roasted and nutty flavours are 2,5-dimethylpyrazine and methylpyrazine (Huang et al., 2024). In particular, 2,5-dimethylpyrazine was the most concentrated in all analysed samples with a higher content in HB than standard packaging. Furthermore, also 3-ethyl-2,5-dimethyl-pyrazine was one of the most crucial pyrazine aroma compounds (Sun et al., 2024), and its concentration was reduced during the storage in both types of packaging.
Anyway, during the shelf-life, there is a reduction in the % content of pyrazines, in accordance with Wang et al. (2017) and Williams et al. (2006). In particular, Williams et al. (2006) reported that free radicals and hydroperoxides from lipid oxidation caused the degradation of pyrazines in roasted peanuts.
López et al. (2022) found that the oxidation volatiles such as aldehydes were correlated negatively with roasting volatiles such as pyrazine. The degradation of pyrazines in roasted peanuts is likely attributed to the hydroperoxides and radicals produced during lipid oxidation (Bett & Boylston, 1992; Wang et al., 2017; Williams et al., 2006).
At the end of storage, HB packaging showed a greater ability to preserve these two molecules compared to STD packaging.
For furans, no statistical difference between the two samples during the shelf-life was found. Anyway, a reduction in their concentration during the storage was found as reported in previous studies (Jiao et al., 2016). These compounds can also be formed by the Maillard reaction that occurs during the roasting process (Schirack et al., 2006), and they can originate from lipid peroxidation, particularly PUFAs, as reported by Cha and Lee (2020) but also by carbohydrate degradation (Zhang et al., 2021). Furans, in particular 2-furan methanol and 2-pentylfuran, are associated with toasted, caramel, and hazelnut aromas giving the typical flavour to roasted products, and they are typical volatile compounds of peanuts (Fischer et al., 2012).
Regarding the alcohols, no statistically significant differences were found between the types of packaging, and no effect on storage time was found.
The aliphatic alcohols and alkanes were not considered important contributors to the flavour of food containing fat or lipids because their odour threshold values were high (Jiao et al., 2016).
Among the other volatile molecules identified, 1-methyl-1H-pyrrole is present in the highest concentration and shows no significant differences in storage between the two peanut samples. The volatile molecules most commonly found in peanuts include 2,5-dimethyl-pyrazine, which has a toasted and hazelnut aroma, and 1-methyl-1H-pyrrole, which has a sweet, fresh, and herbaceous smell, as reported by Hu et al. (2023).
Conclusion
The two films tested showed an excellent oxygen barrier performance, an important property to preserve food quality. Furthermore, the oxidative and hydrolytic rancidity trends showed no difference between the two films, and PV did not exceed the acceptability limit of 20 meq O2/kg fat at the end of storage.
The analysis of VOCs showed the increase of secondary oxidation compounds and in particular of aldehydes such as hexanal and nonanal, confirming that lipid oxidation is the primary mechanism in the formation of flavour and off-flavour compounds.
Considering the obtained results, the HB film was found to be a viable alternative for peanut packaging, allowing the elimination of the metal layer which is associated with high costs and problems because of low environmental performance. Furthermore, this packaging material forms a solid and effective barrier between the product and the external environment, which in turn preserves the oxidative preservability of the product.
Data availability
Data will be made available upon request.
Author contributions
Giulia Basile (Formal analysis, Data curation Writing—original drfat, Writing—review & editing), Lucia De Luca (Conceptualization, Methodology, Supervision, Writing—review & editing), Martina Calabrese (Formal analysis, Data Curation, Software), Mariarca Esposito (Formal analysis, Data Curation, Software), Giovanni Sorrentino (Formal analysis, Data Curation, Software), Annalisa Romano (Validation), Fabiana Pizzolongo (Validation), Gianfranco Lambiase (Formal analysis, Data Curation), Raffaele Romano (Funding acquisition, Conceptualization, Project administration, Methodology, Supervision).
Funding
This research was funded by MISE Ministero dello Sviluppo Economico within, the programme CDS000600 CORE PACK—NINFEA “Nuovi Imballaggi Flessibili Eco-sostenibili, per la riduzione dell’impatto Ambientale e per una maggiore sicurezza alimentare”.
Conflicts of interest
The authors report no conflict of interest.
Acknowledgements
None declared.
References
Author notes
G.B. and L.D.L. contributed equally.
