


Abstract
Dietary supplements are popular but poorly regulated, leading to concerns about their quality and accuracy of labelling. Developing fast, simple, and sustainable methods to analyse these supplements could help protect consumers by improving quality control and regulation. This study aimed to differentiate protein-based sulforaphane supplements of similar composition using mid-infrared (MIR) spectroscopy, investigate the impact of production age on spectral profiles, and assess the ability of MIR spectroscopy to monitor in vitro digestion of these supplements. Supplements were stored for 12 weeks and analysed using an attenuated total reflectance module attached to a MIR instrument every 2 weeks. In addition, INFOGEST static in vitro digestion was performed, and MIR measurements were taken before, during, and after each phase. It was observed that the principal component analysis (PCA) score plots and loadings were different between the type of protein used to prepare the supplement. The PCA analysis of the stored samples showed a similar trend between the samples. The partial least squares regression models were able to predict the type of samples and days of storage, however, with differences. Overall, MIR spectroscopy could be considered a potential tool to be further investigated for quick and qualitative analysis of dietary supplements.
Introduction
Dietary supplements are widely consumed by the general population due to their perceived benefits for well-being and health outcomes (Wierzejska, 2021). For instance, over 50% of US adults report using supplements. The global dietary supplements market is experiencing substantial growth, expanding from an estimated $152 billion in 2021 to a projected $300 billion by 2028 (Djaoudene et al., 2023). This growth is driven in part by the increasing international trade of supplement products. However, regulations and governmental oversight regarding raw material standards and processing methods vary significantly across countries (Dwyer et al., 2018). The absence of strict regulations in some regions and lack of international standardised labelling legislation/regulations raises concerns about potential inaccuracies and discrepancies in the production, documentation, and accurate labelling of these supplements (Dwyer et al., 2018; Starr, 2015).
To ensure consumers receive authentic dietary supplements that promote health, regulatory bodies must analyse their properties (Djaoudene et al., 2023). Various analytical techniques (e.g., chromatography and capillary electrophoresis) exist to assess supplement quality, each with its purpose (Durazzo et al., 2021). However, most of these techniques are destructive, time-consuming, labour-intensive, expensive, and require specialised training which is not consistently present in regulatory agencies/teams (Durazzo et al., 2021). Consequently, regulatory bodies and the industry actively seek new methods for efficient and cost-effective analysis of large sample sets. Infrared (IR) spectroscopy has emerged as a promising technique for addressing these needs (Junaedi et al., 2021; Perez-Guaita et al., 2021).
The basic principle of IR spectroscopy involves using light to measure molecular vibrations between the different bonds between atoms (carbon, nitrogen, oxygen, and hydrogen) present in a sample (Lin et al., 2007; Naumann, 2001). Particularly, the mid-infrared (MIR) region is characterised by the analysis of the fundamental vibrational modes of the molecules within the spectral range of 4,000–400 cm−1 where the narrow region between 1,800 and 900 cm−1 is known as the fingerprint region (Ellis & Goodacre, 2006; Lin et al., 2007; Movasaghi et al., 2008; Naumann 2001; Shaw & Mantsch, 1999). This region provides unique information about the fundamental vibrations of molecules or biomarkers present in biological samples, including amide groups of proteins, lipids, esters, fatty acids, and carbohydrates (Ellis & Goodacre, 2006; Lin et al., 2007; Movasaghi et al., 2008; Naumann, 2001; Shaw & Mantsch, 1999).
IR spectroscopy has been effective in analysing and differentiating between food and plant-based samples (Bureau et al., 2019) in terms of variety (Langston et al., 2023), provenance or origin (Chandra et al., 2017), nutrient content (Ali Redha et al., 2023), type and level of contamination in meat (Huang et al., 2020), and fish age (Benson et al., 2023). Thus, considering these properties, it could potentially be used as a helpful tool to differentiate between similar dietary supplements of a similar type which could help authorities to be able to differentiate dietary supplements that could be very closely similar but not the same. Moreover, IR spectroscopy could be capable of estimating the production age of the supplement. This could potentially assist regulatory authorities in countries with mandatory production date labelling, such as China, India, and most Middle Eastern nations, by verifying the accuracy and authenticity of these dates.
Recent advancements in IR spectroscopy (e.g., near and MIR) have revealed its potential for monitoring the in vitro digestion of various foods and natural products (Sahaka et al., 2023; Visnupriyan et al., 2023, 2024). This technique offers valuable insights for regulatory laboratories, as the extent of degradation observed during in vitro digestion can raise concerns about the authenticity of dietary supplements. Original supplements formulated with standard raw materials are expected to remain stable throughout digestion to ensure proper bio-accessibility and bioavailability (Puri et al., 2022). Additionally, in vitro digestion coupled with IR spectroscopy could unveil the presence of undeclared contaminants or potentially unsafe materials not approved for use. By monitoring changes in functional groups through IR spectroscopy during simulated digestion, regulatory bodies gain a deeper understanding of the supplement's behaviour within the body and can make more informed decisions.
This study aimed to investigate the use of MIR spectroscopy to differentiate and analyse sulforaphane supplements of similar composition: pea protein-based supplement vs. whey protein-based supplement and whey protein-based supplement vs. maltodextrin–whey protein blend supplement. Additionally, MIR spectroscopy was employed to investigate its potential for discriminating between samples of identical composition but varying production age. Finally, we examined the ability of MIR spectroscopy to analyse the digestion of these supplements throughout an in vitro gastrointestinal model by assessing changes in functional groups.
Materials and methods
Sulforaphane supplements
Three protein-based sulforaphane supplements prepared using food-grade ingredients and fresh broccoli extract in our laboratory were used in this study. The supplements were: BP—a pea protein-based, BW1—a whey protein-based, and BW2—a maltodextrin–whey protein blend-based supplement containing broccoli extract. BP and BW1 were selected as two supplements containing the same bioactive compound but with proteins from different sources (pea protein from a plant source vs. whey protein from an animal source). BW1 and BW2 were selected as two supplements containing the same bioactive compound and based on the same type of protein, yet BW2 containing maltodextrin as an additional blended component. All supplements were in powder form, and freshly produced before the beginning of the experiment.
Supplement storage
To analyse the supplement storage age, approximately 2 g of each sample was added into a sterile vial and stored in a dissector at 11.3% humidity (using 150 g of lithium chloride mixed with 85 ml Milli-Q® water) in the dark at 21 °C (lab temperature) for 12 weeks. Every 2 weeks, the water activity of the samples was measured using LabTouch-aw (Novasina, Switzerland), colour (L, a*, and b*) was measured using FRU WR10 (ShenZhen Wave Optoelectronics Technology, China), and the MIR spectrum of each was also obtained.
In vitro gastrointestinal digestion
Freshly prepared BP, BW1, and BW2 supplements were subjected to in vitro gastrointestinal digestion following INFOGEST protocol 2.0 (Brodkorb et al., 2019). Briefly, 2.5 g of powdered sample was mixed with 2 ml stimulated salivary fluid (containing 15.1 mM of KCl, 3.7 mM of KH2PO4, 13.6 mM of NaHCO3, 0.15 mM of MgCl2(H2O)6, 0.06 mM of (NH4)2CO3, and 1.1 mM of HCl), 15 μl of 0.3 M CaCl2(H2O)2, and 485 μl of Milli-Q® water in a 50-ml Falcon™ tube. The sample was mixed for 2 min in a 37 °C water bath. Then, 4 ml of stimulated gastric fluid (containing 6.9 mM of KCl, 0.9 mM of KH2PO4, 25 mM of NaHCO3, 47.2 mM of NaCl, 0.12 mM of MgCl2(H2O)6, 0.5 mM of (NH4)2CO3, and 15.6 mM of HCl) was added to the oral bolus and vortexed. The pH of the mixture was reduced to 3 by using 5 M HCl. A volume of 250 μl of pepsin solution (prepared from 343 U/mg of pepsin powder using water) was added to achieve a final concentration of 2000 U/ml. Milli-Q® water was added to bring the volume of the mixture to 10 ml. The sample was mixed for 2 hr in a 37 °C water bath. Upon completion of the gastric phase, the chyme was prepared for the intestinal phase. A volume of 4.25 ml of simulated intestinal fluid (containing 6.8 mM of KCl, 0.8 mM of KH2PO4, 85 mM of NaHCO3, 38.4 mM of NaCl, 0.33 mM of MgCl2(H2O)6, and 8.4 mM of HCl) was added to the gastric chyme. The pH of the mixture was adjusted to 7 by using 5 M NaOH. A volume of 2.5 ml of porcine pancreatin (200 U/ml amylase), 1.5 ml of 1.35 mmol of bile salts/g bovine bile (to achieve 10 mM bile concentration), and 20 μl of 0.3 M CaCl2(H2O)2. The pH was verified and adjusted if needed. Milli-Q® water was added to bring the volume of the mixture to 20 ml. The sample was mixed for 2 hr in a 37 °C water bath. An aliquot of 100 μl of the mixture was taken after the oral phase, at 30, 60, 90, and 120 min during the gastric phase, and 30, 60, 90, and 120 min during the intestinal phase, and immediately analysed using MIR spectroscopy.
MIR spectroscopy
The MIR spectrum of the samples from each treatment, storage time and at each sampling time during the in vitro phases (gastric and intestinal), was obtained using an ALPHA II infrared spectrometer (Bruker Optics, Ettilgen, Germany) (4,000 cm−1 to 400 cm−1 region) equipped with a diamond attenuated total reflection (ATR) crystal. The ATR crystal was fully covered with the sample powder or liquid (approximately 5 μl) where the spectrum of each sample was immediately recorded. Furthermore, each spectrum was computed using an average of 24 coadded interferograms at a resolution of 4 cm−1. The spectrum of air served as background prior to sample measurement, and the spectrum of water was measured and used as quality control. The instrument was operated using the OPUS software (version 8.5.29, Bruker Optics, Ettilgen, Germany). After each measurement, the surface of the ATR crystal was cleaned using a 70% wt/wt ethanol–water solution and dried with tissue paper between samples.
Chemometrics and data analysis
Before chemometric analysis, the MIR data were pre-processed using baseline correction and Savitzky–Golay second derivative (second polynomial order and 21 smoothing points) using The Unscrambler X software (Camo, Oslo, Norway) (Savitzky & Golay, 1964). Principal component analysis (PCA) and partial least squares (PLSs) regression were developed using full cross-validation (leave one out) (Bureau et al., 2019). The coefficient of determination in cross-validation (R2), the standard error in cross-validation (SECV), bias, and slope were used to evaluate the PLS models developed.
Results and discussion
Effect of supplement type and age on the MIR spectra
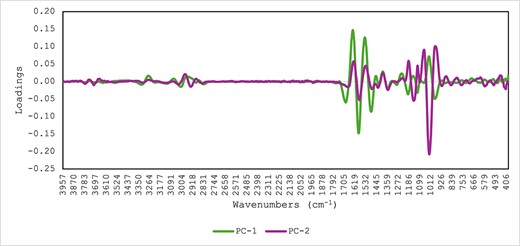
Figures 1 and 2 show the PCA score plot and loadings of the supplement samples collected from the storage experiment (panel A labels by type of sample, and panel B labels by weeks of storage). A separation was observed between samples along the first principal component (PC1) (85%) related to the type of protein and polysaccharide used during the product preparation. The main loadings in PC1 were observed around 1,500–1,680 cm−1 associated with amide groups of proteins and around 2,835–2,980 cm−1 with the C–H2 groups of lipids and fatty acids (Miller et al., 2013). Specifically, the peaks around 1,540 and 1,640 cm−1 are related to the amide II (N–H bending) and amide I (C=O stretching), respectively (Miller et al., 2013). The double peaks in the lipid region, 2,849 and 2,916 cm−1, were associated with CH2 symmetrical and asymmetrical stretching, where the smaller peak around 2,952 cm−1 corresponds to the C=C bending vibration associated with the different fatty acids present in broccoli (Abdullah et al., 2014; Campas-Baypoli et al., 2009). The PC2 explains the separation among samples according to the week of storage (weeks 0–12) from production (i.e., product age). The main loadings derived from the PC2 were observed in the same lipid region as described above (between 2,849 and 2,916 cm−1) and around 1,707 and 1,769 cm−1 associated with compounds having esters groups (Marcott et al., 2014; Pazos et al., 2014).
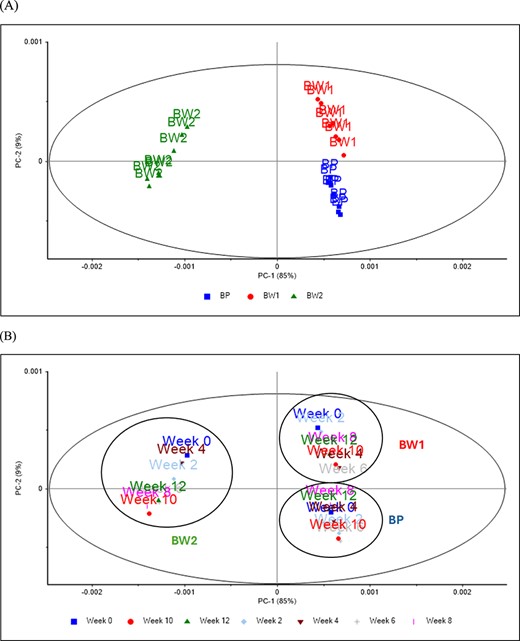
Principal component score plot of the different supplements stored at different times and analysed using mid infrared spectroscopy. (A) Type of supplement and (B) period of storage.

Principal component loadings derived from the principal component analysis reported in Figure 1.
The type of supplement used to develop the supplement, and the days of storage were predicted using PLS regression based on the MIR spectra of the samples (Table 1). The coefficient of determination in cross-validation (R2) and SECV were 0.98 (SECV: 0.10) and 0.70 (SECV: 2.39) for the prediction of the type of supplement and weeks of storage, respectively. The PLS loadings used by the models were reported in Figure 3. The highest PLS loadings for the prediction of the type of samples used to develop the supplement were observed around the lipid region, with two peaks observed between 2,849 and 2,916 cm−1 while around 1,707 and 1,769 cm−1 associated with lipids and ester carbonyl groups present in the sample (Marcott et al., 2014; Pazos et al., 2014). The PLS loadings derived from the prediction of time of storage were not clear where only the highest loadings were observed around 1,707 and 1,769 cm−1 associated with esters.
Cross-validation statistics for the prediction of weeks of storage and type of supplement in the samples analysed using mid infrared spectroscopy.
| R2 | SECV | Bias | Slope | LV | |
|---|---|---|---|---|---|
| Type of supplement | |||||
| All samples | 0.98 | 0.10 | −0.001 | 0.98 | 4 |
| Weeks of storage | |||||
| All samples | 0.70 | 2.39 | 0.062 | 0.62 | 5 |
| BP | 0.44 | 5.18 | 0.67 | 0.55 | 1 |
| BW1 | 0.20 | 4.61 | 0.30 | 0.13 | 1 |
| BW2 | 0.60 | 3.2 | 0.05 | 0.56 | 1 |
Note. BP = pea protein-based sulforaphane supplement; BW1 = whey protein-based sulforaphane supplement; BW2 = maltodextrin–whey protein blend-based sulforaphane supplement; LV = latent variables used to develop the partial least squares regression models; R2 = coefficient of determination in cross-validation; SECV = standard error in cross-validation.
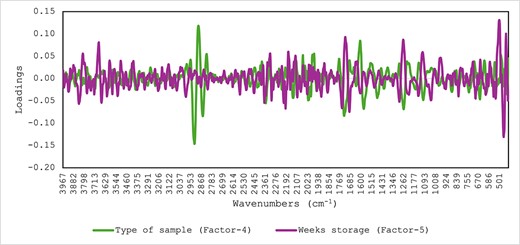
Optimal partial least squares loadings derived for the prediction of weeks of storage and type of supplement in the samples analysed using mid-infrared spectroscopy.
According to these results, MIR spectroscopy could be a very useful tool to differentiate between supplements based on the type of vegetable protein used (e.g., pea or whey protein). In addition, MIR spectroscopy can differentiate between supplements with additional processed ingredients (e.g., whey protein vs. whey protein–maltodextrin blend). The ability of MIR spectroscopy to assess the production might not be accurate yet could be helpful for the preliminary screening of the samples.
Prediction of the sampling time during the in vitro phases (gastric and intestinal) for the supplements using MIR spectroscopy
Figure 4 shows the PCA score plot of the aliquot samples taken at each sampling time during the in vitro gastric and intestinal phases and analysed using MIR spectroscopy. The PC1 explained 52% of the total variance in the MIR spectra of the aliquot samples associated with the type of based material used to prepare the supplement either with pea (BP) or whey protein (BW). Furthermore, PC2 (30%) explained the differences between the aliquots associated with BW1 and BW2. These differences might be due to the addition of maltodextrins during the product development. Figure 5 shows the highest loadings used by the PCA model that contribute to explaining the separation between samples along PC1 and PC2. The highest loadings in the PC1 were observed around the amide groups 1,694 and 1,587 cm−1, around 1,484 cm−1 associated with C=C and C–H, and around 1,356 cm−1 associated with C–O stretch from polysaccharides, while around 1,195, 1,113, and 975 cm−1 associated with C–O modes associated with polysaccharides (Movasaghi et al., 2008; Visnupriyan et al., 2023). The highest loadings in PC2 were observed around 1,581 cm−1 associated with amide groups and around 1,142 and 1,020 cm−1 C–O modes associated with polysaccharides (Movasaghi et al., 2008; Visnupriyan et al., 2023).
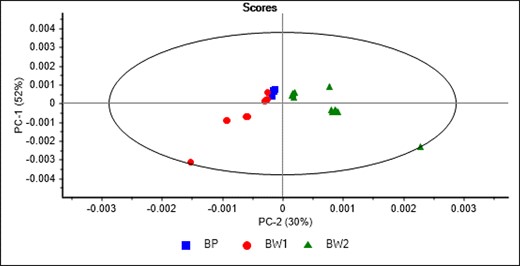
Principal component score plot of the samples collected at different times during the in vitro gastric and intestinal phases and analysed using mid-infrared spectroscopy.
Principal component loadings derived from the principal component analysis reported in Figure 4.
Table 2 shows the cross-validation statistics for the prediction of sampling time during the in vitro phases (gastric and intestinal) for all samples combined. The R2 and SECV were 0.71 (SECV: 23.1) and 0.41 (SECV: 32.9) for the prediction of sampling time during the in vitro gastric and intestinal phases, respectively. The PLS loadings used for the prediction of the sampling time during the in vitro gastric and intestinal phases are reported in Figure 6. The highest loadings in the gastric phase were observed around 1,070 cm−1 associated with the presence of glycosidic groups (Movasaghi et al., 2008; Visnupriyan et al., 2023), while the highest loadings in the intestinal phase were observed around the amide groups 1,694 cm−1 and 1,590 cm−1 associated with proteins and around 1,484 cm−1 associated with C=C and C–H corresponding to polysaccharides (Miller et al., 2013). These results suggested that changes in carbohydrates and proteins (e.g., amide groups) contribute to explaining the differences in the PLS regression statistics between the gastric and intestinal phases, respectively.
Cross-validation statistics for the prediction of sampling time in the samples collected during the in vitro gastric and intestinal phases and analysed using mid-infrared spectroscopy.
| R2 | SECV | Bias | Slope | LV | |
|---|---|---|---|---|---|
| Gastric phase | 0.71 | 23.1 | −1.08 | 0.62 | 4 |
| Intestinal phase | 0.41 | 32.9 | 1.96 | 0.51 | 3 |
| R2 | SECV | Bias | Slope | LV | |
|---|---|---|---|---|---|
| Gastric phase | 0.71 | 23.1 | −1.08 | 0.62 | 4 |
| Intestinal phase | 0.41 | 32.9 | 1.96 | 0.51 | 3 |
Note. LV = latent variables used to develop the partial least squares regression models; R2 = coefficient of determination in cross-validation; SECV = standard error in cross-validation.
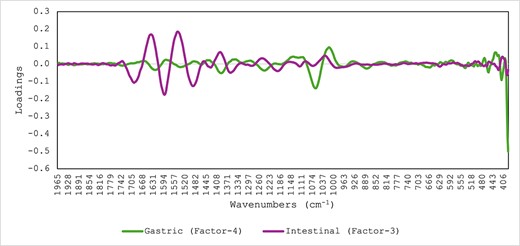
Optimal partial least squares loadings used for the prediction of sampling time in the samples collected during the in vitro gastric and intestinal phases and analysed using mid-infrared spectroscopy.
Conclusion
This study showed that ATR-MIR spectroscopy was able to monitor the in vitro digestibility of the protein-based sulforaphane supplements. It was observed that the PCA score plots and loadings were different between the type of protein used to prepare the supplement. The PCA analysis of the stored samples showed a similar trend between the samples. The PLS regression models were able to predict the type of samples and production age, however, with differences. Furthermore, the ability of MIR spectroscopy to predict these properties in other types of supplements, having different compositions, including supplements with low-standard ingredients must be evaluated.
Data availability
The data that support the findings of this study are available from the corresponding author upon reasonable request.
Author contributions
Ali Ali Redha (Conceptualisation [equal], Data curation [equal], Investigation [equal], Methodology [equal], Writing—original draft [equal], Writing—review & editing [equal]), Geoffrey R. Nash (Supervision [equal], Writing—review & editing [equal]), Luciana Torquati (Supervision [equal], Writing—review & editing [equal]), Michael J. Gidley (Supervision [equal], Writing—review & editing [equal]), and Daniel Cozzolino (Conceptualisation [equal], Data curation [equal], Formal analysis [equal], Methodology [equal], Project administration [equal], Resources [equal], Software [equal], Supervision [equal], Validation [equal], Visualisation [equal], Writing—original draft [equal], Writing—review & editing [equal]).
Funding
Financial support for this study was provided by internal funds of The University of Queensland and the QUEX Institute, a partnership between The University of Queensland and the University of Exeter. Ali Ali Redha's PhD is partially funded by PepsiCo, Inc.
Conflicts of interest
All authors declare no conflicts of interest.
Acknowledgements
The authors would like to thank Joseph Nastasi, Hung Hong, and Bernadine Flanagan from The University of Queensland for their assistance in this project. The views expressed in this report are those of the authors and do not necessarily represent the position of policy of PepsiCo, Inc. For the purpose of open access, the authors have applied a ‘Creative Commons Attribution (CC BY) licence to any Author Accepted Manuscript version arising.’
