


Abstract
Food waste is a significant global issue, and a large proportion of discarded food originates from domestic households. This underscores the need for effective methods to determine when food is no longer safe to consume, which could significantly reduce food waste. Current disposal practices largely rely on expiration or use-by dates, which often do not accurately reflect food spoilage due to varying storage conditions. Moreover, foodborne illnesses, which pose serious public health risks, highlight the need for more accurate spoilage detection methods. Recent advancements in food spoilage sensors, particularly those using colorimetric gas detection, offer promising solutions. These sensors, which detect spoilage gases without direct food contact, are enhanced by new materials and improved data analysis techniques. This review focuses on colorimetric gas sensors, exploring their principles and methods, including the use of user-friendly devices and image processing technologies. It also addresses the challenges and future directions for developing effective food spoilage sensors.
Introduction
The UNEP, 2021 Food Waste Index Report underscores substantial global concerns regarding food waste. It reveals that in 2019, an estimated 931 million tons of food were discarded globally, of which 61% originated from domestic households (UNEP, 2021). In South Korea, daily food waste generation in 2021 was recorded at 14,885 tons, with households and small eateries accounting for approximately 70% of the total food waste (Food Waste Management System, 2024). Therefore, it is essential for general consumers to easily and accurately determine the disposal status of food items to reduce food waste.
The current standard for consumers to discard food is based on the expiration date or use-by date printed on food packaging. According to a 2015 survey by the Food Marketing Institute in the United States, approximately 83% of American consumers dispose of food based on these dates (Fox Morone, 2020). However, food spoilage varies significantly depending on factors such as storage conditions (e.g., temperature, humidity, cleanliness of storage environment), making expiration dates or use-by dates inaccurate indicators of actual food spoilage, even though those dates are the guarantee that the food is non-toxic and safe under normal storage conditions. Therefore, these dates cannot be precise criteria for food disposal. Additionally, food spoilage and contamination leading to food-borne illnesses pose serious public health risks. For instance, the World Health Organization estimated in 2023 that globally, approximately 420,000 deaths occur annually due to foodborne pathogens (WHO, 2023). Thus, accurately detecting food spoilage caused by various factors is essential for minimising food waste and preventing foodborne illnesses. Additionally, there is a growing need for the development of user-friendly sensors that can conveniently and reliably indicate when food is no longer safe to consume.
Recently, various studies have been developing food spoilage sensors using diverse new materials (Ma et al., 2018, 2022; Teymouri & Shekarchizadeh, 2022; Zaragozá et al., 2015), and techniques for data analysis to enable consumers to easily interpret sensor results through data processing methods have been actively researched (Doğan et al., 2024; Khan et al., 2024; Teymouri & Shekarchizadeh, 2022; Vajdi et al., 2019). Gas sensors that detect gases produced by food spoilage and food-borne pathogens are considered ideal due to their non-invasive nature, avoiding direct contact with actual food. Current research spotlighting the detection of various harmful gases emitted by various consumer products suggests recent advancements in gas sensor technology could aid in developing sensors for detecting food spoilage (Bag & Lee, 2021; Ha et al., 2021; Ha et al., 2021b). Additionally, ongoing research endeavours are actively exploring methods to interpret sensor results easily for the general public, using techniques such as colour changes to represent detection outcomes (Li et al., 2019; Li & Suslick, 2019; Mazur et al., 2024; Miranda et al., 2011; Zaragozá et al., 2015) or employing user-friendly instruments to facilitate comprehension (Doğan et al., 2024; Escher et al., 2023; Yuan et al., 2023).
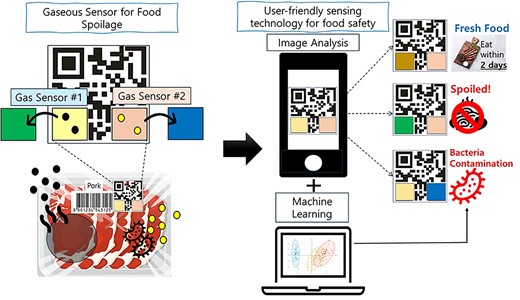
In this review, the focus is primarily on investigating colorimetric gas sensors among the developed food safety sensors, with a concentration on their principles and methods for analysing sensor results through mainly colour changes (Figure 1). The review is structured into three main parts. The first section examines and analyses the principles and representative cases of gas sensors detecting pH changes and volatile organic compound (VOC) emissions associated with food spoilage. The second section emphasises methods for analysing results from colorimetric gas sensors. This section explores sensor formats that can utilise user-friendly devices (e.g., QR codes, 3D printing, and electronic noses) and introduces image processing technologies. Finally, the review discusses challenges and future perspectives for developing gaseous food sensors in the future.
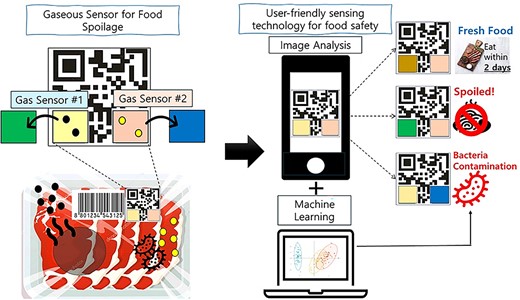
Diagram of the development of user-friendly gas sensors for food safety and the scope of this review.
Gaseous sensor for food spoilage
pH sensor
Gaseous compounds capable of altering pH levels (e.g., CO2, base amines, and sulphides) are intricately linked to the freshness of diverse food varieties. Typically, carbon dioxide (CO2) predominates as a principal by-product of microbial metabolism, while sulphides result from the degradation of foods. Furthermore, microbial activity in foods decomposes peptides and amino acids, ultimately producing volatile nitrogen compounds such as ammonia, dimethylamine, and trimethylamine. Carbon dioxide and sulphides are categorised as acidic gases, whereas nitrogenous gases are basic and contribute to pH elevation (Shao et al., 2021).
pH sensors are particularly well-suited for detecting food spoilage for two key reasons. First, a wide range of pH indicators exist that visibly change colour in response to shifts in pH levels. When these indicators are embedded in gas-permeable membranes or films, non-intrusive sensors can be created. Furthermore, pH indicators often extracted from fruits or vegetables such as anthocyanins, litmus, and cumerican (Weston et al., 2021), making them safer to use as food sensors. Secondly, the colour change of pH indicators is rapid and distinct, making it easily detectable by the naked eye. This allows the general public to readily observe colour changes and enables detailed analysis of food spoilage data using user-friendly devices.
In recent decades, pH sensors for detecting food spoilage have generally been developed using fabrication methods that incorporate pH indicators into polymer precursors. For example, Jang’s research group devised pH sensors to monitor the freshness of bell peppers and pork, employing colorimetric changes of pH indicators dependent of the levels of CO2 (Chen et al., 2018) and volatile basic nitrogen (Chen et al., 2019) in the headspace, respectively. They used various pH indicators such as bromothymol blue, methyl red, and bromocresol purple, and fabricated the indicators with methylcellulose and polyethylene glycol. In their study, they confirmed that CO2 and amines effectively alter the pH of atmospheric components, causing rapid and distinct colour changes in pH indicators as food undergoes decomposition (Figure 2A). Additionally by determining the threshold spoilage state of food through microbial analyses and sensory evaluation, they investigated colour changes in indicators at the threshold spoilage state. This allows for determining food consumption based on pH sensor colour changes. In addition, Niponsak et al. (2016) developed colorimetric starch-based indicators for detecting sulphur compounds during durian ripening. In their study, they also found that the fabricated sensor with pH indicators effectively changes its colour from pink to yellow depending on the sulphur levels in the headspace.
(A) Colour changes of four different pH indicator labels during a fresh-cut pepper spoilage (Chen et al., 2018) for the indicators, a and b used bromothymol blue at different concentrations, while c and d used a mixture of bromothymol blue and methyl red at varying concentrations. Reproduced from Chen et al. (2018) with permission from the Elsevier. (B) Overview of PDA bilayer synthesis and red-to-blue colour change via conformational twisting in the bilayer structure due to generation of gaseous compounds during food spoilage (figure on the right demonstrates the application of PDA bilayer for monitoring kiwi ripening) (Weston et al., 2022) reproduced from Weston et al. (2022) with permission from the Royal Society of Chemistry. PDA = polydiacetylene.
While pH indicators at the molecular level have proven successful in detecting food spoilage in numerous previous studies, enhancing the stability and sensitivity of these indicators remains a requirement for improvement. To address this point, recent research has been developing and applying nanoparticles or synthesised polydiacetylene (PDA) bilayers as alternatives to well-known pH indicators. For example, leveraging the strong affinity of copper nanoparticles (CuNPs) with sulphur compounds, Teymouri and Shekarchizadeh (2022) developed a colorimetric sensor specifically designed to selectively and sensitively monitor sulphur compounds produced during the spoilage of fish. This innovative sensor leverages the unique properties of PDA, a material known for its responsiveness to various gas components. When different gases interact with the PDA layer, they bind to it and induce structural changes. These alterations in the PDA structure result in noticeable colour changes, which can be visually detected and quantified, as illustrated in Figure 2B. This capability allows for effective monitoring of fish freshness and spoilage levels, contributing to enhanced food safety. Utilising PDA vesicles or PDA/nanoparticles synthesis, research has also progressed in detecting amine components generated by meat spoilage through colour changes (Weston et al., 2022; Zhai et al., 2018). Thus, by utilising new substances such as nanoparticles and PDA, it appears feasible to detect pH changes due to food spoilage more reliably and with higher sensitivity.
VOCs sensor
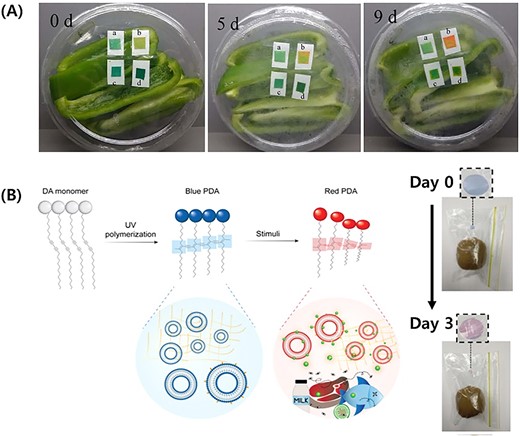
Microbial activity in food generates VOCs, including alcohols, aldehydes, hydrocarbons, ethers, esters, ketones, terpenoids, and other compounds (Wang et al., 2016). Thus, VOCs are considered indicators of food safety since microbial growth is closely associated with food spoilage. In recent studies, methods for discerning the spoilage of various foods through the detection of VOCs are being developed. For example, Ziyaina et al. (2019) identified VOCs generated over the storage period of milk and developed Schniffs reagent-conjugated SiO2 nanoparticles capable of effectively detecting these VOCs (e.g., aldehydes and ketones) through colour changes (Figure 3A). VOCs can react with Schiff's reagent, resulting in a colour change from colourless to magenta. This Schiff reaction occurs when the nucleophilic group of the reagent interacts with the carbonyl group of VOCs (e.g., aldehyde). In addition, Nguyen et al. (2020) developed a PDA-based sensor for detecting ethylene generated during kiwi ripening. These sensors are created by reacting PDA with Lawesson’s reagent, which decorated PDA with terminal thiol groups. When exposed to ethylene, the sensor transitions visibly from blue to red, with high sensitivity.
(A) Experimental setup for VOC detection in milk, aerobic counts in milk, and gaseous sensor colour change at 15 °C (Ziyaina et al., 2019). (B) Graphical abstract of a whole-cell biosensor array for monitoring VOCs generated by mould contamination (Ma et al., 2023). Figures are reproduced with permission from the copyright owner. VOC = volatile organic compound.
Furthermore, a widely developed form of VOC detection sensors involves developing colorimetric sensor arrays using various chemoresponsive dyes. These colorimetric sensor arrays have demonstrated significant efficacy in detecting food spoilage as well as identifying and quantifying VOCs. Li and Suslick (2019) developed a porous silica-based colorimetric sensor array designed for the rapid, quantitative, and selective detection of CO and ethylene. This array utilises five pH indicators, and the colour changes before and after exposure to specific VOCs are digitally recorded. These changes generate a unique fingerprint used to identify the gas compounds by comparison to a comprehensive library database, enabling effective monitoring of fruit ripening during storage. Morsy et al. (2016) introduced a colorimetric sensor array comprising 16 chemo-sensitive compounds as a non-invasive method to monitor fish spoilage during bacterial decomposition, detecting spoilage VOCs such as trimethylamine, dimethylamine, cadaverine, and putrescine.
The study by Ma et al. (2023) highlighted the importance of noting that mould contamination in foods can induce specific VOCs, causing health toxic effects such as quality deterioration and mycotoxin production. In their research, they developed a whole-cell biosensor array based on 14 promoters. The biosensor is responsive to three selected VOC markers: ethyl propionate, 1-methyl-1H pyrrole, and 2,3-butanediol-produced in pre-mould peanuts (Figure 3B). The issue of mutual interference from various VOCs was addressed by developing a sensitive and specific whole-cell biosensor array that utilises highly responsive promoters targeted to volatile markers.
Colorimetric sensor arrays or cell biosensors utilising promoters enable effective quantification and identification of various VOCs resulting from food spoilage and contamination. However, there is difficulty for the general public in interpreting these results, necessitating integration with a user-friendly interface. Further details on this topic are discussed in the User-friendly sensing technology for food safety section.
User-friendly sensing technology for food safety
Preparation type of colorimetric gases sensors
In the previous section, the principle of sensors detecting changes in pH and the generation of VOCs during food spoilage through colour changes was introduced. These colour changing sensors need to be interpreted in a way that enables the general public to effectively assess the degree of food spoilage and its suitability for consumption. The section focuses on sensor types and image processing techniques designed to facilitate easy interpretation of sensor results by consumers.
2D-printed QR code
Chemoresponsive dyes can be formulated into inks suitable for 2D inkjet printers, typically possessing Newtonian fluid properties with the aid of substances like glycerol and ethanol (Xu et al., 2021). Furthermore, using software, it is possible to specify the proportion and location of each ink, enabling sensor fabrication using a 2D inkjet printer. Quick Response Code (QR code) is a two-dimensional (2D) matrix barcode that offers large data storage capacity. QR codes are already widely used in various applications, and recent research is underway on food spoilage sensors utilising the form of QR codes, benefiting from public familiarity with analysing QR code information through smartphone apps.
Xu et al. (2021) successfully fabricated QR codes using two pH indicators, roselle anthocyanins and curcumin. In their study, they also found that varying the mixture ratio of these two dyes strongly influences colour changes in response to ammonia gas exposure. This suggests that adjusting the mixture ratio can enable the creation of diverse food spoilage sensors. As mentioned earlier, QR codes can store vast amounts of information, making them suitable for applications in food spoilage sensors. When applied, QR codes can detect not only changes in food freshness such as pH variations and VOC generation but also environmental changes (e.g., temperature fluctuations, humidity changes). For example, in Zhang et al. (2023) study, pH dyes and temperature-sensitive inks were printed at different points on QR codes, successfully enabling simultaneous detection of food spoilage and temperature changes. They developed a thermochromic zone using water-based inks containing an 18% mass fraction of thermochromic microcapsule powder, which proved to be highly sensitive to temperature and demonstrated excellent thermochromic reversibility, making it ideal for real-time temperature monitoring. This demonstrates that sensors utilising QR codes can be effectively utilised to assess the shelf life of food products in various environments.
The primary obstacle to utilising QR code colour changes for real-time food sensors is the potential variability in colour detection due to food storage conditions and environmental factors during image capture for later analysis (such as lighting conditions, brightness, etc.). To address these limitations, Pounds et al. (2022) fabricated pH dyes at the centre of QR codes and positioned important red, green, and blue colours in three corners as reference groups for colour analysis (Figure 4). This adjustment helps to correct pH dye colour changes according to environmental variations.
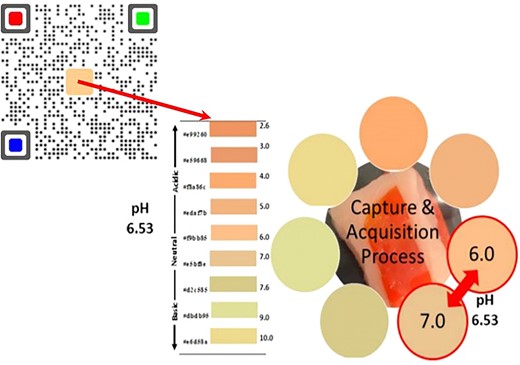
2D-printed QR code labels for detecting food spoilage. Designed QR codes with a pH sensor in the centre and three colour (red, green, and blue) standards positioned in the three corners, and pH sensor colour changes during the storage period of pork line (Pounds et al., 2022) reprinted with permission from Pounds et al. (2022). Copyright 2022 American Chemical Society.
3D printing
Recently, three-dimensional (3D) printing has emerged as a promising and versatile technique in various fields of analytical chemistry due to its rapid fabrication, user-friendliness, versatility, and low cost (dos Santos et al., 2022). In the 3D printing process, successive layers of materials such as polymers and composites are deposited onto a substrate in a digitally controlled manner. This method allows for the creation of both simple and intricate 3D structures. This 3D printing approach has been utilised in various sensors for food safety applications, including the detection of food spoilage (Li et al., 2022a; Zhai et al., 2022), allergens (Coskun et al., 2013), and pesticides (Chu et al., 2020). This method enables the development of multifunctional and biocompatible materials at a lower cost compared to conventional fabrication methods (Tracey et al., 2022).
One of the greatest advantages of using 3D printing for sensors is the ability to synthesise sensor that offer various sensing. For example, Li et al. (2022b) employed anthocyanin to detect pork freshness based on the release of volatile amines during meat protein composition, resulting in colour changes. Additionally, lemongrass essential oil (LEO) served as both an antibacterial and antioxidant agent, while chitosan acted as the substrate for the 3D-printed platform. This sensor not only monitors pork freshness through colour changes but also extends the food’s shelf life. Figure 5A illustrates the assessment of pork freshness at 4 °C over 15 days, measuring film discoloration due to the generation of amine compounds. Furthermore, freshness monitoring can be conducted using a smartphone and colour analysis.
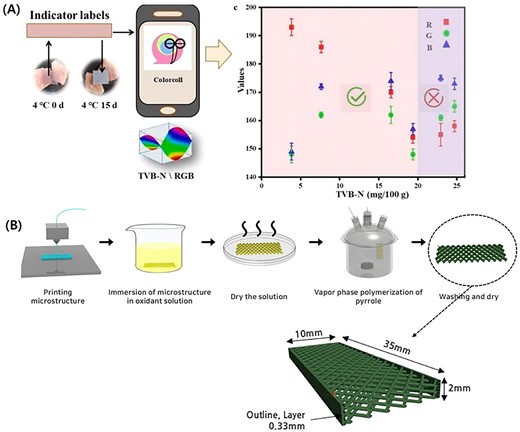
Gas sensors for detecting food spoilage utilising 3D printing. (A) A film sensor using 3D printer for pork spoilage detection and its application for smartphone to evaluate pork freshness (Li et al., 2022b). (B) Schematic process of fabrication of an ammonia gas sensor, detailing its porosity and dimensions. The graph illustrates the sensor’s selective response to varying concentrations of ammonia (Kim et al., 2022). Figures are reproduced with permission from the copyright owner.
Electrochemical gas sensors have also been successfully developed using 3D printing. Kim et al. (2022) successfully developed an electrochemical gas sensor using 3D printing technology. They utilised thermoplastic polyurethane–polypyrrole composites to create sensors for detecting ammonia gas and strain (Figure 5B). This approach overcomes the challenges of 2D substrates, such as complex geometry requirements and technical demands during fabrication. The sensor exhibited excellent strain sensing capabilities with robust stability and durability during 5,000 bending/releasing cycles. In addition to its mechanical performance, the composite material demonstrated significantly greater sensitivity to ammonia gas compared to other reducing gases, such as triethylamine, ethanol, and methanol, making it particularly effective for selective gas detection applications (Figure 5B). These results underscore how 3D printing can effectively address manufacturing limitations, enabling rapid and cost-effective sensor development.
Electronic nose
Due to the diverse range of gases produced depending on the food types and cause of food spoilage, there is a need for meticulous tool development to evaluate food spoilage caused by various gas emissions. For this purpose, electronic nose food sensors were developed as a multisensory array. Electronic noses are engineered devices designed to mimic the mammalian olfactory system within an instrument that achieves consistent measurements. They enable the identification and classification of volatile mixtures. Typically, an electronic nose system includes a multisensor array, an information-processing unit like an artificial neural network (ANN), software featuring digital pattern-recognition algorithms, and a reference library database (Wilson & Baietto, 2009). Among various types of electronic noses, a colorimetric sensor array utilises a broad range of chemical interactions by employing a set of chemoresponsive dyes immobilised in hydrophobic matrices. This method analyses colour changes upon exposure to various gases, making it extremely effective for the identification and quantification of analytes across diverse fields (Li & Suslick, 2019). Indeed, the utilisation of a colorimetric sensor array in electronic noses has successfully been researched for monitoring the freshness of various foods such as meat (Li & Suslick, 2016), fruit (Li & Suslick, 2019), and seafood (Zaragozá et al., 2015).
For example, Li and Suslick (2016) developed a portable colorimetric sensor array to detect meat spoilage. They employed 20 sensor elements immobilised in matrices and assessed the array's response to four key gases emitted by spoiled meats: hydrogen sulphide (H2S), dimethyl sulphide ((CH3)2S), trimethylamine (TMA), and cadaverine. As depicted in Figure 6, significant colour changes in the arrays were observable after exposure to all analytes, even at sub-ppm concentrations, enabling easy differentiation by visual inspection. Additionally, to assess the sensor array's capability to distinguish individual analytes, statistical analyses such as hierarchical cluster analysis (HCA) and principal component analysis (PCA) were conducted on the collected data, which will be elaborated upon in the following section. Overall, the array effectively discriminated the headspace VOCs of five different types of meats across storage periods ranging from freshly purchased to 4 days with exceptionally high accuracy.
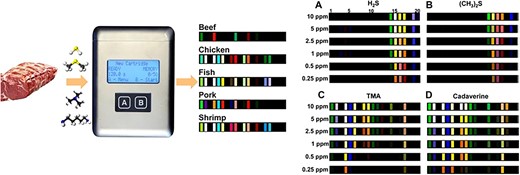
Schematic diagram of a colorimetric sensor array and sensing device for monitoring meat freshness, and colour difference profiles in response to four different VOCs (H2S, (CH3)2S, trimethylamine (TMA), and cadaverine) (Li & Suslick, 2016) reprinted with permission from Li and Suslick (2016). Copyright 2016 American Chemical Society. VOC = volatile organic compound.
Li et al. (2014) also designed a compact electronic nose system employing a colorimetric sensor array for evaluating pork freshness. In this study, the chosen metalloporphyrins within the sensor array are highly suitable for detecting VOCs emitted from pork due to their favourable characteristics, including accessible coordination sites for axial ligation. Moreover, these metalloporphyrins exhibit insensitivity to fluctuations in humidity levels. Twelve chemically responsive dyes are printed, which include metalloporphyrin dyes and pH indicators. These dyes are subsequently exposed to the headspace of pork samples. During the microbial spoilage of pork, microorganisms gradually decompose the protein components, resulting in the release of spoilage metabolites, particularly organic acids, hypoxanthine, and biogenic amines. Due to the emission of these VOCs, the presence of different components in the headspace of fresh and spoiled pork distinctly alters the colorimetric sensor array's colour changes. Because the dyes chosen for the sensor array exhibit non-specific sensitivity and broad cross-reactivity with volatile compounds (i.e., spoilage metabolites), multivariate calibration techniques such as PCA and linear discriminant analysis (LDA) were employed to assess pork freshness by analysing the colour variations of the sensor array.
Image processing technologies
Colorimetric analysis
The first step in data processing to evaluate food spoilage using the colorimetric sensors mentioned in the previous section is colorimetric analysis. Various methods have been developed to analyse the chromaticity of sensors using user friendly technologies such as scanners and smartphone cameras, among which the CIELAB (Commission International de l’Eclairage) and RGB (red, green, blue) colour models are effectively utilised.
The CIELAB colour space represents colour through three components: L for perceptual lightness and a and b for the four principal colours discernible by human vision: red, green, blue, and yellow (Figure 7A). The perceptual linearity of the CIE model across the visible spectrum ensures that colour differences align with human visual sensitivity (Mazur et al., 2024). These differences are quantified by Euclidean distances (ΔE) within the colour space. Generally, the value of ΔE is calculated using Equation 1:
where L, a, and b represent the colour values of the sensor, while L0, a0, and b0 denote the colour various of a standard whiteboard. The CIELAB colour space encompasses a broad spectrum of colours and enables precise colour comparisons across various devices and environments, making it widely adopted in colorimetric science (Mazur et al., 2024).
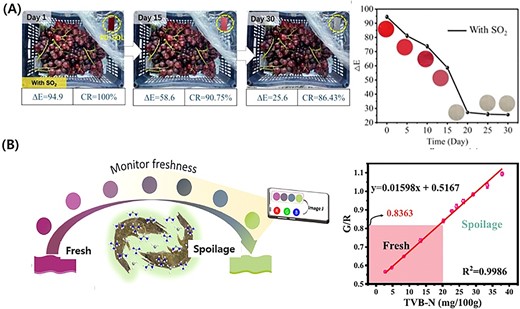
(A) Impact of SO2 gas on grape rotting rates over time and evolution of ΔE values with storage duration using the CIELAB system (Yuan et al., 2023) reprinted with permission from Yuan et al. (2023). Copyright 2023 American Chemical Society (B) colorimetric assessment of shrimp freshness using a multifunctional film and colour analysis via RGB colour model (G/R ratio) to determine spoilage level (Dong et al., 2023). Figures are reproduced with permission from the copyright owner.
The RGB colour model is a widely used system for analysing the chromaticity of various display technologies, including televisions, computer monitors, and laptops. This model interprets colour based on the intensity of three primary colours: red (R), green (G), and blue (B). By combining these three colours in different proportions, a vast spectrum of colours can be created. Each colour is represented by a specific combination of intensities, allowing for the accurate representation of images and videos on screens. It is widely understood and commonly employed in image processing. There are many software and apps developed for convenient use by users as the most widely adopted method for chromaticity analysis. However, a drawback is the difficulty in comparing colours between different devices.
Yuan et al. (2023) devised a colorimetric sensor for sulphur dioxide (SO2) gas to assess food status and storage conditions. They identified petunia dye extracted from natural petunia flowers, which exhibits sensitivity by changing colour in response to increasing SO2 concentrations. Colour differences were analysed using the CIELAB system, known for its comprehensive representation of the entire visible colour spectrum. This system is commonly applied in evaluating food quality and various other applications within the food industry. They computed the colour difference ΔE using Equation 1 provided, with the maximum modulation of total ΔE reaching up to 74.8, indicating a detection limit as low as 1.52 ppm.
The RGB colour model has also been successfully applied to various food sensors. For example, Dong et al. (2023) developed a colorimetric film sensor for monitoring shrimp freshness using purple sweet potato anthocyanin, a pH-sensitive dye (Figure 7B). Changes in dye colour due to the presence of volatile amines were captured using a smartphone camera positioned 20 cm away from the film. RGB colour analysis was performed using ImageJ software. As depicted in Figure 7B, the G/R ratio exhibited a robust linear correlation with volatile amines, demonstrating that RGB analysis coupled with the colorimetric film effectively quantified and qualified the assessment of shrimp freshness.
Data analysis incorporating with machine learning
For colorimetric sensors aimed at food safety, it is essential to convert the detected colour changes into more intuitive and easily understandable data with high accuracy. Particularly when detecting multiple gas components and utilising arrays akin to electronic noses, processing a vast amount of data is crucial. This data processing is vital for assessing the degree of food spoilage and determining its suitability for food consumption.
Machine learning (ML) is an emerging methodology demonstrated to effectively integrate diverse forms of data, encompassing both structured and unstructured formats (Wang et al., 2022). ML methods prove particularly advantageous in scenarios involving wide data, where the number of input variables exceeds the number of subjects. ML operates with minimal assumptions regarding the underlying data generation processes and remains effective even in instances where data collection lacks a meticulously controlled experimental design (Bzdok et al., 2018). These strengths of ML have facilitated its widespread adoption across diverse fields, notably gaining prominence as a promising tool in research aimed at predicting food safety (Deng et al., 2021; Saeed et al., 2022). In this review, two ML methods—HCA and PCA—which are prominent methods commonly used for food safety monitoring and prediction, are introduced, and their applications are illustrated. Both HCA and PCA are unsupervised data analysis methods.
Hierarchical cluster analysis
HCA is an agglomerative clustering method that identifies clusters based on Euclidean distances calculated from experimental data. In its basic configuration, adjacent data points are sequentially grouped into clusters, which are subsequently merged with other neighbouring points or clusters until all elements are interconnected within the hierarchical structure (Askim et al., 2013). HCA is frequently employed to assess dissimilarities among data points and cluster them within a multivariate vector space (Nie et al., 2022).
Li and Suslick (2016) developed an electronic nose designed to monitor meat freshness, utilising an array that immobilised 20 different dyes. The colorimetric array was responsive to volatile gases emitted by five different types of meat over a period of up to 96 hr (Figure 8A). As depicted in Figure 8A, the response of the colorimetric array relative to storage time showed the largest response for fish and the smallest for beef. This indicates that the protein composition of meat is more critical for gas emission than bacterial strains. The RGB colour model was employed to analyse the array's response, followed by HCA using MVSP software for database clustering (Figure 8B). As shown in Figure 8B, HCA revealed three distinct classes of responses—fresher, less fresh, and spoiled. The application of HCA resulted in excellent clustering among triplicate samples of each meat at various time points, highlighting its enhancement of the sensor's ability to quantitatively assess meat freshness.
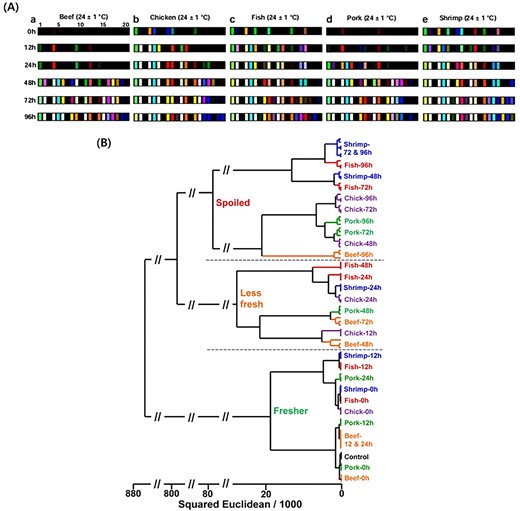
(A) Optoelectronic nose sensor array colour response to five different meats at 24 °C during 48 hr. (B) Results of HCA for spoilage analysis of five types of meat stored at 25 °C (Li & Suslick, 2016) reprinted with permission from Li and Suslick (2016). Copyright 2016 American Chemical Society.
Principal component analysis
PCA is a method for reducing dimensions that estimates the inherent dimensionality of data and aims to project it into the smallest possible number of dimensions. (Li et al., 2019) PCA is extensively utilised to analyse data from diverse sensors because it enables straightforward visual discrimination of group similarities and differences through PCA plots. In contrast to HCA, PCA creates its own dimensional space, which facilitates basic predictions: one can project the unknown sensor response onto the PCA dimensional space and ascertain whether the new data point closely aligns with data from the training set. Details are described in Li et al. (2019).
In the study by Nie et al. (2022), a 5 × 5 colorimetric sensor array was fabricated on a square polyvinylidene fluoride film. The array was then exposed to various gases related to freshness, evaluating the freshness of four types of meat over 72 hr at 25 °C. Significant colour changes were observed during monitoring, followed by RGB analysis. PCA was employed to demonstrate the sensor's ability to quantitatively assess meat freshness. PCA results can illustrate a PCA score plot of the first two principal components, showing distinct separation among analytes with clearly circled clusters (e.g., fresh, less fresh, and spoiled). Thus, the PCA score plot allows for intuitive visual grouping, making it advantageous for easy classification of new data points, thus demonstrating significant potential for application in food sensor technology.
Challenges and future perspectives
As mentioned earlier, food sensors are actively researched for enhancing food safety through food quality monitoring and effectively preventing food waste. However, they are not widely commercialised yet. This section aims to inspire future research and sensor utilisation by suggesting directions for the advancement of food sensors. Figure 9 illustrates a summary of the challenges and future perspectives of gaseous food sensors.
Integrated sensory system: Colorimetric gas sensors can be fabricated in the form of films using 2D or 3D printing techniques, or by doping pH dyes into polymers. This allows them to be integrated with barcode or QR code formats like other sensors used for price or food distribution tracking. This can efficiently share information about food because it can provide various information with one label.
Improvement of food safety: When creating a food sensor, it is possible to include substances that not only detect food spoilage but also extend the food's shelf life by providing materials such as antioxidant agents, antibacterial agents, and others. For example, in the study by Li et al. (2022a, 2022b), they utilised 3D printing to create a sandwich-like film incorporating pH dye anthocyanin, antioxidant, and antibacterial properties from LEO. This allowed for detection of food spoilage while simultaneously enhancing the shelf life of the product, increasing its utility as an intelligent food package.
Affordable price: To achieve the commercial mainstreaming of food sensors, it is pragmatically crucial to produce them at an affordable price. Therefore, selecting materials that enable the production of food sensors at a very low cost (less than $1) and ensuring compatibility with the food packaging process are considered imperative.
Law and policy: Currently, the general public predominantly relies on the expiration date based on the production date, rather than the degree of food spoilage, when deciding whether to discard food items. Therefore, efforts are needed to establish standards for the maximum allowable concentration of pathogens in food or the concentration of chemical substances capable of detecting food spoilage more accurately. The standards were developed to incorporate acceptable concentration ranges of established quality indicators for food. Food sensors have the potential to provide more reliable assessments of food safety compared to date labelling tools (Weston et al., 2021).
Compatibility with user friendly device: To enable easy interpretation of food sensor results by the general public, it is crucial to establish a platform that utilises user-friendly devices for sensor result analysis. As mentioned earlier, if there is a colour change in the sensor, analysing the colour and its results through methods such as ML is essential. This integration of product packaging and devices should allow consumers to easily determine the consumability of products. Collaboration across various fields is essential to achieve this goal.
Use of ecofriendly device: All materials used in packaging incorporating sensors should be non-toxic to humans, and environmentally friendly materials are strongly recommended. In fact, various studies are striving to develop safe and biodegradable materials for food packaging by utilising easily decomposable polymers or nanomaterials (Ananda et al., 2017; Kuswandi, 2017). When developing food sensors, incorporating such materials could potentially facilitate their integration as components of eco-friendly food packaging solutions.
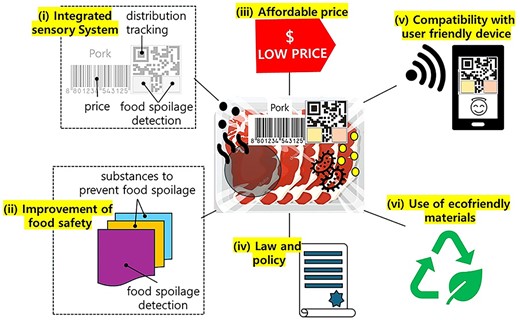
Challenges and future perspectives of food sensors.
Conclusion
This review has delved into the realm of colorimetric gas sensors within the landscape of food safety sensors. It has extensively explored their operational principles and methodologies for interpreting sensor outcomes through colour variations. The colorimetric gas sensors represent a promising frontier in food safety monitoring due to their simplicity and adaptability to diverse applications. These sensors hold great potential for real-time, on-site detection of food spoilage, providing an accessible solution for both industrial and consumer markets. The adoption of user-friendly formats such as QR codes, 3D printing and electronic noses, coupled with advanced image processing technologies is pushing the boundaries of how food quality can be assessed in various settings.
However, despite these advancements, significant challenges remain. One of the key obstacles is the standardisation of sensor performance, particularly in ensuring accuracy and reliability across diverse food matrices. Environmental factors such as temperature, humidity, and cross-sensitivities to non-target gases also present technical hurdles that must be addressed through more robust sensor design and calibration techniques.
From a future perspective, emerging technologies such as metal–organic framework materials, which are gaining significant attention, need to be further researched and developed for broader applications in food safety. Additionally, continued innovation in sensor miniaturisation, smart packaging integration, and the use of machine learning algorithms to enhance data interpretation are expected to push the boundaries of this field. As the field progresses, collaboration between food scientists, material engineers, and data analysts will be crucial in driving the development of next-generation sensors that are not only more accurate but also affordable and sustainable. These advances could play a transformative role in global food safety by reducing food waste, preventing food-borne illnesses, and improving public health.
Moreover, the consumption of safe food is a critically important global environmental and public health challenge, particularly in developing countries with limited access to healthcare facilities where food hygiene management is crucial. Therefore, the development of non-invasive sensors to detect gases generated by food spoilage, and the clear representation of sensor results using user-friendly devices and data analysis techniques, appears increasingly vital for the future.
Author contributions
Yeonjeong Ha (Conceptualization [lead], Formal analysis [lead], Funding acquisition [lead], Investigation [lead]).
Funding
This paper was supported by the research fund, 2023, Pyeongtaek University in Korea.
Conflicts of interest
The author declares no conflicts of interests.
Acknowledgements
None.
