


Abstract
Jaggery, a natural unrefined sweetener rich in phytonutrients, could be used as a healthier substitute to develop functional foods. The present study intended to utilise liquid jaggery in place of refined sugars to develop a functional fruit snack bar. Five different formulations were prepared by varying levels (0%–100%) of liquid jaggery in conventional fruit bar containing pumpkin pulp as base material. The addition of jaggery significantly enhanced bioactive constituents and minerals, which were also confirmed by ICAP analysis. Based on sensory characteristics, pumpkin bars prepared by replacing sugar with 50% liquid jaggery were selected for shelf study evaluation. Bars were packed in laminated foil and butter paper and stored under room (25 ± 1 °C) and refrigerated (4 ± 1 °C) conditions. Irrespective of storage temperature and packaging materials, significant variation was noticed in moisture content and textural characteristics of stored fruit bars. Total and reducing sugars and titratable acidity increased while bioactive constituents and colour values remarkably decreased with progression of storage period. Except moisture, the rate of loss of quality attributes was rapid at room temperature. Stored jaggery-based pumpkin bars packed in both packagings showed satisfactory microbial and organoleptic quality for 6 months.
Introduction
The demand for nutritious meals compatible with the health and wellness of consumer has increased. Food companies are exploring opportunities to produce nutritious ready-to-eat foodstuffs, focussing on ingredients from fruits and vegetables, because of their health-maintaining benefits and protection against several chronic diseases (Agrahari et al., 2004). Consumer awareness of ready-to-eat snacks has become a way of life due to their easy availability and increased shelf life. Confectionery, cookies, fried chips and savoury nibbles are all examples of ready-to-eat snacks (Maity et al., 2016).
One such healthy food is fruit bar, which is an intermediate product prepared by concentrating fruit puree or pulp into a thick mass, dried and cut into the desired shape (Dhiman et al., 2020). Because of their high nutritional value drawn from natural ingredients and chewy texture, fruit bars are panacea for all age groups. Fruit bars available in the market are formulated by mixing one or more types of fruit pulps with sugar, binders, colour and flavours (Singh et al., 2022a, 2022b). Refined sugars or sucrose makes up a major portion of confectionary items due to their sweetening properties, modification of technological features, and role in extending the shelf life of food products (Gartaula & Bhattarai, 2014). Nutritionally, sugars provide empty calories (4 Kcal/g) and lack the natural vitamins, minerals, and bioactive constituents present in sugarcane (Kumar & Singh, 2020). The demand of health-conscious consumers could be fulfilled by increasing the nutritive value of bars by replacing refined sugars with natural non-refined alternatives which can help people enjoy the sweet taste while limiting the calorie intake.
Among a variety of natural alternatives, jaggery (available in solid, granular or liquid form) has been recommended as the best substitute for refined sugar due to its rich phenolic profile and high antioxidant potential (Barrera et al., 2020; Cervera-Chiner et al., 2021). Several studies have reported that a 100 g of jaggery contains important minerals (calcium: 40–100 mg, magnesium: 70–90 mg, potassium: 1056 mg, phosphorus: 20–90 mg, sodium: 19–30 mg, iron: 10–13 mg, manganese: 0.2–0.5 mg, zinc: 0.2–0.4 mg, copper: 0.1–0.9 mg) and vitamins (vitamin A: 3.8 mg, vitamin B: 0.02 mg, vitamin C: 7.00 mg, vitamin D2: 6.50 mg, vitamin E1: 11.30 mg) (Kumar & Singh, 2020; Shrivastava & Singh, 2020). Harish Nayaka et al. (2009) reported higher total phenolic content in jaggery (383.7 mg GAE/100 g) compared to brown sugar (37.2 mg/GAE 100 g) and refined sugar (2.6 mg GAE/100 g). The presence of these phytoconstituents enhances the nutritional and medicinal value of jaggery. Jaggery is far complex than sugar, as it is made up of longer chains of sucrose; hence, it is digested slower than sugar, releases energy gradually and not spontaneously (Rao & Singh, 2022).
Jaggery, which is also available in liquid syrup form, is an intermediate product prepared by concentrating sugar juice till a striking temperature of 105°C is attained. Liquid jaggery contains 30%–35% water, 40%–60% sucrose, 15%–25% reducing sugars, 0.75% total minerals including 8.5–10 mg/100 g iron, 30–300 mg/100 g calcium, and 30–50 mg/100 g phosphorus with very low amounts of fat and protein (Pawar et al., 2017; Rao & Singh, 2022).
Accordingly, total or partial replacement of sucrose by natural non-refined sugar derivatives has been proposed in the literature. Lamdande et al. (2018) prepared muffins by replacing refined sugar with jaggery and concluded that jaggery can be utilised on an equal weight basis of sugar without affecting the properties of the bakery products. Similarly, Gartaula & Bhattarai (2014) replaced sugar with jaggery for the preparation of Bomboyson (a traditional dairy product prepared by cooking milk solids with sugar and fat). However, limited studies are available on the utilisation of non-refined derivatives of sugarcane in confectionary food items.
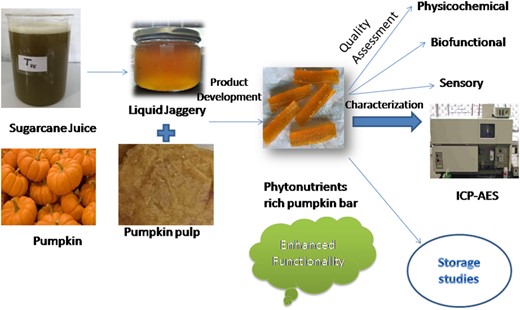
Therefore, the very purpose of this study was to investigate the effect of the replacement of sucrose by jaggery syrup on the quality of fruit bar and to study its storage stability. Besides the use of jaggery, bars were formulated utilising pumpkin pulp in order to further enhance its nutritional profile as pumpkin flesh is enriched with large quantities of minerals, vitamins, phenolics and carotenoids. Having nutritional richness, only a few products are made from pumpkin commercially and consumption of pumpkin is limited to fresh fruit only. Hence, the present research was based on utilising both pumpkin pulp and liquid jaggery to formulate a functional confection.
Material and methods
Collection of raw material
Pumpkins were procured from the Department of Vegetable Science, Punjab Agricultural University, Ludhiana, India. Sugarcane variety (CoPb 93) was procured from Regional Research Station, Kapurthala, India. Analytical grade chemicals and reagents were purchased from Sisco Research Laboratories Pvt. Ltd., India, and standards used for phytochemicals estimation were purchased from Sigma-Aldrich Co.
Preparation of pumpkin pulp
Pumpkins were washed, peeled, and finely chopped. The slices were then run through a pulp extractor to obtain fine pulp. Extracted pulp was promptly packaged in polypropylene pouches and kept at −18°C until employed in product processing.
Preparation of liquid jaggery
Sugarcanes were washed thoroughly under running tap water to remove adhering impurities before passing through the juice extractor. The extracted juice was concentrated in a steam-jacketed kettle till the TSS reached 69 ± 1°B. Aloe vera mucilage (0.4%) was added during concentration process to clarify the juice (Chandel, 2021). The prepared liquid jaggery was packed in glass jars (200 mL capacity) until used in bar making process.
Formulation of bars
Pumpkin bars were formulated by incorporating liquid jaggery in different proportions following the method given by Dhiman et al. (2020) with some modifications. Four different formulations namely F1, F2, F3, and F4 were prepared using liquid jaggery to replace sugar at 25%, 50%, 75%, and 100% levels, respectively. The bar prepared with 100% sugar (without liquid jaggery) was taken as control (F0).
The basic ingredients included pumpkin pulp (100 g), sugar (80 g)/liquid jaggery, pectin (2.4 g) and citric acid (0.2 g). Pumpkin pulp was cooked with ¾ amount of required sugar/liquid jaggery along with the addition of citric acid. Pectin was added after mixing it with left over ¼ amount of sugar/liquid jaggery to prevent lumps formation. The mixture was cooked until it reached the end point i.e., TSS above 75°B (Singh et al., 2022a, 2022b). The resultant mixture was poured onto the trays greased with oil followed by cooling at room temperature. After that, sheet of bar was cut into small rectangular pieces and packaged.
Physicochemical analysis
Moisture content, ash, TSS, titratable acidity, total sugars and reducing sugars were assessed following Ranganna (2005). The water activity of the product was determined using a digital water activity meter. A handheld chromameter (Model CR 400, Konica Minolta, USA) was used to determine the colour coordinates and results were presented as L, a and b values where L varied between 0 and 100 indicating lightness, +a: redness/−a: greenness and +b: yellowness/−b: blueness of the product (Aggarwal et al., 2022). Textural properties (hardness, gumminess, chewiness, springiness, and cohesiveness) of bar formulations were examined using a textural analyser (LLOYD texture instrument LR 5 K, England) coupled with an aluminium probe, P-75. The original height (10 mm) of the sample was compressed to half, the time between compressions was 5 s, and the post-test and testing speed was 1 mm/s (Aggarwal et al., 2022).
Phytochemical analysis
For ascorbic acid determination, a standard titrimetric method was conducted using 2,6-dichlorophenol indophenol dye (0.04%) as given by Ranganna (2005). Total phenols were spectrophotometrically assessed using the Folin-Ciocalteau reagent and results were reported as Gallic acid equivalents (mg GAE/100 g). Antioxidant activity, as free radical scavenging activity was assessed using DPPH dye (1.1-diphenyl-2-picryl-hydrazil) according to the procedure given by Singh et al. (2022a, 2022b) and the results were reported as Trolox equivalents (mg TE/100 g). Total carotenoids were analysed using 80% acetone (Aggarwal et al., 2022) and results were reported as mg/100 g.
Microbiological analysis
Microbial analysis in terms of total plate count, yeast and mould counts, and coliform counts was done following the methods of Samsiah et al. (2009).
Sensory analysis
A semi-trained panel of 30 panellists from the Department of Food Science and Technology, Punjab Agricultural University, assessed the sensory quality of prepared bars based on colour, texture, flavour, and overall acceptability. Sensory parameters were judged using a 9-point hedonic scale, with 9 representing “Liked extremely” and 1 representing “Disliked extremely.”
Storage studies
The bars (10 g each) were packed manually in two different packaging materials (laminated foil and butter paper) and stored at room (25 ± 1 °C) and refrigerated (4 ± 1 °C) temperatures.
Statistical analysis
One-way ANOVA followed by Tukey's post hoc test at 5% level of significance was used to statistically analyse the outcomes using a Completely Randomised Design (CRD) in the SPSS software (IBM, SPSS Inc., USA). For each analytical finding, three replications were conducted and the results were expressed as mean ± standard deviation.
Result and discussion
Physicochemical analysis of different liquid jaggery-based pumpkin bar formulations
Formulated pumpkin bars presented moisture content and water activity within the expected range of moisture (15%–50%) and water activity (0.70–0.90) for intermediate moisture foods (Maity et al., 2016). The ash content of bars also increased significantly (P < 0.05) with the increase in concentration of liquid jaggery (0%–100%) (Table 1). Formulation (F4) showed the highest (3.41%) ash content, which could be attributed to higher amount of minerals present in liquid jaggery (Ayare et al., 2020). Similar trend was noticed by Koohestani et al. (2019) where the authors reported that the addition of jujube powder (rich in minerals) significantly raised the ash content of toffees compared to control. However, varying concentrations of liquid jaggery had non-significant effect on titratable acidity of bar formulations that lied in the range of 0.93%–1.03% (Table 1).
Effect of addition of different jaggery concentrations on compositional and phytochemical characteristics and mineral profile of different bar formulations
| Formulations | F0 | F1 | F2 | F3 | F4 |
|---|---|---|---|---|---|
| Physicochemical characteristics | |||||
| Moisture (%) | 14.2 ± 0.6b | 15.6 ± 0.6a | 15.9 ± 0.4a | 15.9 ± 0.6a | 15.9 ± 0.5a |
| Water activity | 0.73 ± 0.02a | 0.73 ± 0.03a | 0.73 ± 0.03a | 0.72 ± 0.04a | 0.73 ± 0.03a |
| Ash (%) | 0.8 ± 0.0c | 2.9 ± 0.1b | 3.3 ± 0.0a | 3.4 ± 0.1a | 3.4 ± 0.1a |
| Titratable acidity (% citric acid) | 0.9 ± 0.0a | 0.9 ± 0.0a | 0.9 ± 0.0a | 0.9 ± 0.1a | 1.0 ± 0.1a |
| Total sugars (%) | 67.3 ± 2.0a | 40.2 ± 1.2c | 42.2 ± 1.2c | 47.8 ± 1.9b | 51.1 ± 1.6b |
| Reducing sugars (%) | 18.1 ± 0.6a | 11.3 ± 0.3c | 12.5 ± 0.7c | 16.1 ± 0.5b | 18.1 ± 0.7a |
| Phytochemical characteristics | |||||
| Ascorbic acid (mg/100 g) | 5.3 ± 0.3c | 7.0 ± 0.3b | 10.9 ± 0.5a | 10.9 ± 0.6a | 11.4 ± 0.4a |
| Total carotenoids (mg/100 g) | 12.6 ± 0.4d | 16.5 ± 0.5c | 22.6 ± 0.5b | 23.3 ± 0.7b | 24.7 ± 0.6a |
| Total phenols (mg GAE/100 g) | 195.1 ± 8.5d | 432.0 ± 8.4c | 484.6 ± 7.9b | 521.0 ± 12.0a | 543.6 ± 11.3a |
| Antioxidant activity (mg TE/100 g) | 56.6 ± 2.9d | 129.3 ± 3.5c | 174.9 ± 3.5b | 185.4 ± 5.9ab | 189.99 ± 4.84a |
| Mineral content (mg/100 g) | |||||
| Calcium | 131.40 ± 3.9d | 175.3 ± 3.5c | 184.4 ± 3.2c | 205.1 ± 5.4b | 221.3 ± 6.9a |
| Potassium | 499.2 ± 5.7e | 1263.0 ± 7.4d | 1801.6 ± 9.4c | 2010.0 ± 10.0b | 2254.5 ± 11.0a |
| Magnesium | 27.6 ± 1.1e | 98.2 ± 2.2d | 127.0 ± 3.9c | 150.6 ± 5.3b | 175.4 ± 6.6a |
| Phosphorous | 19.8 ± 0.8e | 116.4 ± 3.4d | 183.7 ± 4.0c | 198.1 ± 5.1b | 216.3 ± 6.0a |
| Manganese | 0.2 ± 0.01e | 0.5 ± 0.0d | 0.7 ± 0.0c | 0.8 ± 0.1b | 0.9 ± 0.1a |
| Iron | 2.3 ± 0.1d | 6.5 ± 0.2cd | 10.6 ± 0.5c | 16.0 ± 1.1b | 21.2 ± 3.5a |
| Copper | 0.3 ± 0.0e | 1.1 ± 0.1d | 1.6 ± 0.1c | 1.9 ± 0.1b | 2.0 ± 0.2a |
| Zinc | 2.6 ± 0.2d | 3.2 ± 0.2cd | 3.9 ± 0.2bc | 4.1 ± 0.3b | 5.0 ± 0.6a |
Mean ± standard deviation; n = 3; mean in the same row with different alphabetical letters are significantly (P < 0.05) different formulations: F0, F1, F2, F3, and F5 = 0%, 25%, 50%, 75%, and 100% liquid jaggery.
Total sugars of control bar were found to be considerably (P < 0.05) higher than jaggery-based pumpkin bar formulations (Table 1). This decrease might be due to lower content of sucrose in jaggery compared to refined sugar (Lamdande et al., 2018). Jagannadha Rao et al. (2007) reported 40%–60% sucrose and 15%–25% invert sugars in liquid jaggery compared to crystallised sugar that contained 94%–98% sucrose. The content of reducing sugars was found to be higher in formulation F4 with 100% liquid jaggery, which might be due to higher amount of invert sugars i.e., fructose and glucose present in non-refined liquid jaggery. On contrary, Cervera-Chiner et al. (2021) reported higher amount of reducing sugars in kiwi and strawberry jams prepared with lower percentage (15%) replacement of refined sugars with jaggery. The authors linked this observation with the inversion of sucrose occurring at low pH during jam preparation.
Colour plays an important role in consumer acceptability of food products. It was found that F0 was lightest in colour (L = 40.82) whereas F4 was darker (L = 35.11) among all the formulations (Fig. 1). Dark colour of liquid jaggery (lower L value; Table S1) might have contributed towards dark appearance of the product (Chandel, 2021). All bar formulations showed positive a and b colour coordinates, indicating an orangish hue in the formulated product. Compared to control, b value depicting yellowness was found higher in jaggery-incorporated bars, which might be due to the incorporation of liquid jaggery containing an appreciable amount of carotenoids (Table S1).
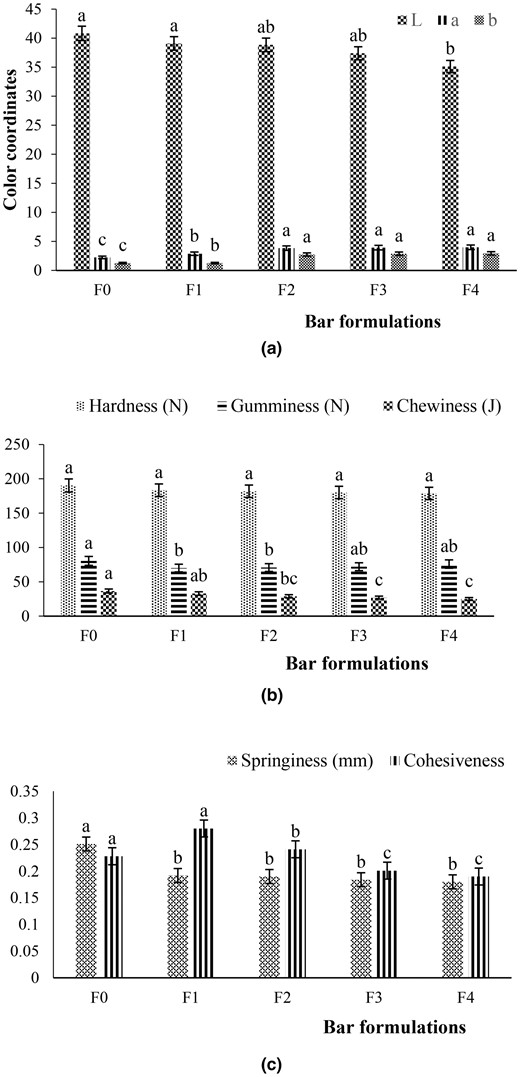
Influence of incorporation of different jaggery concentrations on colour and textural characteristics of different bar formulations: F0, F1, F2, F3, and F5 = 0%, 25%, 50%, 75%, and 100% liquid jaggery, respectively.
The replacement of sugar with jaggery significantly (P < 0.05) changed the textural properties of the pumpkin-based bar (Fig. 1). Control bar was harder in texture, which could be sourced from its lower moisture content (14.24%) compared to formulations prepared with the addition of liquid jaggery (15.61%–15.92%) (Table S1). The findings of the previous research showed that moisture content plays a pivotal role in determining the hardness of texture and there exists an inverse relationship between them (Shrivas et al., 2018; Koohestani et al., 2019). Higher moisture content of liquid jaggery might have slowly enhanced the inner particle space of the solid and reduced the strength of solids, giving rise to a less stiff product (Aggarwal et al., 2022). Similarly, control formulation (F0) had higher gumminess, chewiness, springiness and cohesiveness (Fig. 1). Among the different jaggery-based formulations, it was observed that with increasing concentration of liquid jaggery from 25% to 100%, the values of the textural attributes decreased which might be attributed to the higher moisture content of liquid jaggery.
Phytochemical characteristics of different liquid jaggery-based pumpkin bar formulations
Control (F0) bar containing no liquid jaggery had lower phytochemicals and antioxidant potential compared to formulations prepared with liquid jaggery (Table 1). A noticeable (P < 0.05) increase was found in bioactive constituents of bars with an increase in concentration of liquid jaggery. Higher phytochemicals present in liquid jaggery (Table S1) might have resulted in this increment in jaggery-containing formulations. Formulation (F4) contained almost double the amount of ascorbic acid and carotenoids when compared to F0 (Table 1). Total phenolics and antioxidant activity were also found higher in F4 (Table 1). Lamdande et al. (2018) and Cervera-Chiner et al. (2021) also reported a substantial increment in phytochemicals in functional fruit jams with higher levels of jaggery (75%) compared to control jam prepared with refined sugar.
Jaggery is often termed as medicinal sugar due to its inherent richness in minerals (0.6%–1.0%) compared to refined sugar possessing only a negligible amount (0.05%) (Jagannadha Rao et al., 2007). With an increase in the level of incorporation of liquid jaggery in different bar formulations, a noticeable (P < 0.05) increase in mineral content was observed (Table 1). Formulation F4 showed the highest amount of macro and micro minerals (Table 1). Ayare et al. (2020) also noticed higher mineral content in basundi (an Indian traditional dairy dessert) prepared with 6% jaggery compared to the dessert prepared with white sugar. It is apparent that formulated jaggery-based pumpkin bars can provide a substantial quantity of these functional nutrients beneficial for human health.
Sensory properties
A noticeable (P < 0.05) difference was observed in the overall acceptability scores of control (7.17 on a 9-point Hedonic scale) and various jaggery-incorporated bar formulations. With increase in concentration of liquid jaggery above 50%, the panellists observed an enhanced taste of jaggery. Thus, formulations F3 and F4 received lower acceptability scores. Among all the formulations, F2 (with 50% liquid jaggery) received the highest overall acceptability (7.90) score and was selected for shelf life studies.
Influence of storage on quality characteristics of jaggery-based pumpkin bars
Physicochemical properties
Regardless of packaging material, storage period had a significant (P < 0.05) effect on moisture content of pumpkin bars (Table 2). The initial moisture content was 15.85% which decreased to 13.94% at the end of 6 months of refrigerated storage, which might be due to surface evaporation under reduced temperature conditions (Shrivas et al., 2018). Whereas, a noticeable (P < 0.05) gain in moisture was found under ambient storage conditions which could be due to the hysteresis effect coming from the inclusion of moisture from the surroundings by hygroscopic components of bars. A similar pattern was described by Singh et al. (2022a, 2022b) and Aggarwal et al. (2022) during storage of date and kinnow bars under related storage conditions. Water activity followed the similar trend regardless of storage temperatures and packaging materials though the effect was found statistically non-significant (P < 0.05). Correlation between moisture and water activity is well established; the higher the moisture content, the higher the water activity and vice-versa (Aggarwal et al. 2022).
Influence of storage on physicochemical and phytochemical characteristics of pumpkin bars
| Temperature | Room temperature | Refrigerated temperature | |||||||
|---|---|---|---|---|---|---|---|---|---|
| Storage period (months) | Packaging materials | 0 | 2 | 4 | 6 | 0 | 2 | 4 | 6 |
| Physicochemical analysis | |||||||||
| Moisture (%) | Laminated foil | 15.9 ± 0.4bA | 16.1 ± 0.5bA | 17.9 ± 0.5aA | 18.1 ± 0.4aB | 15.9 ± 0.4aA | 15.5 ± 0.3aA | 14.9 ± 0.6abA | 14.0 ± 0.6bA |
| Butter paper | 15.9 ± 0.4bA | 16.5 ± 0.5bA | 18.2 ± 0.6aA | 19.3 ± 0.6aA | 15.9 ± 0.4aA | 15.0 ± 0.5abA | 14.9 ± 0.5abA | 13.9 ± 0.429bA | |
| Water activity (%) | Laminated foil | 0.73 ± 0.03aA | 0.72 ± 0.02aA | 0.73 ± 0.02aA | 0.75 ± 0.03aA | 0.73 ± 0.03aA | 0.71 ± 0.04aA | 0.70 ± 0.03aA | 0.69 ± 0.02aA |
| Butter paper | 0.73 ± 0.03aA | 0.73 ± 0.02aA | 0.75 ± 0.04aA | 0.76 ± 0.04aA | 0.73 ± 0.03aA | 0.71 ± 0.03aA | 0.70 ± 0.02aA | 0.69 ± 0.04aA | |
| Titratable acidity (% citric acid) | Laminated foil | 0.9 ± 0.0cA | 1.1 ± 0.0bA | 1.1 ± 0.0bA | 1.2 ± 0.0aB | 0.9 ± 0.0cA | 1.0 ± 0.0bA | 1.1 ± 0.0aB | 1.1 ± 0.0aA |
| Butter paper | 0.9 ± 0.0cA | 1.1 ± 0.0bA | 1.1 ± 0.0bA | 1.3 ± 0.0aA | 0.9 ± 0.0cA | 1.1 ± 0.0bA | 1.1 ± 0.0aA | 1.2 ± 0.0aA | |
| Total sugars (%) | Laminated foil | 42.2 ± 1.2bA | 46.5 ± 1.4bB | 67.9 ± 2.4aA | 69.2 ± 1.9aA | 42.2 ± 1.2bA | 44.7 ± 1.3bA | 60.9 ± 1.8aB | 62.1 ± 1.0aB |
| Butter paper | 42.2 ± 1.2cA | 50.1 ± 1.1bA | 69.9 ± 2.1aA | 71.6 ± 2.7aA | 42.2 ± 1.2bA | 44.8 ± 1.3bA | 66.8 ± 2.0aA | 67.8 ± 2.2aA | |
| Reducing sugars (%) | Laminated foil | 12.5 ± 0.7cA | 24.9 ± 0.5bB | 37.4 ± 1.0aA | 38.5 ± 0.9aA | 12.5 ± 0.7cA | 25.1 ± 0.7bA | 26.2 ± 0.5bB | 28.9 ± 1.3aA |
| Butter paper | 12.5 ± 0.7cA | 27.7 ± 0.9bA | 38.2 ± 1.2aA | 40.1 ± 1.2aA | 12.5 ± 0.7cA | 26.2 ± 0.6bA | 28.2 ± 0.9bA | 31.0 ± 0.9aA | |
| Phytochemical analysis | |||||||||
| Ascorbic acid (mg/100 g) | Laminated foil | 10.9 ± 0.5aA | 10.5 ± 0.4abA | 9.8 ± 0.3bA | 8.2 ± 0.4cA | 10.9 ± 0.5aA | 10.7 ± 0.4aA | 10.2 ± 0.3abA | 9.4 ± 0.3cA |
| Butter paper | 10.9 ± 0.5aA | 10.3 ± 0.4abA | 9.6 ± 0.4bA | 7.9 ± 0.3cA | 10.9 ± 0.5aA | 10.6 ± 0.5aA | 9.9 ± 0.3aA | 8.7 ± 0.3bB | |
| Total carotenoids (mg/100 g) | Laminated foil | 22.6 ± 0.5aA | 19.8 ± 0.5bA | 18.0 ± 0.4cA | 17.9 ± 0.7cA | 22.6 ± 0.5aA | 20.7 ± 0.6bA | 18.9 ± 0.7cA | 18.7 ± 0.7cA |
| Butter paper | 22.6 ± 0.5aA | 18.9 ± 0.7bA | 17.4 ± 0.5bcA | 17.2 ± 0.8cA | 22.6 ± 0.5aA | 20.6 ± 0.4bA | 18.0 ± 0.4cA | 17.8 ± 0.4cA | |
| Total phenols (mg GAE/100 g) | Laminated foil | 484.6 ± 7.9aA | 358.4 ± 3.4bA | 281.7 ± 4.8cA | 276.9 ± 7.4cA | 484.6 ± 7.9aA | 380.2 ± 7.4bA | 298.2 ± 8.1cA | 286.5 ± 5.7cA |
| Butter paper | 484.6 ± 7.9aA | 342.4 ± 4.5bB | 271.4 ± 5.5cA | 252.9 ± 8.9dB | 484.6 ± 7.9aA | 368.2 ± 8.4bA | 281.4 ± 6.1cB | 278.2 ± 3.9cA | |
| Antioxidant activity (mg TE/100 g) | Laminated foil | 174.9 ± 3.5aA | 147.9 ± 2.3bA | 115.6 ± 2.3cA | 110.7 ± 2.3cA | 174.9 ± 3.5aA | 161.6 ± 3.1bA | 126.8 ± 2.8cA | 118.3 ± 3.4dA |
| Butter paper | 174.9 ± 3.5aA | 132.2 ± 3.3bB | 110.5 ± 2.9cA | 104.9 ± 1.1cB | 174.9 ± 3.5aA | 149.7 ± 2.4bB | 117.3 ± 1.5cB | 110.6 ± 2.0dB | |
Mean ± standard deviation; n = 3; values with different uppercase alphabetical letters column wise and lowercase alphabetical letters row wise differ significantly (P < 0.05) within the packaging material and storage period, respectively.
The titratable acidity of formulated bars was remarkably (P < 0.05) influenced by the storage interval, irrespective of packaging materials and storage temperatures (Table 2). Initially, titratable acidity was 0.94% which increased to 1.26% and 1.15% at room and refrigerated temperatures indicating higher increase at room temperature storage. The reason behind this increment might be due to the breakdown of sugars into organic acids during storage. Likewise, Azmat et al. (2017) witnessed ~18.5% increase in the acidity of apple sucrose bars packed in polythene bags stored at room temperature.
An upsurge (P < 0.05) in total and reducing sugar content was noticed in pumpkin bars throughout the storage interval at both the temperatures, regardless of packaging materials. Total sugars increased by 66.93% and 53.99% at room and refrigerated temperature, respectively (Table 2) indicating higher increase at room temperature which might be due to the fast hydrolysis of starch and inversion of reducing sugars. Similar increasing trend was observed in reducing sugar content (Table 2). The hydrolysis of non-reducing sugars (sucrose) into reducing sugars might be the cause behind this rise in reducing sugars. The results of this study were consistent with the recent findings of Aggarwal et al. (2022) on kinnow fruit bar stored under both room and refrigerated conditions for a period of 6 months.
As shown in Table 3, all colour coordinates (L, a, and b values) of bars decreased significantly (P < 0.05) during storage at different temperatures while packaging materials showed statistically non-significant (P < 0.05) effect. L value decreased during storage; with maximum lightness retained under refrigeration compared to room temperature storage. A consistent decrease in a (redness) and b (yellowness) values was also witnessed during the entire storage period implying the occurrence of dull orange hue in the formulated bars. The variations in colour values may be sourced from oxidation along with non-enzymatic browning reactions occurring during storage (Muzzaffar et al., 2016; Azmat et al., 2017). The changes in colour values were more prominent during room temperature storage which corroborates with the findings of Maity et al. (2016) and Aggarwal et al. (2022). The bars packed in laminated film showed the least changes in colour attributes indicating least browning in the stored product compared to butter paper.
Influence of storage on the instrumental colour and textural properties of pumpkin bars
| Temperature | Room temperature | Refrigerated temperature | |||||||
|---|---|---|---|---|---|---|---|---|---|
| Storage period (months) | Packaging materials | 0 | 2 | 4 | 6 | 0 | 2 | 4 | 6 |
| Colour analysis | |||||||||
| L | Laminated foil | 38.9 ± 1.1aA | 36.3 ± 0.9bA | 35.9 ± 0.9bA | 34.6 ± 1.0bA | 38.9 ± 1.1aA | 38.7 ± 1.2aA | 37.2 ± 1.5aA | 36.4 ± 0.9aA |
| Butter paper | 38.9 ± 1.1aA | 36.2 ± 1.4abA | 34.1 ± 1.0bA | 33.0 ± 1.3bA | 38.9 ± 1.1aA | 37.6 ± 1.5abA | 35.2 ± 1.1bA | 34.6 ± 1.7bA | |
| a | Laminated foil | 3.8 ± 0.1aA | 2.7 ± 0.0bB | 0.4 ± 0.0cB | 0.2 ± 0.1cB | 3.8 ± 0.1aA | 1.6 ± 0.1bB | 1.4 ± 0.1bcA | 1.2 ± 0.1cA |
| Butter paper | 3.8 ± 0.1aA | 3.8 ± 0.1aA | 1.4 ± 0.1bA | 1.3 ± 0.1bA | 3.8 ± 0.1aA | 2.4 ± 0.1bA | 1.6 ± 0.1cA | 1.6 ± 0.2cA | |
| b | Laminated foil | 2.7 ± 0.1aA | 2.1 ± 0.2bA | 1.8 ± 0.1bcA | 1.9 ± 0.1cA | 2.7 ± 0.1aA | 1.6 ± 0.1bA | 1.3 ± 0.1cA | 1.7 ± 0.1bA |
| Butter paper | 2.7 ± 0.1aA | 1.9 ± 0.1bA | 1.4 ± 0.1cB | 0.97 ± 01dB | 2.7 ± 0.1aA | 1.5 ± 0.0bB | 1.4 ± 0.2bA | 1.3 ± 0.2bB | |
| Texture analysis | |||||||||
| Hardness (N) | Laminated foil | 181.8 ± 5.1aA | 177.3 ± 5.3aA | 170.4 ± 3.5abA | 162.1 ± 4.8bA | 181.8 ± 5.1cA | 195.4 ± 7.5cA | 218.3 ± 6.5bA | 239.4 ± 5.0aA |
| Butter paper | 181.8 ± 5.1aA | 170.1 ± 4.8abA | 159.5 ± 5.9bA | 143.3 ± 4.0cB | 181.8 ± 5.1cA | 196.7 ± 3.9cA | 222.8 ± 6.8bA | 255.4 ± 9.5aA | |
| Gumminess (N) | Laminated foil | 72.0 ± 3.1aA | 68.2 ± 2.0aA | 57.6 ± 1.7bA | 55.9 ± 2.2bA | 72.0 ± 3.1bA | 80.2 ± 2.4bA | 92.2 ± 4.4aA | 98.7 ± 5.5aA |
| Butter paper | 72.0 ± 3.1aA | 69.4 ± 2.5aA | 55.4 ± 1.1bA | 51.1 ± 2.5bA | 72.0 ± 3.1bA | 79.5 ± 3.9bA | 95.7 ± 3.8aA | 99.1 ± 3.1aA | |
| Chewiness (J) | Laminated foil | 28.9 ± 0.8aA | 28.6 ± 0.9aA | 27.9 ± 1.1aA | 20.7 ± 0.8bA | 28.9 ± 0.8cA | 30.3 ± 0.9cA | 42.1 ± 1.7bA | 48.6 ± 2.4aA |
| Butter paper | 28.9 ± 0.8aA | 28.0 ± 0.8abA | 26.1 ± 1.1bA | 19.1 ± 0.8cA | 28.9 ± 0.8cA | 29.0 ± 1.3cA | 44.3 ± 1.2bA | 49.9 ± 2.5aA | |
| Springiness (mm) | Laminated foil | 0.2 ± 0.01dA | 0.2 ± 0.01cB | 0.3 ± 0.0bA | 0.3 ± 0.01aA | 0.2 ± 0.01aA | 0.2 ± 0.01bA | 0.2 ± 0.00bA | 0.1 ± 0.01cA |
| Butter paper | 0.2 ± 0.01aA | 0.3 ± 0.00aA | 0.3 ± 0.01aA | 0.3 ± 0.11aA | 0.2 ± 0.01aA | 0.2 ± 0.00cdA | 0.2 ± 0.00cdB | 0.1 ± 0.01dB | |
| Cohesiveness | Laminated foil | 0.24 ± 0.01cA | 0.26 ± 0.01bcA | 0.28 ± 0.01abA | 0.30 ± 0.02aB | 0.24 ± 0.01aA | 0.22 ± 0.01aA | 0.20 ± 0.04aA | 0.19 ± 0.01aA |
| Butter paper | 0.24 ± 0.01cA | 0.28 ± 0.02bcA | 0.31 ± 0.02abA | 0.35 ± 0.02aA | 0.24 ± 0.01aA | 0.20 ± 0.02abA | 0.18 ± 0.01bA | 0.16 ± 0.02bA | |
Values are expressed as mean of three replications ± standard deviation; values with different uppercase alphabetical letters column wise and lowercase alphabetical letters row wise differ significantly (P < 0.05) within the packaging material and storage period, respectively.
During storage, packaging exerted a non-significant (P < 0.05) effect on the textural characteristics of the stored bars; however, storage interval showed a significant (P < 0.05) influence. Irrespective of the packaging materials, an increase in hardness was noticed during low-temperature storage, whereas room temperature resulted in a progressive decrease (Table 3). This variation in hardness could be attributed to variation in moisture content at respective storage temperatures. Springiness, measure of bounce back tendency of a food product after compression, increased during room temperature storage while a decrease was noticed under low-temperature conditions. Likewise, a similar pattern was observed in cohesiveness of stored bars (Table 3). Increased hardness during refrigeration storage might be the reason behind decreased elasticity and cohesiveness. On the other hand, gumminess and chewiness of the bars increased significantly (P < 0.05) during low-temperature storage, which could also be related to increased hardness and reduced moisture, signifying that higher energy is needed to masticate such products. However, opposite trend was noticed during room temperature storage making the bars comparatively soft and more chewable.
Phytochemical characteristics
Irrespective of packaging materials, a significant (P < 0.05) loss in the bioactive constituents of pumpkin bars was observed at both storage conditions (Table 2). The decrease in ascorbic acid can be ascribed to the oxidation of ascorbic acid into dehydroascorbic acid; however, highest retention under refrigeration might be connected to slow rate of oxidation at lower temperature (Singh et al., 2022a, 2022b). Following the similar pattern, a noticeable (P < 0.05) decrease was noticed in total carotenoids and phenolics in stored bars with the advancement of storage at both temperatures (Table 2). The results were in concordance with the findings of Dhiman et al. (2020) and Aggarwal et al. (2022) where the authors proposed the decrease in bioactive content of fruit bars due to oxidation and degradation. The antioxidant activity of pumpkin bar also decreased significantly during storage. The decline might be attributed to the loss in bioactive components including total phenols and carotenoids as proposed by Orrego et al. (2014) and Muzzaffar et al. (2016).
Although both the packaging materials exerted a noticeable (P < 0.05) effect on the phytochemicals content of bars during storage, maximum retention of phytochemicals and antioxidant activity was found in bars wrapped in laminated foil compared to butter paper.
Microbial and sensory analysis
Regardless of storage conditions and packaging materials, a noticeable increase was observed in the total plate count of the stored bars (Table S2). However, the values lay within the permissible limits given by Food Safety and Standard Authority of India for intermediate moisture foods (Aggarwal et al., 2022). No yeast or coliform counts were detected in any of the samples up to 6 months of storage. Therefore, the developed pumpkin bars packed in both packaging materials were considered shelf stable and microbiologically safe for 6 months at both the temperatures.
All the sensory attributes of pumpkin bar showed a declining trend during storage, irrespective of the packaging materials used and storage period. After 6 months, the panellists observed better retention of colour and flavour in refrigerated bars (Table S2). However, the texture of bars stored at room temperature was more acceptable than refrigerated bars. At the end of storage, bars stored at both the temperatures were acceptable with an overall acceptability score of more than 6, which is the minimum satisfactory score for organoleptic acceptability of any food product.
Conclusion
The study concluded that unrefined liquid jaggery may be utilised as a substitute for refined sugar to develop phytonutrient-rich products. In this study, a functional pumpkin-based fruit snack bar was formulated by replacing sugar with liquid jaggery at 0%–100% levels. Incorporation of jaggery in the bar considerably enhanced the mineral and bioactive profile of the product. Based on the sensory scores, the substitution of 50% jaggery in bars showed high consumer acceptability. Formulated nutritious bars packed in both laminated foil and butter paper showed satisfactory microbial and sensory quality during 6 months of storage under room and refrigerated conditions. Since liquid jaggery contains natural sugars, minerals and phytochemicals, it may be promoted to develop functional products that may help in maintaining good health in addition to acting as sweetener.
Author contributions
Gagandeep Kaur: Data curation (equal); formal analysis (equal); investigation (equal); methodology (equal); software (equal); validation (equal); writing – original draft (equal). Sukhpreet Kaur: Conceptualization (equal); data curation (equal); formal analysis (equal); funding acquisition (equal); project administration (equal); resources (equal); software (equal); supervision (equal); validation (equal); writing – original draft (equal); writing – review and editing (equal). Poonam Aggarwal: Funding acquisition (equal); resources (equal); validation (equal); visualization (equal); writing – review and editing (equal). Navjot Kaur: Formal analysis (equal); investigation (equal); software (equal); supervision (equal); validation (equal); visualization (equal); writing – original draft (equal); writing – review and editing (equal).
Conflict of interest
The authors declare no conflict of interest.
Funding
This research does not receive any funding.
Peer review
The peer review history for this article is available at https://www.webofscience.com/api/gateway/wos/peer-review/10.1111/ijfs.16681.
Data availability statement
Data related to the article are present in supplementary file.
