


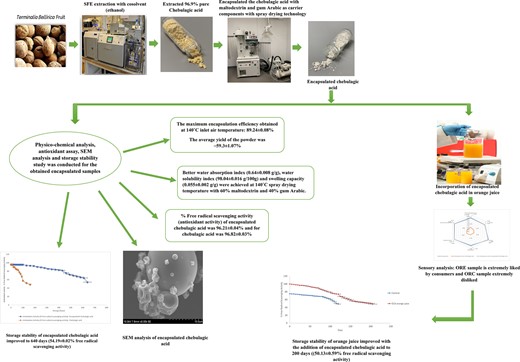
Abstract
Chebulagic acid (CA), found in beleric (Terminalia bellirica) fruit powder, has various biological activities. This study aims to encapsulate CA to overcome its solubility, astringency and bitter taste issues and determine its properties. The encapsulated chebulagic acid (ECA) was incorporated into orange juice (OR), and a storage stability study at ambient temperature (25 ± 2 °C) and sensory analysis using a 9-point hedonic scale were conducted. The highest encapsulation efficiency (89.24% ± 0.08%), antioxidant activity (96.82% ± 0.03%) and considerable powder yield (~59.3% ± 1.07%) with better water absorption index (0.64 ± 0.008 g/g), water solubility index (98.04 ± 0.016/100 g) and swelling capacity (0.055 ± 0.002 g/g) were achieved at 140 °C spray drying temperature with 60% maltodextrin and 40% gum Arabic. At the ambient storage conditions (25 ± 2 °C), the storage stability of ECA was 640 days (54.19% ± 0.02%), CA was 130 days (52.46% ± 0.14%) and the addition of ECA increased the OR's storage stability to 200 days (50.13% ± 0.59%) with respect to the antioxidant activity. From the sensory evaluation, the OR and OR added with 0.2 g/100 mL ECA samples were preferred by the 100 panellists and liked immensely. Overall, the encapsulation of CA successfully masked the astringency and bitterness, improving the CA's stability and increasing the orange juice's storage stability with more consumer acceptability.
Introduction
Chebulagic acid (CA) is a hydrolysable tannin with antioxidant activity found in terminalia species, particularly Terminalia chebula, Terminalia bellirica and Terminalia arjuna. It has been extensively used in folk and herbal medicine systems and has shown various pharmacological activities, including a strong anti-inflammatory effect on macrophages stimulated by Lipopolysaccharide (LPS). This effect is achieved by obstructing the activation of NF-κB and MAPK phosphorylation (Reddy et al., 2009). In addition to its advantages, CA has certain disadvantages, such as its limited absorption and astringent, bitter taste. As a result, this limited its application in the production of functional foods. In this research, CA was extracted from Terminalia bellirica (Gokhale et al., 2003).
The effectiveness of CA is significantly influenced by its integrity and bioavailability, which are restricted by factors such as low permeability, inadequate gastric residence time, low aqueous solubility and instability during production, storage, distribution or passage through the gastrointestinal tract (Munin & Edwards-Levy, 2011). Furthermore, CA extracted from a natural source (Terminalia myrobalans) in its freeform exhibits limited water solubility, and its astringent and bitter taste must be masked before incorporating it into food products (Dschaak et al., 2011).
To overcome these challenges, the development of a finished protective product is necessary to preserve the structural integrity of CA until consumption, mask the bitter taste, enhance its water solubility and bioavailability and ensure its targeted delivery to a specific physiological target. A previous study in 2011, have suggested that the utilisation of microencapsulation techniques could potentially address these concerns and decrease or mask the adverse effects of bioactive compounds in food (Munin & Edwards-Levy, 2011). Fang & Bhandari (2010) observed that utilising encapsulated extracts rather than raw products could address issues such as astringency, unpleasant bitter taste and product instability while simultaneously enhancing the bioavailability of the compounds at the desired site.
Even though multiple encapsulation techniques that can be utilised for food processing, spray-drying is the most frequently employed technology within the food industry. It is flexible, continuous and crucially, an inexpensive and efficient means of protecting materials (Poshadri & Aparna, 2010). In this process, CA is combined with carrier materials such as maltodextrin and gum Arabic. Maltodextrins, with varying degrees of hydrolysis indicated by their dextrose equivalent (DE), offer protection against oxidation, while gum Arabic provides emulsifying properties. The combination of maltodextrin and gum Arabic has shown promising results in terms of retention during drying and efficient microencapsulation (Poshadri & Aparna, 2010; Mulcahy et al., 2016). By utilising spray-drying, high-quality microcapsules of CA can be produced with a particle size below 40 μm, ensuring sensory and textural qualities in the end products.
The current study utilised the spray drying technique to encapsulate CA, in which gum Arabic and maltodextrin were used as carrier components. Different processing temperatures and carrier material concentration combinations were employed to encapsulate CA. The research focused on evaluating extraction yield, encapsulation efficiency, antioxidant activity, storage stability and physico-chemical properties of the microcapsules. The release of CA from the microcapsules in simulated gastrointestinal fluids was also investigated. Additionally, the study examined the stability and sensory properties of orange juice containing encapsulated CA, conducting a sensory evaluation with 100 untrained panellists to assess its overall acceptability.
Experimental procedure
Materials
Beleric (Terminalia bellirica) fruit powder was acquired from the Fornix Healthy Living Store in Malaysia, while the standard of CA with ≥98% purity (crystalline solid, source: Terminalia chebula plant) was procured commercially from Cayman Chemicals in Singapore. Sigma Aldrich (Malaysia) was the supplier of several materials, including maltodextrin and gum Arabic (acacia powder), ethanol and 1,1-diphenyl-2-picrylhydrazyl (DPPH). In addition, orange juice (Tropicana-twister) was purchased from the local market in Bandar Sunway city, Malaysia.
Extraction of CA from beleric (Terminalia bellirica) fruit powder using supercritical fluid
The procedure for extraction was adopted from the research carried out by Guggilla et al. (2022). In each sample vessel of the supercritical fluid extractor equipment (MV-10 ASFE System Model, Waters, Malaysia), 5 g (±0.05 g) of beleric (Terminalia bellirica) fruit powder was placed. To extract CA, CO2 and 50% (v/v) cosolvent (ethanol) were employed, under specific conditions of 60 °C temperature and 20 MPa pressure. At 22 min, the extract fraction was collected, and the remaining cosolvent was removed using a rotary evaporator. The extract was allowed to reach room temperature (23 ± 2 °C) before being weighed precisely using an analytical balance (±0.0001 g) to evaluate the extract yield (Shadab, 2019). The identification and measurement of the CA from the beleric (Terminalia bellirica) extract were accomplished through high-performance liquid chromatography analysis (HPLC).
CA encapsulation using a spray dryer
The CA was encapsulated with a Mini Spray Dryer SD-1500 model (Manufacturer: Buchi) using gum Arabic and maltodextrin as carrier material. The experimental methodology was derived from a previous investigation with few adjustments (Sudip et al., 2016). For the encapsulation of CA, a solution comprising maltodextrin and gum Arabic in varying proportions of 50:50, 60:40 and 70:30 (v/v) was utilised. Maltodextrin solutions with different concentrations (50%, 60%, 70% (w/v)) were prepared in water (100 mL each) and placed in a water bath (70 rpm agitation and 27 °C temperature) overnight. Gum Arabic solution was prepared 2 h prior to encapsulation and was mixed using a magnetic stirrer at 1250 rpm. After coating solutions were prepared, 60% CA was incorporated into a 40% carrier material solution. The feed (carrier materials and CA) was produced by blending the solution for 5 min using a portable homogeniser. This feed solution was then mixed continuously using a stirrer and processed via a peristaltic feeder in the spray drying chamber. The prepared solution was pneumatically atomised through a nozzle having 0.7 mm diameter, and the spray dryer was operated using compressed air and varied processing temperatures (120, 140 and 160 °C) in co-current mode. The resulting spray-dried particles were weighed and stored in airtight glass containers at 10 ± 2 °C for further tests.
The encapsulation yield (EY) was determined using the equation presented below (Su et al., 2008).
where Wm represents the weight of the microcapsules and Wi represents the initial weight of the feed.
Characterisation of encapsulated chebulagic acid (ECA)
For the quantification of CA, the CA was extracted from the encapsulates following the slightly modified version of the procedure outlined by Sudip et al. (2016). First, 2 g of the ECA was measured precisely and mixed with methanol (10 mL). Then the mixture was shaken using vortex for 1 min, then treated with ultrasonication (VCX750 Ultrasonic Liquid Processor, Model: CV334 and enclosure, Sonics) at 5 kHz for 30 min, followed by the centrifugation at 3500 rpm for 10 min and thereafter filtered.
The obtained supernatant solution was analysed for CA content using HPLC, as well as for its antioxidant activity using the DPPH assay. The encapsulated powder with the maximum encapsulation yield, CA content and antioxidant activity was chosen as the most suitable encapsulate to be further used for food application.
The encapsulation efficiency (EE) of the ECA was determined using the following formula (Sudip et al., 2016):
Evaluation of antioxidant activity
The DPPH assay was used to measure the antioxidant activity following a modified method based on Maruf et al. (2009). To perform the assay, the CA extracted from the encapsulates was diluted with methanol (1:10), and mixed with a 0.1 mmol L−1 of DPPH solution. The sample was agitated and incubated for 30 min. The absorbance was measured at 517 nm. The percentage of free radical scavenging activity was determined using the proposed formula:
Colour analysis
The colour values of the ECA were evaluated following the method outlined by El-Messery et al. (2019). The Hunter colour system was employed to measure the Hunter colour values (L*, a* and b*) using a Colorflex Spectrophotometry instrument (Model: ColorFlex EZ, Manufacturer: Hunterlab, Malaysia). The L* value shows the degree of lightness of the sample, while the a* value shows the degree of greenness or redness, and the b* value shows the level of blueness or yellowness.
Evaluation of moisture content and determination of water activity
The AOAC method (AOAC, 2000) was utilised to determine the moisture content. Approximately 2–3 g of the sample were weighed in preweighed crucible and dried in a 105 °C oven until a constant weight was achieved. The moisture content was calculated as the percentage of weight loss compared to the initial weight of the sample. The water activity (aw) of the ECA was measured at a temperature of 25 °C, utilising a water activity meter (Tolve et al., 2021). A 5 g of the sample was placed in the sample cell of the water activity meter, and the instrument provides the water activity value based on the equilibrated conditions. This measurement helps evaluate the water availability and microbial stability of the ECA.
Determination of water absorption index (WAI), water solubility index (WSI) and swelling capacity (SWC)
Maruf et al. (2009) method was followed to determine WSI, WAI and SWC. The procedure involved mixing 1 g of the sample with 12 mL of water and placing it in a water bath at a temperature of 30°C for 30 min. Subsequently, the sample was centrifuged at 3600 rpm for 15 min, and the resulting supernatant was transferred to a glass petri dish and proceeded to dry at a temperature of 105°C. The WSI and WAI values were then determined using the following formula:
Glass transition temperature analysis using differential scanning calorimetry (DSC)
With few modifications, the methodology proposed by Ferreira et al. (2022) and Gabriel et al. (2015) was used to perform differential scanning calorimetry (DSC) measurements of the obtained samples. The DSC 4000 equipment from Perkin Elmer with a cooling device was utilised for these measurements. The samples, weighing approximately 6–10 mg, were weighed in aluminium sample pans, and an empty aluminium sample pan was taken as a reference material. The experiment was carried out from 30 to 300 °C temperature heating rate of 10 °C per minute at 30 to 300 °C temperature range.
Sample analysis by Fourier transform infrared (FTIR) spectroscopy
The Fourier-transform infrared spectroscopy (FTIR) (Model: Spectrum Two; Manufacturer: Perkin Elmer) was utilised to obtain the spectra of CA, standard CA, encapsulating agent and best ECA obtained at 140 °C with 60:40 carrier material ratio. The analysis was carried out in attenuated total reflectance mode (ATR) with a spectral resolution of 4 cm−1 within the range from 400 to 4000 cm−1 (Fatma & Mohamed, 2017).
Analysis of sample morphology using scanning electron microscope (SEM)
The structure of the outer encapsulate was studied by scanning electron microscope (SEM). A sputter coater was used to apply a layer of gold onto the sample, and the sample was then viewed using the variable pressure-scanning electron microscope equipment (VP-SEM) (Hitachi S3400N-II) with a working distance of 7.8 mm, a magnification of 500×, 1000×, 5000× and an operating voltage of 10 kV.
In vitro gastrointestinal digestion
The ECA under simulated gastric and intestinal fluids was used in this research study. The method was adopted from the previous study conducted by Nuray & Saliha (2020) with few modifications. The simulated gastric fluid (SGF) similar to the human body was prepared by using a mixture of NaCl and pepsin weighing 2 and 3.2 g, added to HCl (7 mL) and water (1 L) to maintain a pH of 1.2. A 50 mg of ECA was mixed with SGF of 0.7 mL quantity in a glass beaker (20 mL) while agitating at 80 ± 1 rpm and incubated at 37 °C ± 1 for 121 ± 1 min. The obtained supernatant was cooled down to ambient temperature and 0.2 M sodium hydroxide solution was added to it (Nuray & Saliha, 2020).
Similarly, simulated intestinal fluid (SIF) was prepared by dissolving a potassium dihydrogen phosphate of 6.8 g quantity in 250 mL of distilled water. A 77 mL of 0.2 M NaOH was added to the distilled water (500 mL) along with pancreatin (10 g). After changing the pH to 6.8, 50 mg of ECA was mixed with SIF (1.2 mL) in a glass beaker and placed in 37 °C incubator for 121 ± 1 min. The obtained solution was filtered, and the pH was changed to 1.2 with 3 M HCl. Finally, HPLC was used to detect CA released into the solution media (Nuray & Saliha, 2020).
Storage stability study of the ECA
The storage stability study determined the storage stabilities of CA and ECA with respect to their antioxidant activity. The samples were placed at ambient temperature (25 ± 2 °C), and their antioxidant activities were determined at fixed time intervals (10 days) for 640 days, in accordance with the method published by Sudip et al. (2016).
Incorporation of ECA in a food product (orange juice)
Orange juice was purchased from the local market of Malaysia. The orange juice was incorporated with the ECA (0.2 g/100 mL) at 75 °C with continuous stirring using a magnetic stirrer for 30 min of time. The orange juice (OR), orange juice with CA (ORC) and orange juice with ECA (ORE) were packed and stored in 100 mL PET bottles at 4 ± 2 °C for further tests.
Stability study of OR and ORE samples (25 ± 2 °C)
Physicochemical properties analysis of orange juice samples
The pH of the orange juice samples was measured at regular intervals during the storage study at ambient temperature using a pH meter. According to the method outlined by El-Messery et al. (2019), colour values were determined. The colour attributes (L*, a* and b*) were evaluated using colourflex spectrophotometry (Model: ColorFlex EZ, Manufacturer: Hunterlab). The redness/greenness (−a*, +a*), lightness (L*) and yellowness/blueness (−b*, +b*) of the samples were assessed.
Antioxidant activity
The samples for the antioxidant activity assay were determined using the methodology outlined by Gonzalez-Molina et al. (2009) with few changes. Orange juice samples were centrifuged at 10000 rpm for 11 min and then filtered using a filter (0.45 μm nylon) prior to the assay.
The DPPH assay was adopted to determine the antioxidant capacity, with some changes to the procedure reported by Maruf et al. (2009). A 2 mL of the sample was mixed with 0.1 mmol L−1 of DPPH solution. After vigorous shaking, the mixture was placed undisturbed for 30 min, and then the absorbance was assessed at a wavelength of 517 nm.
Sensory evaluation
Following the standard UNI EN ISO 13299:2010, 100 untrained panellists were recruited based on the international standard ISO 8586:2012. A signed consent form was obtained from the recruited panellists (ethical approval ID: 22620). According to the procedure, a 9-point hedonic scale was used to quantify the sensory attributes, where a rating of nine corresponds to ‘extremely good quality’, while ratings of 8–7 designated as ‘good quality’, and a rating of 6 was considered as ‘moderate quality’. An acceptability threshold was set at a score of 5, whereas a score of 4–1 was classified as ‘unacceptable quality’.
The statistical analysis
The experiments were performed in triplicates (n = 3). The obtained data were presented as the average value along with the standard deviation (SD). To evaluate the statistical significance, a one-way analysis of variance (Anova) was performed. A significance level of 5% (P < 0.05) was used to define the significance of any observed differences.
Results & discussion
Extraction of CA
In the context of our investigation on the encapsulation of chebulagic acid, we acquired 96.9% ± 3.34% (w/w) CA using the supercritical fluid extraction method with a 50% (v/v) co-solvent, as previously reported by Guggilla et al. (2022).
Encapsulation of CA
The yield of the encapsulate
From Table 1 the yield of the spray-dried encapsulated CA under varied encapsulation conditions is observed. The encapsulation yield was significantly influenced by the maltodextrin concentration in the coating materials and processing (inlet air) temperature. An interacting effect was also observed between these two factors. Increasing the processing (inlet air) temperature and maltodextrin concentration (%) while decreasing the percentage of gum Arabic in the coating material increased the yield. Approximately a yield of 59.3% of the powder was obtained, similar to previous studies conducted by Chatterjee et al. (2014) and other researchers. Based on Table 1, the highest yield was gained at 160 °C processing (inlet air) temperature. Due to the insufficient drying at low processing (inlet air) temperature, the sample could not be dried efficiently, resulting in some residual water in the sample. This caused the wet product to adhere to the drying chamber wall and ultimately resulting in a low yield (Su et al., 2008). According to Su et al. (2008), the yield increases further with increasing temperature until an optimal point is achieved. This is because, once the optimal temperature is surpassed, there may be an imbalance between the film formation and rate of water evaporation, leading the encapsulated product to rupture, which in turn, can cause the accumulation of ruptured microcapsules at the chamber wall and contribute to further decrease in the yield. The decrease in yield with a further increase in temperature, however, was not observed in the current study. Decreasing the concentration of maltodextrin from 70% to 50% and increasing gum Arabic from 30% to 50%; increased the yield initially but then decreased subsequently. Such a detrimental impact may have been caused probably due to an increase in feed viscosity, which likely occurred due to a simultaneous decreasing maltodextrin concentration and increasing gum Arabic concentration. A higher feed viscosity can cause a larger amount of solids to stick to the main chamber wall due to an increased solid content in contact with the wall. This can result in a decrease in yield (Krishnaiah et al., 2009). The findings are consistent with those of other researchers who have reported that a 60% maltodextrin concentration was the better choice to obtain an effective encapsulation yield (Sudip et al., 2016).
Yield, encapsulation efficiency, % free radical scavenging activity of CA spray-dried under different conditions
| Concentration of maltodextrin (%) | Concentration of gum Arabic (%) | Processing (Inlet air) temperature (°C) | Yield of the powder (%) | Encapsulation efficiency (%) | % Free radical scavenging activity |
|---|---|---|---|---|---|
| 70 | 30 | 120 | 43.2 ± 1.01c | 69.29 ± 0.08b | 81.32 ± 0.09c |
| 140 | 50.2 ± 1.11b | 71.55 ± 0.03b | 90.89 ± 0.07b | ||
| 160 | 51.1 ± 1.12b | 66.46 ± 0.04c | 91.72 ± 0.05b | ||
| 60 | 40 | 120 | 44.5 ± 1.06c | 72.21 ± 0.05b | 91.81 ± 0.08b |
| 140 | 50.1 ± 1.18b | 89.24 ± 0.08a | 96.21 ± 0.04a | ||
| 160 | 59.3 ± 1.07a | 62.63 ± 0.07c | 85.39 ± 0.07c | ||
| 50 | 50 | 120 | 27.5 ± 1.02d | 55.53 ± 0.04d | 71.53 ± 0.05d |
| 140 | 44.5 ± 1.07c | 69.48 ± 0.03b | 85.55 ± 0.03c | ||
| 160 | 50.5 ± 1.06b | 50.87 ± 0.05d | 78.92 ± 0.07c,d | ||
| Control sample (CA) | – | – | – | 96.82 ± 0.03a | |
The presented data are the mean ± SD of the three experimental runs (n = 3) of the spray drying process. (a–d) Values with different superscript letters within the same column are significantly different (P < 0.05).
Encapsulation efficiency
In this work, the maximum encapsulation efficiency of 89.24% was observed at 140 °C processing temperature, 60% of maltodextrin concentration and 40% gum Arabic concentration (Table 1). From Table 1, a significant effect of carrier material concentration and processing temperature was observed on the efficiency. The increase in the efficiency was observed with increasing processing temperature from 120 to 140 °C and a decrease at 160 °C was observed, possibly because of the thermal sensitivity. When we consider the maltodextrin concentration, the encapsulation efficiency increased with increasing the maltodextrin concentration from 50% to 60% but decreased at 70% maltodextrin concentration. Similar results were reported in the study conducted by Sudip et al. (2016). According to Luiz et al. (2019), encapsulation efficiency is affected by variables like emulsion, bioactive compound attributes, drying and carrier material parameters.
The processing temperature is directly related to the evaporation rate and the final water content of the encapsulates is inversely related. Therefore, higher drying temperatures can cause the droplet surface to dry faster, accelerating a semipermeable membrane formation. This, in turn, helps protect the release of CA during the drying process, resulting in CA retention. However, there is a risk that higher drying temperatures could cause surface fissures and cracks, which could result in the loss of CA (Luiz et al., 2019).
The carrier material concentration in the feed solution also has an impact on the encapsulation efficiency due to its feed viscosity. Few researchers have reported that the carrier material concentration positively impacts the encapsulation efficiency, as it increases the feed solution's solids content and thereby enhances bioactive retention (Luiz et al., 2019). This phenomenon may be attributed to the time reduction required for a surface crust to develop on the small droplets during the initial drying stage. The crust formed is impermeable protecting it from oxidation.
However, during the encapsulation process, the formation of distinct particles is hindered by high viscosity in feed solutions, while low viscosity delays their formation. This results in the loss of the desired compound (CA) (Luiz et al., 2019). Therefore, the optimal parameters for the carrier material will depend on the viscosity and solubility of the liquid mixture, to ensure maximum encapsulation efficiency.
Antioxidant activity of the encapsulate
The antioxidant activity of the obtained encapsulated products was significantly affected by maltodextrin concentration and temperature (Table 1). The results of this study show that as the maltodextrin concentration increased from 50% to 60%, the percentage of DPPH radical scavenging activity also increased. However, at 70% maltodextrin concentration, the antioxidant activity decreased. At varied processing temperatures, the highest antioxidant activity was measured at 140 °C, followed by 120 and 160 °C (Table 1). During the encapsulation process, to achieve both the production of microparticles and the retention of high antioxidant content, the drying temperature must be optimised. It is essential to ensure that the drying temperature is adequate for the encapsulate formation, while also preventing the degradation of antioxidative compounds and loss of volatile compounds that can occur at higher drying temperatures (Krishnaiah et al., 2009). However, the impact of temperature on the sample's relative antioxidant activity could be attributed to variations in stability or antioxidant strength at different temperatures (Krishnaiah et al., 2009). The percentage-free radical scavenging activity of 96.21% was found at 140 °C processing temperature and maltodextrin concentration of 60%, with gum Arabic concentration of 40%, similar to that of CA (96.82%). The obtained results agree with the research conducted by Sudip et al. (2016).
Colour analysis (hunter) test
The Hunter values (L*, a* and b*) of ECA at different encapsulation conditions compared with CA and maltodextrin-gum Arabic samples were measured (Table 2). ECA samples obtained at different encapsulation conditions had higher L* values than the CA sample, indicating the increase in the lightness of the CA with the encapsulation process. These findings were similar to that of Grabowski et al. (2006). The a* and b* values of all the ECA samples and maltodextrin-gum Arabic samples (MD+GA) (carrier materials samples) were lower than the CA sample, both of which were used as controls in this study. For the CA sample, the positive a* value indicates the redness in the sample, whereas, in the encapsulated samples, the a* value is negative, indicating the sample's greenness (Table 2).
Hunter colour analysis of the ECA samples under different encapsulation conditions, CA and maltodextrin-gum Arabic sample (MG + GA)
| Sample | Processing (Inlet air) temperature (°C) | L* | a* | b* | |
|---|---|---|---|---|---|
| Concentration of maltodextrin (%) | Concentration of gum Arabic (%) | ||||
| 50 | 50 | 120 | 89.93 ± 0.01f | −0.94 ± 0.02c | 5.72 ± 0.03e |
| 50 | 50 | 140 | 89.16 ± 0.01f | −0.98 ± 0.01c | 5.94 ± 0.01d,e |
| 50 | 50 | 160 | 89.87 ± 0.01f | −0.91 ± 0.01c | 6.01 ± 0.02d |
| 60 | 40 | 120 | 93.62 ± 0.01d | −1.02 ± 0.01c | 6.50 ± 0.03d |
| 60 | 40 | 140 | 93.92 ± 0.01d | −0.99 ± 0.01c | 5.71 ± 0.01e |
| 60 | 40 | 160 | 93.03 ± 0.01d | −1.00 ± 0.01c | 5.03 ± 0.02e,f |
| 70 | 30 | 120 | 90.98 ± 0.01e | −1.08 ± 0.02c | 4.86 ± 0.04f |
| 70 | 30 | 140 | 90.81 ± 0.01e | −1.08 ± 0.02c | 4.78 ± 0.03f |
| 70 | 30 | 160 | 90.63 ± 0.01e,f | −1.09 ± 0.02c | 4.85 ± 0.02f |
| MD + GA | NA | 94.57 ± 0.01c | −0.08 ± 0.01e | 3.21 ± 0.01g | |
| CA | NA | 69.11 ± 0.01g | 0.16 ± 0.01d | 35.67 ± 0.02c | |
a*, Green/Red value; b*, Yellow/Blue value; L*, Lightness.
L* scale shows light colour vs. dark colour, where a value between 0 and 50 indicates dark colour and values between 51 and 100 represents light colour.
a* scale shows red colour vs. green colour, where positive numbers of ‘a’ value indicates redness of the sample and negative value of ‘a’ parameter indicates the presence of green colour in the sample.
b* scale shows yellow colour vs. blue colour, where positive number of ‘b’ parameter indicates the presence of the yellow colour, whereas, negative number of ‘b’ parameter indicates the presence of blue colour.
Therefore, each scale's L* value indicates the level of lightness or darkness, a* value shows redness or greenness and the b* value shows yellowness or blueness. All three values are required to describe an object's colour completely. (c–g)Values with different superscript letters within the same column are significantly different (P < 0.05).
Similarly, the b* value indicates yellow colour in the sample is high in CA compared to the ECA samples (Table 2). All the encapsulated samples showed high L* values compared to the CA sample. However, the ECA obtained at a processing temperature of 140 °C with 60% maltodextrin, and 40% gum arabic concentration showed a slightly higher L* value compared to samples encapsulated under other conditions. In the current study, the ECA obtained at processing (inlet air) temperature 140 °C with 60% maltodextrin, and 40% gum Arabic shows improved lightness compared to the other samples. The obtained results show that the encapsulation successfully improved appearance, that is, improved the lightness (white colour) of the CA, leading to the enhanced appearance attribute, which could be desirable when added to food products.
Moisture content and water activity of the encapsulate
Moisture content and water activity (aw) are essential properties of encapsulated products obtained from spray drying technology as they affect shelf-life, stability and agglomeration. Moisture content values below 5% suggest improved shelf-life and stability of food products. Lower moisture content and water activity values are associated with enhanced storage stability. Conversely, food products with moisture content and water activity exceeding 20% and 0.60 aw are prone to deterioration caused by yeasts and moulds. The observed results also indicate that the operating parameters used in drying were sufficient for the evaporation of water. The moisture content of ECA was less than 3% in all the obtained encapsulated products, meeting the standard moisture content requirements of the powdered food products (<4%) and suitable for longer storage (Tolve et al., 2021). The moisture content of ECA samples ranging from 2.04% ± 0.02% to 2.84% ± 0.04%. In addition, the aw ranging from 0.22 to 0.34; these values suggest that ECA has good stability against microbial contamination (Tolve et al., 2021). This result suggests that the microparticle may have a longer storage stability as the product does not have water available for the occurrence of enzymatic reactions and for microbial growth. Similar results were observed in the study conducted by Ferreira et al. (2022).
WSI, WAI and SWC of encapsulate
The WSI, WAI and SWC of ECA samples are shown in Table 3. The increased maltodextrin and decreased gum Arabic concentrations resulted in increased WAI and WSI. Similar results were observed in the research conducted by Maruf et al. (2009). The addition of maltodextrin, along with gum Arabic, alters particles' surface stickiness due to its ability to transition to a glassy state (Maruf et al., 2009). However, maltodextrin and gum Arabic did not significantly affect the SWC of the ECA samples. A reduced swelling capacity arises from a high number of crystallites, increasing the stability and thereby reducing the swelling of the granules. However, when starch is gelatinised at a given temperature, the molecular structure of the granules is disrupted, leading to stronger interactions between starch and water. This results in a significant increase in swelling (Maruf et al., 2009). The findings indicated that higher WSI, WAI and SWC were observed in ECA obtained at a processing temperature of 140 °C and a maltodextrin concentration of 60%, 40% of gum Arabic concentration.
Water solubility index (WSI), water absorption index (WAI) and swelling capacity (SWC) of the ECA samples at different temperature conditions
| Concentration of maltodextrin (%) | Concentration of gum Arabic (%) | Processing (Inlet air) temperature (°C) | WSI (g/100 g dry solids) | WAI (g/g dry solids) | SC (g/g dry solids) |
|---|---|---|---|---|---|
| 70 | 30 | 120 | 84.31 ± 0.024b,c | 0.43 ± 0.016c | 0.054 ± 0.002a |
| 140 | 88.93 ± 0.024b | 0.59 ± 0.008b | 0.053 ± 0.001a | ||
| 160 | 80.66 ± 0.017c | 0.39 ± 0.008c | 0.055 ± 0.001a | ||
| 60 | 40 | 120 | 76.29 ± 0.016d,e | 0.40 ± 0.008c | 0.054 ± 0.001a |
| 140 | 98.04 ± 0.016a | 0.64 ± 0.008a | 0.055 ± 0.002a | ||
| 160 | 78.99 ± 0.012d | 0.36 ± 0.016c,d | 0.052 ± 0.001a | ||
| 50 | 50 | 120 | 68.02 ± 0.031e,f | 0.39 ± 0.008c | 0.035 ± 0.002c |
| 140 | 71.97 ± 0.025e | 0.42 ± 0.008c | 0.042 ± 0.001b | ||
| 160 | 62.53 ± 0.02f | 0.33 ± 0.008d | 0.039 ± 0.001b,c |
Data are the mean ± SD of the three experimental runs (n = 3) of spray drying. (a–f) values with different superscript letters within the same column are significantly different (P < 0.05).
DSC of encapsulate and materials
Glass transition temperature (Tg) is a vital parameter in the spray drying technique as this property is strongly associated with the adhesion and agglomeration of the material within the drying chamber (Gabriel et al., 2015). Different authors (Gabriel et al., 2015; Ferreira et al., 2022) mentioned that material sticking during processing is likely to occur when the working temperatures exceed the material's Tg by 20 °C. Table 4 shows the Tg of CA, maltodextrin and gum Arabic and ECA. From the results, it can be observed that the maltodextrin showed an endothermic peak at 205.80 °C with an onset at 200.19 °C and an endpoint at 221.71 °C, corresponding to the Tg. Similarly, Pashazadeh et al. (2021) have observed a Tg of 155.34 °C for maltodextrin.
Glass transition temperatures of CA, maltodextrin and gum Arabic, ECA
| Products | Glass transition temperatures (°C) | ||
|---|---|---|---|
| Onset | Peak | End | |
| CA | 130.97 ± 0.44a | 152.64 ± 0.47b | 190.37 ± 0.43e |
| Maltodextrin and gum Arabic | 200.52 ± 0.47g | 205.46 ± 0.46g,h | 221.36 ± 0.46i |
| ECA | 173.69 ± 0.45c | 177.73 ± 0.47c,d | 194.54 ± 0.46e,f |
Data are the mean ± SD of the three experimental runs (n = 3) of spray drying. (a–i) values with different superscript letters within the same column are significantly different (P < 0.05).
As can be observed, the ECAs' Tg was found to be similar to the value of the maltodextrin and gum Arabic (encapsulating material), indicating that the encapsulation process is successful. However, it was noted that after spray-drying, the partial disappearance of the thermal events was observed with a lower Tg of 177.73 °C, respectively, when compared with the carrier material. This observation suggests that the CA integrated the carrier material to form composite structures and possible interaction between compounds that could have influenced the Tg (Gabriel et al., 2015). Regarding the CA, the glass transition temperature of the encapsulated product (177.73 °C) (Fig. 1b) was higher than the value of the Tg of the CA (151.97 °C) (Fig. 1a). The increase in Tg of encapsulated product might have resulted due to the usage of spray drying for encapsulation which contributed in the formation of a more stable matrix compared to the chebulagic acid (Gabriel et al., 2015).
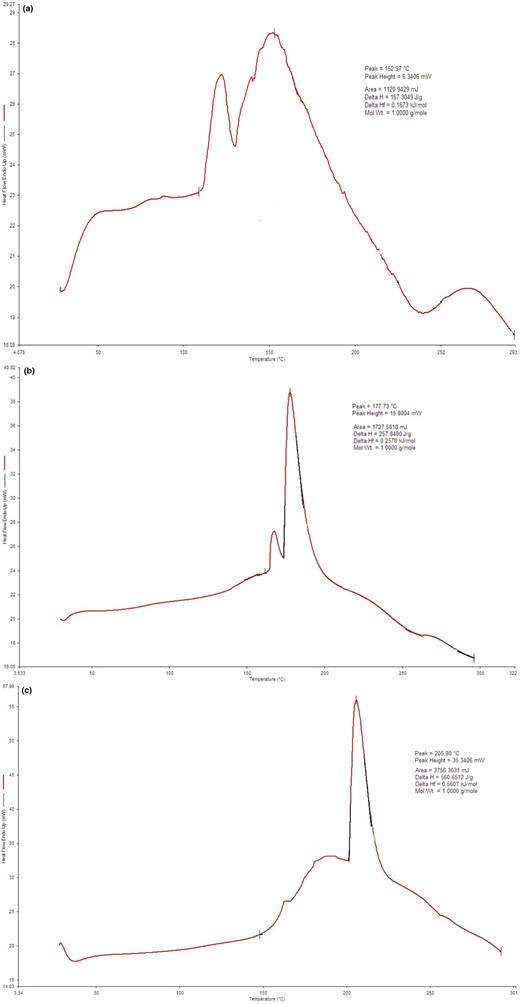
(a) DSC thermogram of CA. (b) DSC thermogram of ECA. (c) DSC thermogram of MD+GA.
FTIR analysis
The FTIR spectra of ECA obtained using a spray-drying processing temperature of 140 °C showed several significant peaks (Fig. 2a–d). The FTIR spectra were in 400–4000 cm−1 frequency for the carrier material and ECA. The peaks identified at the frequency range 1600–1650 cm−1 were related to C=C or C–C bonds, while the spectra at 1075 cm−1 were observed to be the C–O–C or C–O bonds. The bonds associated with carbohydrates of maltodextrin and CA were found at a frequency range of 1400–1300 cm−1, including –CH, –CH2 and = CH bonds. The carbonyl group stretch was observed at 1706 cm−1. The peaks observed at 1610, 1533 and 1516 cm−1 indicated C=C–C vibrations and peaks at 1446 and 1325 cm−1 indicated C–H bending vibration, while 1315 and 1202 cm−1 were assigned to C–O ester linkage stretching and peaks observed at 1153 and 1075 cm−1 were due to the in-plane bending of the aromatic C–H linkage. Peaks at 867, 871, 836, 760, 706, 574, 524 and 435 cm−1 are attributed to aromatic C–H out-plane bending (Gabriel et al., 2015; Fatma & Mohamed, 2017; Pashazadeh et al., 2021). The FTIR spectra showed similar peaks for the carrier material, CA and ECA, indicating that the carrier materials successfully encapsulated the CA. Similar results were reported in the phenolic compounds encapsulation research conducted by Pashazadeh et al. (2021).
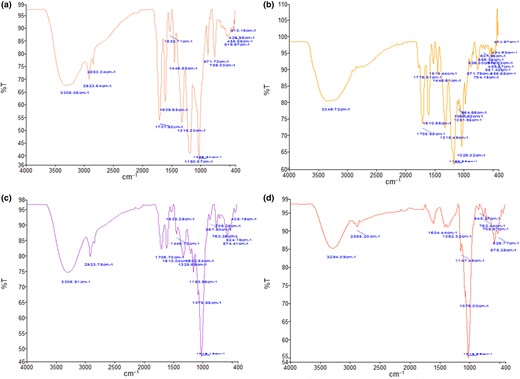
(a) FTIR spectrum of CA. (b) FTIR spectrum of standard of CA. (c) FTIR spectrum of ECA. (d) FTIR spectrum of encapsulate agent (maltodextrin & gum Arabic).
Analysis of the morphology of particles using SEM
The images of ECA observed in SEM analysis illustrate the morphology of ECA particles as shown in Fig. 3a–c. It was found that the majority of the particles were wrinkled with corrugated surfaces, while only a small portion of the particles had rounded surfaces. While feed droplets are dried using a spray drying nozzle, wrinkled particles were formed due to exposure to high temperatures in the drying unit. However, particles with rounded surfaces were formed when there was relatively lower temperature exposure. It has been previously reported that at higher processing temperatures and airflow, particles with wrinkles and corrugated surfaces were formed (Sudip et al., 2016). These corrugations in the encapsulated surface aid in dispensability by reducing the contact area (Sudip et al., 2016). Consequently, these surface corrugations would facilitate dispersing and releasing the CA from the spray-dried product in food and pharmaceutical applications.
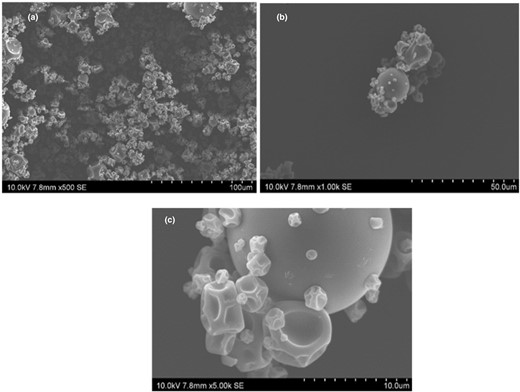
(a–c) Image of the ECA under a scanning electron microscope at 500× magnification (a), scanning electron micrograph of the ECA at 1000× magnification (b) and scanning electron micrograph of the ECA at 5000× magnification (c) at 10 kV with a working distance of 7.8 mm.
In vitro digestion of ECA under simulated gastric and intestinal conditions
The stability of bioactive compounds is influenced by several different factors such as acidity, the presence of enzymes, temperature and matrix (Nuray & Saliha, 2020). The structural characteristics of ECA were evaluated by simulating gastric and intestinal fluids to examine in vitro digestion and discharge of the apparent ECA. The release of the CA was observed for 121 ± 1 min. As previously mentioned, the obtained amount of CA in 1 g of ECA was 89.24% ± 0.08% CA. The release of CA was analysed by HPLC after 121 ± 1 min of digestion and was observed to be 86.42% ± 0.12% in SGF and 88.16% ± 0.08% in SIF. Therefore, in vitro digestion to release CA from ECA suggests that the release rate of CA from the ECA was slightly higher in the SIF sample than in the SGF sample. A similar finding was observed under SGF and SIF conditions, as reported in the previous research (Nuray & Saliha, 2020) where a higher release of phenolic compounds in SIF conditions for carrier materials like maltodextrin and maltodextrin/gum Arabic (9:1) was observed than in the SGF conditions. The release of CA content from the microcapsules after 121 ± 1 min was slightly higher in SIF (pH 6.8) than in SGF (pH 1.2), indicating that the release of the CA compound was affected by the acidic media in the SGF.
Storage study of ECA
The storage stability study of the CA and ECA was depicted by the antioxidant activity of the CA. It was found that the storage stability of ECA at the temperature of 25 ± 2 °C before reaching 50% antioxidant activity was 640 days (54.19% ± 0.02%) which was significantly higher than 130 days (52.46% ± 0.14%) for CA (Fig. 4). Therefore, it was concluded that CA encapsulation enhances the CA's stability in terms of its antioxidant activity potential. From this, it can be inferred that encapsulation protects the CA against external factors and can be used as an effective method to preserve the stability of CA.
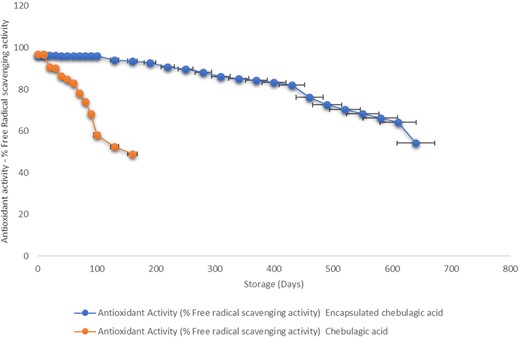
Storage stability study of ECA and CA at 25 ± 2 °C. Error bars indicate significant differences among the storage periods of samples (P < 0.05).
Storage stability of OR and ORE samples at 25 ± 2 °C
pH analysis of orange juice samples
One of the vital factors affecting juice quality includes pH, which can result in microbial spoilage characterised by changes in flavour, appearance and CO2 production, leading to the product degradation (Rosa et al., 2020). Hence, determining pH values of juice is crucial to evaluate its quality. In both OR and ORE samples, the pH values were observed to be ranging from 3.41 to 3.96 (Fig. 5) and the pH trend observed was similar to the findings reported by Rosa et al. (2020) for stored orange juice samples. The higher pH values could be attributed to the reduction in the citric acid content caused by metabolism of acid, similar findings were reported by Mu et al. (2018) and Rosa et al. (2020). However, at the end of 200 days at 25 °C, the pH value declined to 3.49 ± 0.02 in ORE sample (Fig. 5), which might be related to an increase in concentration of weak acids, as previously observed by Eke-Ejiofor (2016).
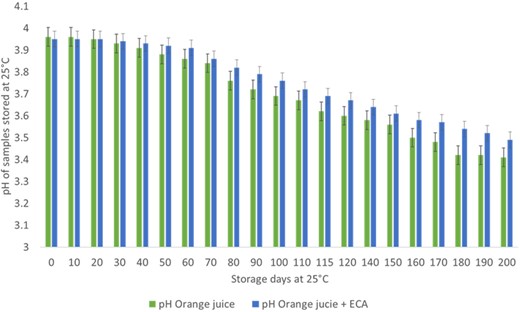
pH analysis of OR and ORE samples stored at 25 °C.
Colour analysis of orange juice samples (OR, ORE)
This study investigated the effects of addition of encapsulated CA on the colour attributes of orange juice. Encapsulation improved the lightness of CA, as indicated by higher L* values in the encapsulated ECA samples compared to CA samples (Table 2). Additionally, encapsulation resulted in a shift towards greenness and away from redness and yellow, as indicated by lower a* and b* values. These findings suggest that encapsulated CA has potential for use in various food products where colour appearance is an important factor. When the encapsulated ECA was added to orange juice, it had no specific impact on colour parameters, and there was no change in the observed colour attribute values even after a day of addition (Fig. 6). However, during storage, a decrease in absolute L* values (P < 0.05) and an increase in a* values were observed in both OR and ORE samples, possibly due to the non-enzymatic browning reaction favoured by temperature during the storage at 25 ± 2 °C (Fig. 6) (Kennedy et al., 1990; Wibowo et al., 2015; Rosa et al., 2020). Despite this, both samples showed positive a* values, indicating a colour change towards red colour; similar results were reported by Rosa et al. (2020). The observed b* values were positive and showed a decrease in the values with storage duration, indicating a shift of colour towards yellow. Overall, these results provide insight into the potential use of encapsulated CA in food products specifically orange juice, but the effect on colour stability during storage should be considered.
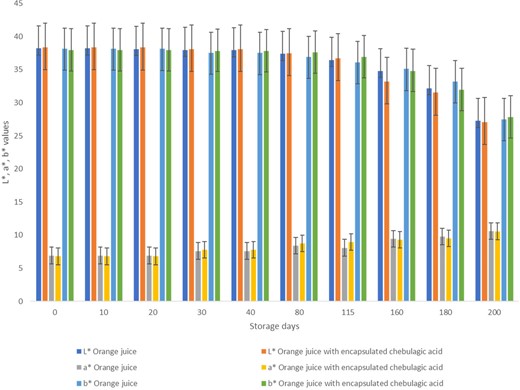
Colour analysis of orange juice and orange juice incorporated with ECA stored at 25 ± 2 °C. The lightness (L*), redness/greenness (a*) and yellowness/blueness (b*) of the samples were assessed.
Antioxidant activity of OR and ORE samples
The present study evaluated the antioxidant activity of OR and ORE samples using the DPPH assay, a recommended methodology for determining the antioxidant capacity of fruit products (Caridi et al., 2017; De Bruno et al., 2019) (Fig. 7). Figure 7 shows a significant decrease in the scavenging activity in both samples during the storage period due to the storage temperature. In this study, a decrease in the % free radical scavenging activity to 50% is considered the end point of storage stability study. In the OR sample, the % inhibition decreased to 50.79% ± 3.06% on the 115th day, whereas, for the ORE sample, the % inhibition decreased to 50.13% ± 0.59% on the 200th day. The observed results show that adding ECA increased the orange juice's antioxidant activity to 99.89% ± 0.04% and storage stability. The observed results show that the storage stability of OR and ORE samples is 115 and 200 days comparatively lower than the storage stability of ECA alone (Fig. 4). These findings suggest that the incorporation of ECA into orange juice significantly improved its antioxidant activity and storage stability, indicating the potential of ECA to improve the stability of food products.
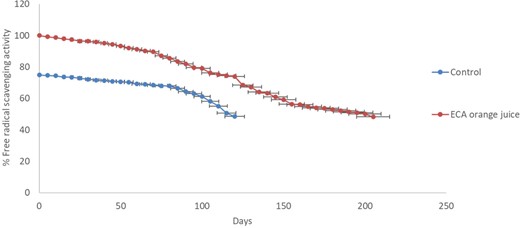
% Free radical scavenging activity of orange juice and orange juice with ECA at 25 ± 2 °C.
Sensory evaluation
The results of the consumer acceptability study are shown in Figure 8. No significant differences were detected by the panellists between OR and ORE samples in terms of colour and appearance (7.14 vs. 7.31), taste (6.98 vs. 7.08), flavour-astringency (8.81 vs. 8.67), mouthfeel (7.36 vs. 7.53), sedimentation (8.22 vs. 8.20) and overall acceptability (8.08 vs. 8.17) respectively. Whereas, for the samples incorporated with CA, the panellists detected a significant difference in terms of colour (2.23), taste (1.47), flavour–astringency (1.53), mouthfeel (1.75), sedimentation (2.03) and overall acceptance (1.81). When asked to describe any specific flavour characteristics, 98% of panellists found the ORC sample is more bitter and astringent, whereas OR and ORE samples did not show any bitter taste or astringency. In addition, a significant number of panellists liked the OR and ORE samples (90.0%–8.08 ± 0.50 [liked extremely] vs. 98.33%–8.17 ± 0.48 [liked extremely]), compared to the ORC sample (98.67%–1.81 ± 0.44 [Extremely dislike]) respectively.
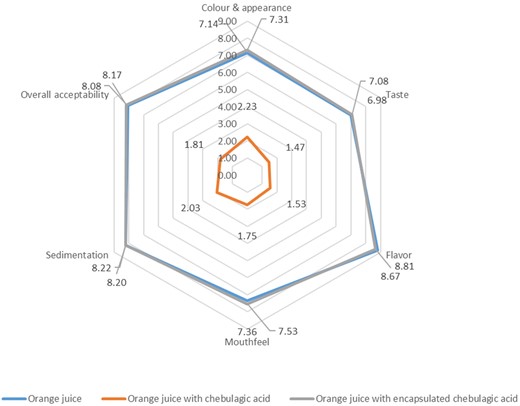
Sensory evaluation of colour and appearance, taste, flavour-astringency, mouthfeel, sedimentation and overall acceptability of OR, ORC and ORE samples.
Conclusion
In conclusion, this study demonstrated that spray-dried CA encapsulated with 60% maltodextrin and 40% gum Arabic at a processing (inlet air) temperature of 140 °C exhibited the highest encapsulation efficiency, antioxidant activity and considerable powder yield with better water absorption index, water solubility index and swelling capacity. In addition, the encapsulation has also successfully provided white colour to the CA. Moreover, ECA demonstrated enhanced storage stability, with a significantly longer storage period compared to non-encapsulated CA under ambient conditions. The sensory evaluation confirmed the high overall acceptance and extreme likability of ORE and OR samples, while the ORC sample was strongly disliked. In this study, at ambient storage conditions, it is observed that the addition of ECA can improve the storage stability of the product. ECA could potentially be used in food applications due to its good antioxidant activity and solubility.
These findings suggest that ECA has potential applications in the food industry due to its extended storage stability, and antioxidant activity. However, further research is needed to explore different encapsulation methods, investigate the encapsulation mechanism, evaluate the release of CA in complex food matrices and assess the sensory properties and stability of ECA in various food products. These future research studies would provide valuable insights for the commercialisation and practical utilisation of ECA.
Acknowledgments
The authors acknowledge the fund by the School of Science, Monash University Malaysia. Open access publishing facilitated by Monash University, as part of the Wiley - Monash University agreement via the Council of Australian University Librarians.
Author contributions
Mrudula Guggilla: Conceptualization (lead); data curation (lead); formal analysis (lead); investigation (lead); methodology (lead); project administration (lead); visualization (lead); writing – original draft (lead); writing – review and editing (lead). Lee-Fong Siow: Funding acquisition (lead); resources (lead); software (lead); supervision (lead); validation (equal); writing – review and editing (equal). Sek Chuen Chow: Resources (supporting); software (supporting); supervision (supporting).
Conflict of interest statement
The authors declared no conflicts of interest for this article.
Data availability statement
Research data are not shared.
References
Annotation: This article is important for our manuscript. This study was conducted by our research team. This research shows the extraction of chebulagic acid from Terminalia bellirica fruits using supercritical fluid extraction method, where 96.9% pure chebulagic acid was extracted.
Annotation: This article is important for our manuscript. In this study, the characteristics of spray dried encapsulates are investigated. This study highlights the significant role played by maltodextrin in the spray-drying process and its impact on the encapsulated product.
Annotation: In this study the encapsulation of ellagic acid, a polyphenol from pomegranate peels has been investigated. This study investigated the controlled release of this ellagic acid in simulated gastrointestinal fluids.
Annotation: This study shows the pharmacological properties of the chebulagic acid. The source of the chebulagic acid used in this research is Terminalia chebula.
Annotation: This study investigates the impact of the spray drying technology at different inlet air temperatures and maltodextrin, gum Arabic concentrations on the encapsulation of the polyherbal mixture. This study shows the shelf-life enhancement of the encapsulated polyherbal mix compared to control samples (non-encapsulated polyherbal mix). This study shows that the encapsulation protects the antioxidant activity and improves the stability of the product.
Annotation: This study investigates the quality changes in the pasteurised orange juice during different storage conditions. This study shows the impact of the storage temperature and time on the colour attributes of the orange juice products. The colour of the product impacts the consumer acceptance; hence, this study is required to monitor the parameters responsible for the change in colour attributes of the product.
