


Abstract
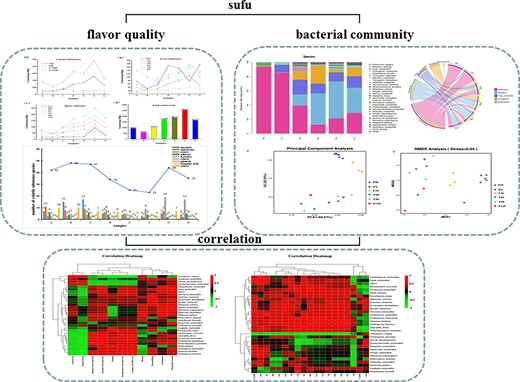
Dynamic changes in the flavour quality and microbial composition of sufu in the whole fermentation were studied, and the correlation between them was analyzed. Totally, 135 volatile flavours were identified. The types of volatile substances in sufu ripening for 90 days reached 44, which mainly contributed to volatile components of odour including 1-octen-3-ol (ROAV = 89.89), phenylethyl alcohol (ROAV = 25.05), benzaldehyde (ROAV = 46.82), octanoic acid ethyl ester (ROAV = 49.01) and 2-pentyl furan (ROAV = 100). Glutamate acid, aspartic acid and 5′-guanylate contributed significantly to sufu post-fermentation (TAV >1). The microorganisms in sufu were identified using internal transcribed spacer sequencing technology. The correlations among volatile flavour, taste substances and bacterial community structure were tested via Spearman analysis. Monascus kaoliang promoted the accumulation of most taste components and ethyl ester flavour substances, while Actinomucor elegans inhibited the accumulation of most flavour substances in sufu. This study could potentially help with the rational design of microbial communities to improve sufu quality.
Introduction
Sufu is a traditional fermented bean curd with more than 1000 years of history in China (Feng et al., 2014; Qu et al., 2022). It is made from soybeans and is considered an easily digested nutritious protein food. Sufu consumed as a non-cholesterol food from plants is popular among people with high-fat obesity, and is known as an appetizer and seasoning in delicious Chinese cooking (Han et al., 2013). Generally, sufu with a highly attractive aroma and delicious taste is fermented by various microorganisms (Han et al., 2004; Yao et al., 2021). The production of sufu involves four processes: preparation of tofu cubes, inoculation of the tofu cubes with microorganisms (also named pre-fermentation), salting of pehtzes and post-fermentation (Xu et al., 2015; He et al., 2018). Tofu is decomposed into sufu by microorganisms and complex enzyme systems, with great changes in nutritional composition and improved nutritional value.
The flavour substances of sufu generally include volatile compounds and flavour substances. The products of sufu are formed by microbial fermentation, and the principle of fermentation lies in the decomposition of macromolecules in the sufu by endogenous enzymes or enzyme systems in the microbia (Fan et al., 2020). Therefore, microorganisms are the key indicators affecting the flavour and flavour characteristics of sufu (Feng et al., 2016). To date, gas chromatograph-mass spectrometry (GC–MS) and high-performance liquid chromatography (HPLC) have been applied in the detection of flavour substances in food research (Ji, 2020). Because of the different raw materials and fermentation conditions, sufu has different odour and taste characteristics (He et al., 2020). Zhang et al. (2021) analyzed the microbial diversity of sufu samples from 16 regions and its effect on flavour. He et al. (2020) found the physiochemical indicators and flavour substances of sufu were correlated with core fermentation bacteria in traditional fermentation. Some scholars studied the optimization of starter, analyzed the dynamic change in the nutritional quality of sufu produced by different starters, and discussed the correlation with the bacterial community (Li et al., 2016; Bao et al., 2020).
Fermentation had an important influence on the production and variation of flavour substances in sufu. In this study, the flavour substances and aroma components in sufu were characterized by GC–MS, amino acid analyser and high-performance liquid chromatograph. Relative odour activity value (ROAV) and taste activity value (TAV) were calculated to further evaluate their influence on the overall flavour of sufu. For the first time, the change rules and causes of the basic taste (sweet, umami and bitter) of sufu were explored. Internal transcribed spacer (ITS) sequencing technology was used to identify the microbial community structure of sufu and analyze the changes of dominant bacteria in sufu. Correlation analysis was carried out for the dynamic changes in microbial community structure and flavour quality. The results will help to further understand the key flavour characteristics and explore the relationship between flavour quality of sufu and the flora, so as to meet the increasing demand for high-quality production of bean curd microbial community structure.
Material and methods
Samples preparation
Sufu samples provided by Changchun ZhuLaoLiu Food Co., Ltd. (Changchun, China) were stored in the laboratory refrigerator at 4 °C at the Jilin University. To monitor the flavour and quality of bean curd throughout the production and fermentation, Tofu, pehtze (overgrown with mould mycelia), salted pehtze, and sufu ripened for 10 days, 30 days, 60 days, 90 days and 120 days were sampled for analyses and named as A, B, C, D, E, F, G, H. It was usually considered that 60 days was mature (SB/T10170-2007).
Chemicals
Extractive heads were carboxen/polydimethylsiloxane (CAR/PDMS, 75 mm thickness, Supelco, Bellefonte, PA, USA). Chromatographic methanol alcohol and N-hexane were purchased from Macklin Biochemical Co. Ltd. (Shanghai, China). 5′-Guanosine acid (5′-GMP) and 5′-inosine acid (5′-IMP) were obtained commercially from Sigma-Aldrich (Shanghai, China). All the standard amino acid reagents were purchased from the Yuanye Biotechnology Co., Ltd. (Shanghai, China). Perchloric acid, potassium hydroxide, potassium dihydrogen phosphate, dipotassium hydrogen phosphate and sulfosalicylic acid were bought from Sinopharm Chemical Reagent Co. Ltd. (Shanghai, China). Needle filter (PES and Nylon, 0.22 μm–13 mm and 0.45 μm–25 mm) and millipore filter (0.22 μm–50 mm, 0.45 μm–60 mm) were purchased from the Jinteng Experimental Equipment Co., Ltd. (Tianjin, China).
Sensory evaluation
Panel training and analysis
A sensory panel was recruited from 30 potential panelists who were all habitual sufu consumers in various places throughout the campus. Then, 10 healthy panelists who were aged 20–25 years old and had no hunger or thirst were selected. The panelists were familiar with basic sensory evaluation techniques. Before the sensory evaluation, they participated in the briefing section to be familiarized with the specific vocabulary used to describe the properties of sufu. They were trained for 20 days on standard recommendations (ISO 11093-3, 1994) with a focus on sufu characteristics (Stampanoni, 1994; Vilela et al., 2018).
Sensory standards
Analyses were performed in individual cabins with controlled temperatures (20 °C). In total, 10 panelists tasted 12 sufu samples. All the samples were given and evaluated in the same environment, with a balanced order of presentation (Macfifie et al., 1989). Each sample was presented in a plastic cup (25 mL) and coded with random three-digit numbers. The average score of 10 panelists was taken as the final evaluation score of the group of sufu. Table 1 shows the evaluation standard of comprehensive quality grades of sufu (He et al., 2018; He & Chung, 2019). Table 2 shows the results of the odour rating evaluation of the sufu.
Standard of odour evaluation of sufu
| Attributes | Standard | Score | Grades |
|---|---|---|---|
| Odour | Pure and accurate aroma, with the unique aroma of sufu, no peculiar smell | 76–100 | 1 |
| Aroma was not obvious, no bad smell | 51–75 | 2 | |
| Inaccurate aroma, with bad smell | 26–50 | 3 | |
| No aroma, with bad smell | 0–25 | 4 |
Odour evaluation results of sufu
| Evaluation score | Quality grades of sufu | |
|---|---|---|
| 30 days | 47 | 3 |
| 60 days | 74 | 2 |
| 90 days | 92 | 1 |
| 120 days | 68 | 2 |
| Evaluation score | Quality grades of sufu | |
|---|---|---|
| 30 days | 47 | 3 |
| 60 days | 74 | 2 |
| 90 days | 92 | 1 |
| 120 days | 68 | 2 |
Monitoring of volatile flavour substances during fermentation
The sufu samples (3.0 g; seven key points of sufu mentioned in Samples preparation) were measured in 15 mL headspace injection bottles. The set temperature of the incubator was 60 °C, equilibrated for 10 min, extraction for 30 min, and detachment time for 300 s. The ageing temperature of the PDMS/CAR extraction head was set to 260 °C, and the ageing time was set for 30 min.
The concentrated extract was analyzed using a GC–MS system (Agilent 7000D, Santa Clara, the United States). Separation was performed with a DB-35 MS column (30 m × 0.25 mm × 0.25 μm, Agilent 122-3832). The concentrated extract (1 μL) was injected directly into the GC apparatus in a splitless mode. The temperature programs were as follows: inlet temperature at 250 °C, with the heating program starting at 80 °C (holding for 3 min), running at 85 °C, increasing by 5 °C min−1 to 160 °C, and then increasing to 280 °C by 12 °C min−1 (holding for 5 min). The MS conditions were: electron energy of 70 eV, and a scan range of 30–450 U. The full-scan acquisition mode was applied. The temperature of the ion source was 230 °C, and the quadrupole temperature was 150 °C (Chen et al., 2019). The composition and analysis of the compounds were determined by combining the computer NIST spectral library retrieval results (Linstrom, 2004) and manual spectrogram analysis, while the volatile compounds were determined by the area normalization method.
Monitoring of taste substances during fermentation
Detection of 5′-GMP and 5′-IMP: The sufu samples were extracted with 5% perchloric acid (w w−1), homogenized, centrifuged at 4500 g for 10 min at 4 °C, filtered and the volume was fixed after adjusting the pH to 4.5. The samples were prepared using a 0.22 μm aqueous phase needle filter for HPLC (*LC-2010, Shimadzu, Japan). The chromatographic conditions were: the mobile phase A was methyl alcohol and the mobile phase B was 0.5 mol L−1 potassium dihydrogen phosphate solution (pH 4.5). The mobile phase was filtered by an aqueous phase millipore filter and degassed for 30 min. The elution gradient procedure was: 1.3%/98.7%, stabilization for 14 min, 15%/85%, stabilization for 6 min, 1.3%/98.7%, and stabilization for 7 min. A column (WAT045905 Symmetry® C18 5 μm, 4.6 × 150 mm) was used in the detection at the flow rate of 0.8 mL per minute and temperature of 30 °C. The injection volume was 10 μL, and the wavelength was 254 nm (Kong et al., 2017).
Detection of free amino acids: Sufu samples (3 g) were weighed, and 20 mL of a sulfosalicylic acid solution (3 g 100 mL−1) was added and extracted for 5 min. The samples were homogenized at 4000 rpm for 1 min and centrifuged at 4500 g for 10 min at 4 °C. The centrifuged liquid was filtered by double-layer filter paper, and the volume of the volumetric flask was 100 mL. N-hexane (2 mL) was extracted with a constant volume solution, and the lower liquid was absorbed after repeated mixing by vortex oscillation (VM-300S, LAB FISH, Hangzhou, China). The lower liquid was filtered through a 0.45-μm water needle filter and used for amino acid analysis (S433-D, sykam, Germany) (Li et al., 2021).
Identification of sufu flora during fermentation
Cetyltrimethylammonium bromide method (CTAB) was used to extract total microbiome DNA from sufu, including pehtze and salting of pehtzes, and sample of post-fermentation at 30 days, 60 days, 90 days and 120 days. DNA quality was detected by electrophoresis and the extracted DNA was quantified. With microbial DNA as an amplification template, the ITS region sequences of fungi were amplified by PCR (Hamad et al., 2017). The PCR amplification system, primers and amplification procedure are shown in Tables 3 and 4. The product PCR was purified and quantified. Its concentration was evaluated using an Agilent 2100 bioanalyzer (Agilent, the United States) and a library quantification kit (Kapa Biosciences, Woburn, MA, the United States) and the concentration exceeding 2 nM was qualified (Karlsson et al., 2014). The amplicon was delivered to Lianchuan Biotechnology Co. Ltd. (Hangzhou, China) for the preparation of an Illumina library and 2 × 250 bp double-end sequencing on a NovaSeq 6000 sequencer.
PCR amplification reaction system and primers
| PCR reaction component | PCR reaction volume | Primers |
|---|---|---|
| Phusion Hot start flex 2× Master Mix | 12.5 μL | |
| Forward primer | 2.5 μL | F(5′-GAACCWGCGGARGGATCA-3′) |
| Reverse primer | 2.5 μL | R(5′-GCTGCGTTCTTCATCGATGC-3′) |
| Template DNA | 50 ng | |
| Add ddH2O to | 25 μL |
| PCR reaction component | PCR reaction volume | Primers |
|---|---|---|
| Phusion Hot start flex 2× Master Mix | 12.5 μL | |
| Forward primer | 2.5 μL | F(5′-GAACCWGCGGARGGATCA-3′) |
| Reverse primer | 2.5 μL | R(5′-GCTGCGTTCTTCATCGATGC-3′) |
| Template DNA | 50 ng | |
| Add ddH2O to | 25 μL |
PCR amplification procedures
| PCR reaction temperature | PCR reaction time | Cycle number |
|---|---|---|
| 98 °C | 30 s | |
| 98 °C | 10 s | |
| 54 °C | 30 s | 32 |
| 72 °C | 45 s | |
| 72 °C | 10 min | |
| 4 °C | ∞ |
| PCR reaction temperature | PCR reaction time | Cycle number |
|---|---|---|
| 98 °C | 30 s | |
| 98 °C | 10 s | |
| 54 °C | 30 s | 32 |
| 72 °C | 45 s | |
| 72 °C | 10 min | |
| 4 °C | ∞ |
Sequencing data analysis and processing
For the double-ended data obtained by sequencing, the samples were split according to barcode information to remove the connector and barcode sequence. Then, the data were spliced and filtered on Cutadapt 1.9 and PEAR 0.9.6, and the effective sequences were obtained through filtering on Fqtrim and Vsearch 2.3.4 (Xiong et al., 2018). Finally, DADA2 was used for length filtering and denoising. The ASV (feature) feature sequence and ASV (feature) abundance table were obtained and used to analyze the Alpha diversity of samples (Rognes et al., 2016; Gao et al., 2019). Then, according to the statistical data of species abundance, the differences between samples were analyzed.
Calculation of TAV and ROAV
Relative odour activity value of each odourant was calculated as the concentration ratio of an individual compound in the sufu to its aroma threshold value in water (Moyano et al., 2010). TAV was calculated to analyze the contribution of a component to the whole taste (Tian et al., 2020). The formulas are as follows:
where C%x and Tx are the relative percentage content and threshold value of each volatile component, respectively; C%Stan and Tstan are the relative percentage content and threshold value respectively of the component that contributes the overall flavour; Ca and Ta are the concentration and threshold value of taste substance, respectively.
Statistical analysis
All the samples were detected in triplicate. The mean and standard deviation were calculated on Microsoft Excel 2020 and SPSS Statistics 23 (IBM Corp., Armonk, NY, USA). Spearman correlation was used to analyze the correlation between microbial community structure and the quality of sufu. P < 0.05 represented ‘significant’ and P < 0.01 represented ‘highly significant’.
Results and discussion
Volatile components of sufu during fermentation
The sufu samples at each stage of fermentation were detected to identify the volatile flavour substances. As shown in Table S1, a total of 135 volatile components were detected from the sufu samples by GC–MS, including 18 alcohols, 30 esters, 23 aldehydes, 23 alkenes, 10 Ketones, 1 ethers, 3 phenols, 3 organic acids, 24 other types. A variety of volatile substances were almost detected throughout the sufu fermentation, and finally form the unique flavour of sufu (Wang et al., 2019). The distribution of volatile substances in sufu is illustrated in Fig. 1.
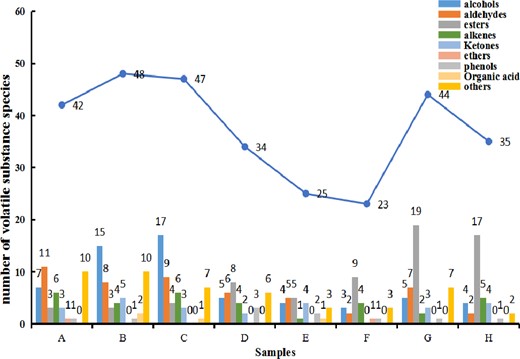
The distribution of volatile substances in sufu.
Analysis of volatile substance contribution during post-fermentation
The contributions of the volatile compounds were evaluated with the samples after 30 days, 60 days, 90 days and 120 days during post-fermentation, and the ROAVs of different volatile substances were listed in Table 5. The primary (1 ≤ ROAV < 100) and secondary (0.1 ≤ ROAV < 1) flavour substances of sufu during post-fermentation were summarized in Table 6.
Relative odour activity value of volatile flavour of sufu during post-fermentation
| Volatile substance | Threshold value | Relative content (%) | ROAV | ||||||
|---|---|---|---|---|---|---|---|---|---|
| 30 days | 60 days | 90 days | 120 days | 30 days | 60 days | 90 days | 120 days | ||
| Hexyl alcohol | 2500.00 | 3.18 | 5.29 | 1.01 | 1.89 | <0.01 | <0.01 | <0.01 | <0.01 |
| 1-Octen-3-ol | 0.02 | 16.21 | 2.31 | 4.06 | 5.36 | 100.0 | 100.0 | 89.89 | 76.23 |
| 3-methyl-butanol | 180.00 | 1.69 | – | 3.12 | 4.11 | <0.01 | – | <0.01 | <0.01 |
| Phenylethyl alcohol | 0.09 | 5.44 | 1.94 | 4.86 | 5.32 | 7.80 | 19.50 | 25.05 | 17.62 |
| Hexanal | 0.02 | 2.33 | – | 0.39 | 0.52 | 14.39 | – | 8.56 | 7.35 |
| Nonanal | 0.01 | – | 0.18 | 0.09 | – | – | 14.07 | 3.43 | – |
| Decanal | 0.10 | 0.27 | – | 0.12 | 0.21 | 0.33 | – | 0.54 | 0.58 |
| Benzaldehyde | 0.05 | 6.44 | 1.46 | 5.28 | – | 15.88 | 25.18 | 46.82 | – |
| Butanoic acid ethyl ester | 0.01 | – | – | 0.21 | 0.74 | – | – | 9.49 | 21.18 |
| Octanoic acid ethyl ester | 0.20 | 8.83 | 15.55 | 22.11 | 27.59 | 5.44 | 67.22 | 49.01 | 39.28 |
| Hexadecanoic acid ethyl ester | 1.50 | 1.12 | 24.74 | 15.64 | 1.96 | 0.09 | 14.26 | 4.62 | 0.37 |
| Linoleic acid ethyl ester | 4.00 | 0.52 | 6.75 | 4.11 | 1.32 | 0.02 | 1.46 | 0.46 | 0.09 |
| Ethyl oleate | 3.50 | – | 1.32 | 0.91 | – | – | 0.33 | 0.11 | – |
| 2-Heptanone | 9.00 | 1.48 | – | 0.96 | 2.55 | 0.02 | – | 0.05 | 0.08 |
| Phenol | 0.65 | 3.32 | – | – | – | 0.63 | – | – | – |
| 2-pentyl furan | 0.05 | 20.77 | 2.11 | 10.83 | 16.86 | 53.4 | 37.97 | 100.0 | 100.0 |
| 3-Octanone | 18.00 | 0.59 | – | – | 0.43 | <0.01 | – | – | <0.01 |
Note: ‘–’ indicates that the content of the substance was low and has not been successfully detected in the samples.
Main flavour substances and secondary flavour substances of sufu during post-fermentation
| Samples | Main flavour substances | Secondary flavour substances |
|---|---|---|
| 30 days | 1-Octen-3-ol, Phenylethyl alcohol, hexanal, Benzaldehyde, Octanoic acid ethyl ester, 2-pentyl furan | Decanal, Phenol, Linoleic acid ethyl ester, 2-Heptanone |
| 60 days | 1-Octen-3-ol, Phenylethyl alcohol, Nonanal, Benzaldehyde, Octanoic acid ethyl ester, Hexadecanoic acid, ethyl ester, Linoleic acid ethyl ester, 2-pentyl furan | Ethyl oleate |
| 90 days | 1-Octen-3-ol, Phenylethyl alcohol, hexanal, Nonanal, Benzaldehyde, Butanoic acid ethyl ester, Octanoic acid ethyl ester, Hexadecanoic acid ethyl ester, 2-pentyl furan | Decanal, Linoleic acid ethyl ester, Ethyl oleate, 2-Heptanone |
| 120 days | 1-Octen-3-ol, Phenylethyl alcohol, hexanal, Butanoic acid ethyl ester, Octanoic acid ethyl ester, 2-pentyl furan | Decanal, Hexadecanoic acid, ethyl ester, Linoleic acid ethyl ester, 2-Heptanone |
Obviously, the types of volatile flavour substances in the samples were the most abundant at 90 days compared with the samples during the post-fermentation, and even the volatile substance content of esters reached the highest. In the 90-day sample, 13 types of volatile substances contributed the most to the flavour of sufu, and nine types of them contributed significantly to the overall flavour. The main volatile flavour substances with low threshold, high content and significant flavour characteristics included nonal, ethyl butyrate, ethyl palmitic acid, ethyl linoleate, esters and aldehydes. The variety, content and contribution rate of the main flavour compounds in the 90-day sample increased, which was mainly due to the reaction of amino acids, fats and other substances with alcohols after hydrolysis, forming ethyl ester compounds with low threshold and significant flavour characteristics. The main flavour substances of the post-fermented sufu samples were 1-octene-3-alcohol, phenylethanol and 2-amyl furan, which were all characterized to have floral and fruit fragrances that endowed sufu with the basic sweet and fresh flavour (Feng et al., 2018). Sufu has the best flavour for 90 days. The sufu fermented for 90 days in this study had the best flavour and more types of volatile flavour substances than the study by Wang et al. (2019).
Dynamic changes of taste substances during fermentation
The contents of taste substances varied greatly in different sufu fermentation stages (Fig. 2). According to the taste characteristics of different substances, the free amino acids and nucleotides detected in sufu were divided into umami substances, sweet substances and bitter substances. The changes in the content of total free amino acids in different samples were analyzed.
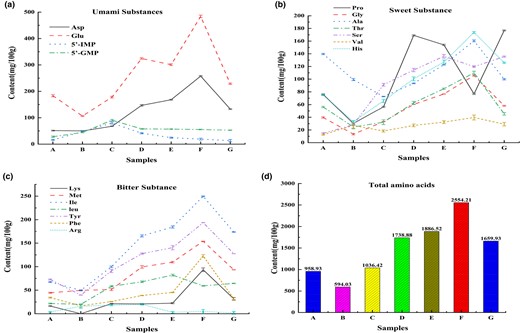
The dynamic changes of the content of umami substances (a), sweet substances (b), bitter substances (c), total amino acids (d) in sufu, respectively. A refers to the pehtze of sufu. B refers to salting of pehtzes of sufu. C, D, E, F and G refer to 10 days, 30 days, 60 days, 90 days and 120 days of sufu, respectively.
As for the umami substances, the content of amino acids was higher than that of nucleotides. The content of umami amino acids including glutamic acid (Glu) and aspartic acid (Asp) gradually increased and maximized at 90 days, while the content of umami nucleotides including 5′-GMP and 5′-IMP maximized at 10 days and then gradually decreased. The reasons may be that at the stage of pehtze, mucor proliferated in large quantity, gathered abundant enzyme systems and then interacted with microorganisms. Macromolecular substances were decomposed, and thus 5′-GMP and 5′-IMP were enriched. With the extension of fermentation time, 5′-GMP, and 5′-IMP as an intermediate participated in the completion of other biochemical reactions, resulting in a decrease in content. This was similar to the changes in soy sauce flavour nucleotides in Beer Yeast Paste (Wang et al., 2012). The contents of sweet amino acids decreased briefly and then increased, with a peak at 90 days. However, the proline and serine contents decreased at 90 days, and the decrease in proline content may be due to the proline degradation into glutamate under the oxidation of proline dehydrogenase. This confirmed the recent advances in the production of amino acids by microbial cells (Hirasawa & Shimizu, 2016). Therefore, glutamate accumulated greatly at 90 days. The content of bitter amino acids was low, and generally increased, reaching the highest at 90 days. A total of 16 amino acids were detected in the sufu with the extension of fermentation time, and the total content of free amino acids increased continuously and maximized to 2554.21 mg 100 g−1 on the 90th day of sufu.
Evaluation of taste substances contribution during post-fermentation
The TAVs of the main taste substances in the post-fermentation of sufu were calculated (Table 7). Glu, Asp and 5′-GMP contributed significantly to the post-fermentation of sufu. The TAVs were all greater than 1, and the contribution rates of the samples at different fermentation stages ranked as 90 days > 60 days > 30 days > 120 days. During the post-fermentation, the TAVs of 5′-IMP and 5′-GMP decreased gradually, while the TAVs of Asp and Glu first increased and then decreased. With the extension of post-fermentation time, the TAVs of sweet amino acids such as alanine and valine increased gradually, which helped to form a fresh sweet flavour quality in late sufu. Amino acids such as lysine, methionine, phenylalanine and isoleucine have a bitter taste, which also greatly impacts the bitter taste of sufu.
Changes of TAV of taste components in sufu during post-fermentation
| Taste substances | Taste | Threshold value (mg mL−1) | TAV | |||
|---|---|---|---|---|---|---|
| 30 days | 60 days | 90 days | 120 days | |||
| Asp | Umami | 1.0 | 1.47 | 1.68 | 2.58 | 1.33 |
| Thr | Sweet | 2.6 | 0.24 | 0.33 | 0.42 | 0.17 |
| Ser | Sweet | 1.5 | 0.76 | 0.91 | 0.80 | 0.91 |
| Glu | Umami | 0.3 | 10.80 | 10.03 | 16.13 | 7.63 |
| Pro | Sweet | 3.0 | 0.56 | 0.51 | 0.26 | 0.59 |
| Gly | Sweet | 1.3 | 0.46 | 0.59 | 0.82 | 0.45 |
| ALa | Sweet | 0.6 | 1.55 | 2.05 | 2.67 | 1.67 |
| Lys | Bitter | 0.5 | 2.00 | 2.54 | 3.48 | 2.52 |
| Cys | – | – | – | – | – | – |
| Val | Sweet | 0.4 | 2.50 | 2.40 | 3.73 | 2.58 |
| Met | Bitter | 0.3 | 0.90 | 1.07 | 1.33 | 0.97 |
| Ile | Bitter | 0.9 | 1.10 | 1.22 | 1.71 | 1.03 |
| leu | Bitter | 1.9 | 0.87 | 0.97 | 1.32 | 0.92 |
| Tyr | Bitter | 0.9 | 0.76 | 0.91 | 0.66 | 0.71 |
| Phe | Bitter | 0.9 | 1.42 | 1.56 | 2.16 | 1.42 |
| His | Bitter | 0.2 | 1.95 | 2.25 | 6.15 | 1.60 |
| Arg | Bitter | 0.5 | 0.40 | 0.06 | 0.10 | 0.04 |
| 5′-IMP | Umami | 0.25 | 1.64 | 0.96 | 0.76 | 0.52 |
| 5′-GMP | Umami | 0.125 | 4.64 | 4.56 | 4.48 | 4.24 |
At the stage of 90 days after fermentation, umami substances (5′-GMP, 5′-IMP), amino acids (Asp, Glu) and sweet amino acids (Val, Ala, Gly, Ser and Thr) contributed the most to the taste of sufu. The contribution rates of a large number of bitter components decreased, and those of only a small number of bitter amino acids increased. In general, the fermented sufu for 90 days meets the consumer demand for a fresh, sweet, soft and delicious taste.
Bacteria alpha and beta diversity of sufu during the fermentation
The diversity indexes of the bacterial community of sufu, including Shannon index, Chao index, Simpson index, Good's coverage and OTUs observed, are shown in Fig. 3a,b,c,d,e respectively. The value of good coverage was between 0.999 and 1, indicating that the bacterial community presented in all samples could be reliably described. There were significant differences in Shannon and Simpson index values of all samples (Fig. 3a,c,d). On contrary, the values of these indices in the early stage of fermentation were significantly lower than those in the later stage.
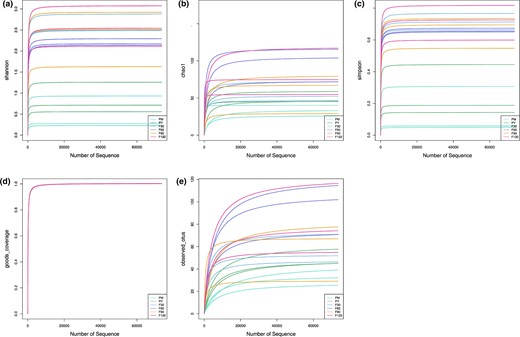
The diversity indexes of the bacterial community of sufu, including Shannon index (a), Chao index (b), Simpson index (c), Good's coverage (d) and OTUs (e).
According to the PCA diagram, the distance between samples in the same group indicates the repeatability of samples, and that between samples in different groups reflects the community differences between groups, the greater the distance between samples, the greater the difference. (Fig. 4a). PCA1 and PCA2 contributed 65.67% and 25.53% to OTU data difference. Among all the samples, the distance between 30 days and other samples was not small, indicating the large difference in the microbial community structure between them. The small distance between samples in 60 days, 90 days and 120 days groups indicated that there was little difference in microbial structure among groups. According to the abundance of different OTUs, NMDS (non-metric multi-dimensional scale) was used to compare the bacterial communities in samples from different fermentation periods (Fig. 4b). All the samples were mainly divided into three types according to their bacterial communities.
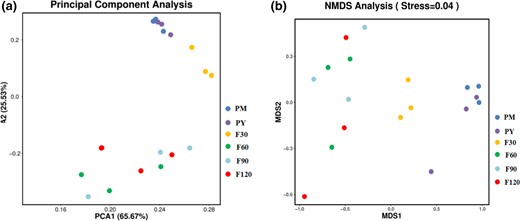
Based on PCA differences among bacterial communities (a) and non-metric multidimensional scale (NMDS) (b).
Species composition analysis of microorganisms in sufu
According to the abundance data of species, the TOP 30 species with the relative abundance of each sample were selected to draw a stacked histogram, and the TOP 5 microbial species were selected to make a Circos diagram (Fig. 5a,b). The dominant strains differed among the samples at different fermentation stages. The dominant strains of the samples at the pre-fermentation stage and 30 days were Actinomucor elegans and Fungi unclassified. Monascus kaoliang and Actinomucor elegans were found at 60–120 days of post-fermentation. At the genus level, Actinomucor elegans belongs to Actinomucor and is the representative strain of the fermented sufu. This was consistent with the dynamic study of volatile compounds during the fermentation of Chinese Mao-tofu from Huangshan region (Yan & Dong, 2019). Its relative abundance in the blank sample was 93.39%, so it was used in the sufu production in this experiment. Its abundance decreased after 60 days of fermentation and gradually increased after fermentation. Monascus belonging to Monascus at the level of fungi genus was added by sufu soup and detected at 30 days. Its abundance reached 51.73% at 90 days, and it was the main dominant flora at 60–120 days of post-fermentation. The Fungi unclassified were detected in the whole fermentation. Trichosporon is an oxidizing yeast that appears in frozen beef, mutton and some fermented products (Padilla et al., 2014). Both Kazachstania and Trichosporon belong to the yeast species and are detected in Chinese traditional fermented food (Guan et al., 2020). Alternaria unclassified elegans were found at 30 days of post-fermentation, which may cause potential harm to the life and health of consumers, but almost no longer emerged after 60 days. It provided a rationale for the idea that sufu should be fermented for at least 2 months to be sold (Tian et al., 2021).
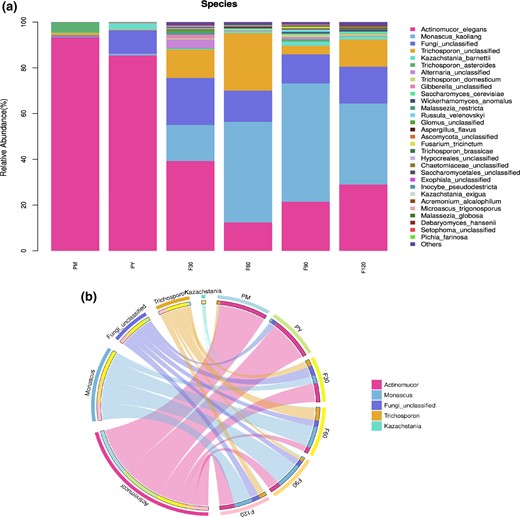
(a) Bar chart of horizontal abundance of fermented bean curd samples. PM, PY, F30, F60, F90, F120, refers to the samples in pehtze of sufu during pre-fermentatio, salting of pehtzes of sufu during pre-fermentation, 30 days, 60 days, 90 days and 120 days of sufu during post-fermentation, respectively. (b) Relative abundance of the sufu samples at genus level.
Correlation analysis of flavour and microbial community structure
Spearman correlation analysis was used to draw clustering heat maps among volatile flavour, taste substances and TOP 30 microbial flora in sufu (Fig. 6a,b).
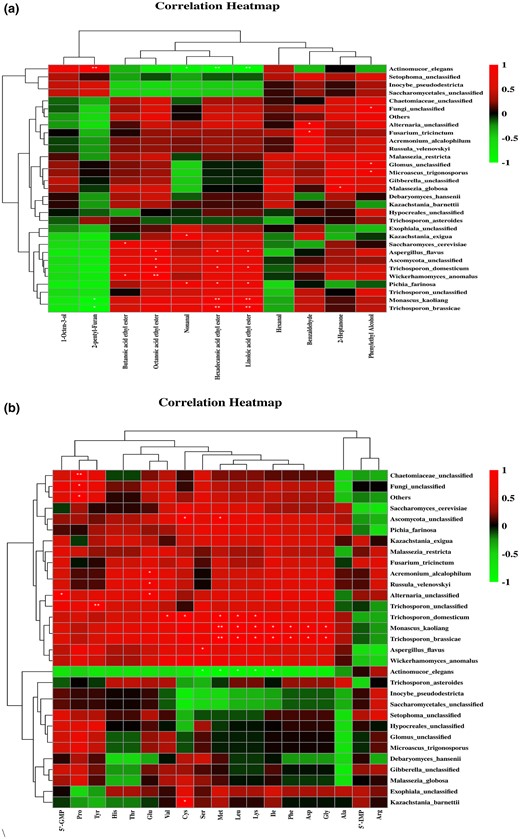
(a) Correlation analysis of microorganism and volatile flavour substances in sufu. * and ** in the figure represent statistical analysis of P < 0.05, P < 0.01. (b) Spearman correlation analysis of microorganisms and taste substances in sufu.
A significant positive correlation between 2-pentylfuran and the dominant species Actinomucor elegans (P = 0.002), while a significant negative correlation of 2-pentylfuran with Monascus kaoliang (P = 0.016) and Trichosporon brassicae (P = 0.05) were found. Actinomucor elegans can produce rich protease and lipase, which can greatly promote the degradation of proteins and fats and can form a special creamy flavour of sufu (Liu & Zhao, 2017). Hexadecanoic acid ethyl ester and linoleic acid ethyl ester were negatively correlated with Actinomucor elegans (P1 = 0.006, P2 = 0.005), and positively correlated with Monascus kaoliang (P1 = 0.007, P2 = 0.009) and Trichosporon brassicae (P1 = 0.008, P2 = 0.008). In addition, Monascus kaoliang can significantly affect the accumulation of ethyl ester flavour. Monascus possesses extracellular enzymes that can produce ethyl caproate and are resistant against acids and ethanols (Liu et al., 2018). As reported, the esterase secreted by monascus isolated from liquor Daqu can effectively promote the synthesis of ethyl caproate and ethyl lactate (Zhang et al., 2014).
Most taste substances of sufu were negatively correlated with Actinomucor elegans and significantly positively with the bacteria group Monascus kaoliang, Alternaria unclassified, Trichosporon unclassified, Trichosporon domesticum, Trichosporon brassicae and Aspergillus flavus. 5′-GMP and proline were significantly positively correlated with the flora Chaetomiaceae unclassified, Fungi unclassified and other species (P1 = 0.003, P2 = 0.026, P3 = 0.016), and this observation agreed with previous findings (Yin et al., 2020). Glu was significantly positively correlated with the core bacteria Acremonium alcalum, Russula velenovskyi and Alternaria unclassified (P1 = 0.028, P2 = 0.030, P3 = 0.033), while Trichosporon asteroides inhibited the content of umami nucleotides (P1 = 0.07, P2 = 0.014). This observation was consistent with previous findings in Doujiang (Han et al., 2021). The species cluster analysis showed that the species correlated negatively and positively with taste substances were grouped into two separate groups. Reasonable regulation of the positive group can promote the accumulation of taste substances in sufu and improve the flavour quality of products to meet the preferences of consumers.
Conclusions
In this study, volatile and flavour changes during fermentation were monitored and the flavour quality of sufu was analyzed. A total of 135 volatile flavour substances were detected throughout the fermentation process, mainly esters. Flavour substances were the best fermented for 90 days and validated by sensory evaluation. Spearman correlation analysis was established according to the dynamic changes of volatile flavour substances, flavour components and bacterial community in the sufu. Glu, asp and 5′-GMP were the main umami substances of sufu, which showed negatively associated with the nematode and significant positive associations with Aspergillus, unclassified Streptogramus, unclassified Trichospora, domestic hairy, rassica and Aspergillus flavus. Monascus kaoliang can promote the accumulation of most taste components and ethyl ester flavour substances in the sufu, while Actinomucor elegans can inhibit the accumulation of most flavour substances in the sufu. This study could provide support for further purebred fermentation to study the specific mechanisms of the formation of volatile compounds, and serve as a reference for rational design of microbial communities to improve sufu quality.
Acknowledgments
The study was supported by the Science and Technology Research Project of Education Department of Jilin Province—Research and Numerical Simulation of Heat and Mass Transfer Mechanism during Beef Roasting (No. JJKH20211128KJ), Identification and Analysis of Bitter Substances in Sufu and Study on Influencing Factors of Bitter Formation (2021XQ0030), and Development of Compound Starter for Northeast Sauerkraut and Identification of Main Flavor Substances (hp2020001).
Author contributions
Xiaodan Wang: Conceptualization (equal); methodology (equal); resources (equal). Cuilian Wang: Writing – original draft (equal). Feng Hu: Data curation (equal); project administration (equal). Maosong Yu: Funding acquisition (equal). Xianming Zhu: Funding acquisition (equal). Duo Wu: Investigation (equal); validation (equal). Shaoping Jiang: Investigation (equal). Jiaxue Tian: Investigation (equal). Ping Chang: Investigation (equal).
Conflict of interest
All the authors declare no conflicts of interest.
Ethical approval
Ethics approval was not required for this research.
Data availability statement
The authors do not have permission to share data.
