-
PDF
- Split View
-
Views
-
Cite
Cite
Jasim Ahmed, U S Shivhare, S Debnath, Colour degradation and rheology of green chilli puree during thermal processing, International Journal of Food Science and Technology, Volume 37, Issue 1, January 2002, Pages 57–63, https://doi.org/10.1046/j.1365-2621.2002.00532.x
Close - Share Icon Share
Abstract
The kinetics of degradation of both green- and total-colour of green chilli puree was studied at selected temperatures (50–90 °C). A fractional conversion concept was applied to determine the kinetic parameters. The degradation of green- and total-colour followed first order reaction kinetics. In the case of green colour the data was based on changes in Hunter –a value while L × a × b was found to adequately represent total colour change. Dependence of the rate constant during heat treatment obeyed the Arrhenius relationship. The activation energy values for green- and total-colour degradation were 23.04 and 25.02 kJ mol–1, respectively. These results indicated that total colour should be used as the quality indicator during thermal processing of green chilli puree. The pungency of green chilli puree decreased during thermal processing as the capsaicin content was reduced from 559 to 441 μg g–1 while the Scoville heat unit decreased from 8500 to 7480. The puree behaved as a shear-thinning fluid and the flow activation energy at 100 r.p.m. equalled 19.22 kJ mol–1.
Introduction
Chillies (Capsicum annum) are extensively consumed throughout the world because of their colour, flavour and pungency. The requirement for these attributes varies with application and taste of the consumer. It is commonly processed in the dried form that lacks fresh capsicum colour and flavour (Luning et al., 1995). Puree is one such product that is convenient to use and could retain the original colour and flavour in a semi-solid form.
The pungent chillies are mostly used in preparation of curries, sauces, meat and paste-curry mixes and for the manufacture of oleoresins. Rheological and colour degradation characteristics of one such variety (CH 1) of pureed chilli have been reported by Ahmed et al. (2000). Results of their study demonstrated the pseudo-plastic nature of puree. The colour degradation during thermal treatment followed first order reaction kinetics with an activation energy ranged between 11.4 and 16.0 kJ mol–1. Chillies with mild pungency are also extensively liked for salad and pickling. However, no information is available on rheological behaviour, pungency loss and colour degradation during thermal processing of these varieties.
Maintenance of colour in thermally processed and stored green vegetables has been a major challenge in food processing. Several attempts have been made to stabilize the green colour (Clydesdale et al., 1970; Ihl et al., 1998). The colour changes from bright green to olive-brown during thermal processing are caused by the conversion of chlorophylls to pheophytins (Rocha et al., 1993; Ihl et al., 1998). Colour measurement of green vegetables is generally based on spectrophotometric measurement of acetone extract of chlorophyll. It has been observed that thermally decomposed pheophytins cause interference in chlorophyll concentration measurements and the process is time-consuming (Eheart & Gott, 1965). Chlorophyll has also been measured using reflectance photometry by several researchers. While Gold & Weckel (1959); Clydesdale & Francis (1969); Schwartz & Lorenzo (1990); Rocha et al. (1993); Steet & Tong (1996) and Weemaes et al. (1999) described chlorophyll degradation using Hunter –a or –a/b values, Shin & Bhowmik (1994) and Ahmed et al. (2000) advocated inclusion of all the three colour parameters (L, a and b) to represent total colour degradation.
Trade in chillies depends on their pungency, which is considered as an important quality attribute. Capsaicinoids, the major pungent compounds in chillies have been widely studied (Todd, 1977; Dicecco, 1979; Bajaj, 1980; Rajpoot & Govindarajan, 1981). Several methods have been reported in the literature for estimation of capsaicin content (Govindarajan et al., 1977; Rajpoot & Govindarajan, 1981; Weaver et al., 1984; Govindarajan, 1985a). Among these, HPLC is the most efficient technique, the use of very fine particle size of absorbents and high pressure to move the eluent gives rapid and clean separation of the complex and closely related mixtures of organic compounds (Govindarajan, 1985b).
This paper deals with the effect of thermal processing on rheological, colour degradation kinetics and pungency of green chilli puree (variety: Punjab selection-27), used widely in pickling and salad preparation because of its mild pungent flavour.
Materials and methods
Fresh green chillies (variety: Punjab selection-27) (length=9 ± 0.5 cm; maximum diameter= 4.5 ± 0.5 cm) were procured from the local market in Amritsar in the state of Punjab, India.
Preparation of puree
Chillies were washed in running tap water, destalked manually and blanched for 3 min in hot water at 100 °C. Preliminary trials demonstrated that blanching at 100 °C for 3 min resulted in complete inactivation of chlorophyllase and peroxidase enzymes in green chillies. Chillies were cooled immediately in chilled water and drained. The blanched chillies were then comminuted in a laboratory size grinder (Comitrol, USA) through 14 mesh (1.19 mm) screen to obtain a puree of uniform size. The puree was stored immediately at 0 °C till further use.
Total soluble solids and pH
Total soluble solids (oBrix) and pH were measured with an Atago (Japan) refractrometer and a Systronics (Ahmedabad, India) pH meter with glass electrode at 25 °C.
Colour measurement
Two hundred grams of puree were weighed and transferred into a 250-mL glass beaker and covered with a lid. The beakers containing puree were placed in a constant temperature water-bath maintained at selected temperatures, viz. 50, 60, 70, 80 and 90 °C and periodically agitated to ensure uniform temperature throughout the bulk of the sample. The samples were heated for 0, 5, 10, 15 and 20 min, respectively, after the geometric centre of the puree attained the desired temperature (±0.5 °C). The samples were transferred to an ice-water bath immediately after the thermal treatment.
Objective colour measurements were made by using a Hunter colorimeter (Hunter Associates Laboratory Inc., Reston, USA) on the basis of three colour values, namely L, a and b. The instrument (45°/0° geometry, D25 optical sensor, 10° observer) was calibrated against a standard white reference tile (L=90.55, a=–0.71, b=0.39). A glass cell containing the heat-treated puree was placed above the light source and covered with a white plate and L, a and b values were recorded.
Kinetics studies
Degradation of chlorophyll has been shown to follow first-order reaction kinetics (Hutchings, 1994; Shin & Bhowmik, 1994; Steet & Tong, 1996; Ahmed et al., 2000). Fractional conversion is a convenient variable often used in place of concentration (Levenspiel, 1974) and is represented as

First-order reaction in terms of the fractional conversion may be expressed as

Steet & Tong (1996) used the Hunter colour –a value, a physical property that can be directly measured from the instrument, in place of concentration while studying the degradation kinetics of green colour in peas. The fractional conversion in terms of Hunter –a value can be written as

Equation (2) therefore takes the form

Dependence of the rate constant on temperature was represented by the Arrhenius equation

where, C=concentration in respect of Hunter colour value (L, a, b) or a combination of these at any time t (dimensionless), C0=Hunter colour value(s) at zero time (dimensionless), C∞=Hunter colour value(s) at infinite time (dimensionless), k=rate constant (min–1), t=heating time (min), k0=frequency factor (min–1), E=activation energy (kJ mol–1), R=universal gas constant (8.314 J mol–1 K–1) and T=absolute temperature (K).
Visual green colour at infinite time (–a∞) was determined by heating puree at 50–90 °C for 600 min following the method of Steet & Tong (1996).
Rheological study
Apparent viscosity of the green chilli puree was measured using a rheometer model RVDV-III (Brookfield Engg. Lab. Inc., Stoughton, MA, USA) in the temperature range of 50–90 °C. The puree was placed in a 500-mL graduated glass beaker with flat bottom. S#4 spindle was selected for the measurement and was used without the spindle guard of the viscometer. The viscosity was measured between 50 and 150 r.p.m. A thermostatic water-bath (TC 500) was used to regulate the sample temperature (±1 °C).
Pungency measurements
Sensory measurement by Scoville heat unit
The pungency of chillies was determined subjectively in terms of Scoville heat unit (SHU) (Govindarajan et al., 1977; IS: 8104, 1976). One gram of puree was mixed with 100 mL of ethanol by refluxing for 3 h followed by filtration through suction and washing the residue with ethanol. The volume was made up to 100 mL with ethanol. Preliminary testing was done by preparing a dilution of stock sample in 3% sucrose solution in geometrical series while the final evaluation was made by using the arithmetic series of the dilution from the stock solution around the approximate threshold identified in preliminary testing. The pungency was calculated in terms of SHU from the standard table (IS: 8104 1976).
HPLC analysis of capsaicin
The capsaicin assay was performed in accordance with a HPLC method described by Hoffman et al. (1983) for determination of heat value of red pepper. The assay was made by using a Shimadzu LC 6A series high pressure liquid chromatograph with SPD 6 AV UV/VIS detector equipped with a Rheodyne injector model 7125 (manual), (sensitivity 0.08 AUFS) with detection at the wavelength of 280 nm and with a Supelcosil LC 18 (10 μm particle size, 4.6 mm i.d. × 250 mm long) and a Supelco guard column. The mobile phase was acetonitrile-water (1% acetic acid), 40:60 (v/v) flowing at 1.5 mL min–1.
The test samples were prepared by dissolving puree (1 g) into 25 mL ethyl acetate, centrifuging at 2400 r.p.m. (Remi Engineering, New Delhi, India) for 10 min, decanting the liquid and evaporating it by keeping at room temperature and making up to a total volume of 1 mL. The calibration curve was constructed by injecting known concentrations of solutions of pure capsaicin (viz. 5, 10, 15 and 20 μL) (Sigma Chemical Co., MO) in HPLC grade ethyl-acetate and recording the resulting peak area. Peak area vs. capsaicin content was linear throughout the concentration range studied (R2=0.999). The capsaicin content of the samples was calculated as μg/g by comparing sample peak areas with pure capsaicin. Each experiment was repeated thrice and the average values were used in the analysis.
Results and discussion
Total soluble solids and pH values of green chilli puree were 4.8oBrix and 5.08, respectively.
Effect of temperature on colour degradation kinetics
The L, a and b values of the fresh green chilli pureed through 14 mesh screens were 47.24, –10.42 and 22.76, respectively, and were used as the reference for colour measurement. The initial –a value decreased and equalled –0.31 when heating time was increased to 600 min, this was found to be independent of temperature. The –a∞ value was further verified by treating the puree in concentrated hydrochloric acid solution in order to facilitate complete conversion of chlorophylls to pheophytins. The same value of –a∞ was obtained which supports the observation of Steet & Tong (1996) that –a∞pertained to the colour value when all of the chlorophyll degraded to pheophytin and that it was independent of temperature.
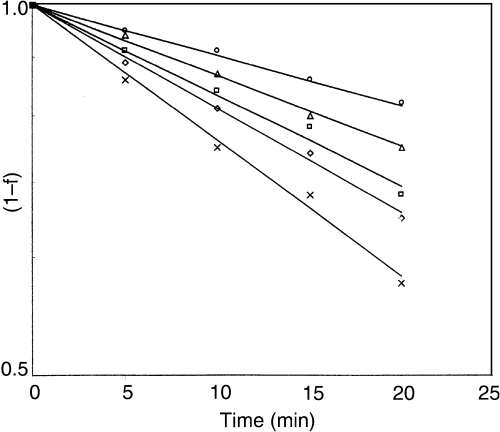
The rate and reaction order of colour degradation of green chilli puree was determined by linear regression of ln(1 – f ) vs. heating time (eq. 4). Solid lines in Fig. 1 represent values as computed from eq. (4). It is obvious from Fig. 1 that green colour degradation of chilli puree followed first-order reaction kinetics (R2 > 0.986).

First-order colour (Hunter a value) degradation kinetics of green chilli puree at selected temperatures (○ 50 °C; Δ 60 °C; • 70 °C; ◊ 80 °C; × 90 °C).
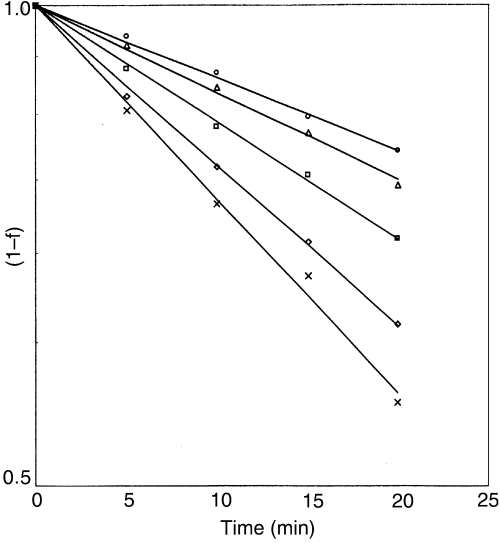
Variation in Hunter –a values represent the visual green colour of the product; but in practice, any change in green colour is invariably associated with simultaneous change in L and b values. Representation of quality in terms of total colour may therefore be more relevant from the processors viewpoint. Therefore, different combinations of tristimulus L, a, b values (i.e. Lab, La/b, Lb/a, L/ab) were selected to ascertain their effect on the total colour change of chilli puree. Correlation coefficient and s.e. values were used as the basis to select the combination which best described the first order reaction for the entire temperature range. It was found that L × a × b was the most appropriate combination, which described closely the first order reaction kinetics of total colour degradation of green chilli puree for the temperature range, used in this study (Fig. 2). The L and b values corresponding to a∞ were considered as the respective values at infinite time. In terms of total colour, eq. (2) may be expressed as

First-order total colour (Hunter L × a × b value) degradation kinetics of green chilli puree at selected temperatures (○ 50 °C; Δ 60 °C; • 70 °C; ⋄ 80 °C; × 90 °C).

The values of the coefficients of determination were between 0.994 and 0.998 while the s.e. values were less than 0.0009. This finding is consistent with the results reported elsewhere by Ahmed et al. (2000) on thermal processing of green chilli puree with high pungency (variety: CH 1). While working on thermal processing of pea puree, Shin & Bhowmik (1994) argued that all the three parameters should be combined together and found La/b as the optimum combination to describe total colour degradation.
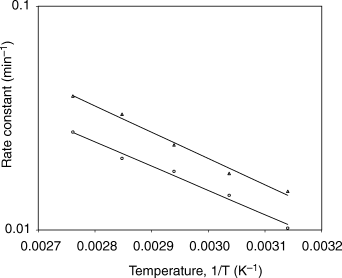
The effect of temperature on the rate constant is depicted in Fig. 3. The data indicated that the dependence of the rate constant on the temperature obeyed the Arrhenius relationship (R2 > 0.985). The activation energy values for colour degradation were 23.04 and 25.02 kJ mol–1 for green- and total-colour, respectively. Higher activation energy signifies greater heat sensitiveness of total colour degradation during thermal processing. Total colour includes the changes caused by non-enzymatic browning in addition to the degradation of green colour. Total colour may therefore be used as the quality indicator instead of green colour during thermal processing of green chilli puree.

Variation of colour degradation rate constant with temperature (○ green colour; Δ total colour).
Rheological behaviour
Apparent viscosity decreased with increased rate of shear indicating that the puree exhibited shear thinning behaviour (Fig. 4). The relationship between apparent viscosity and rotational speed (speed being directly proportional to shear rate) of spindle was represented using eq. (7)

Effect of rotational speed on apparent viscosity of green chilli puree at selected temperatures (o 50 °C; Δ 70 °C; • 90 °C).

where, η is apparent viscosity (Pa s), RPM is rotational speed of spindle, and A and B are coefficients. The values of coefficient A were 141.8, 119.2, 120.8, 81.78 and 70.35 corresponding to 50, 60, 70, 80 and 90 °C, respectively. The corresponding –B values were 0.942, 0.920, 0.961, 0.887 and 0.927, respectively. It is obvious from Fig. 4 that eq. (7) was able to describe well (R2 > 0.974) the variation of apparent viscosity with rotational speed for the entire temperature range. Coefficient A decreased with increase in temperature while the variation of B with temperature was not consistent.
Effect of temperature on apparent viscosity
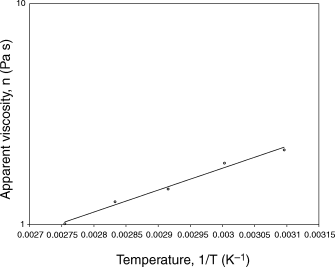
The temperature dependence of apparent viscosity (η) at 100 r.p.m. was described by the Arrhenius model (Fig. 5)

The Arrhenius plot relating apparent viscosity at 100 r.p.m. to temperature.

where, Aη is Arrhenius constant and Eη is activation energy values as a result of apparent viscosity at 100 r.p.m.; R is universal gas constant, T is absolute temperature.
The coefficients of eq. (8) were computed using the least-squares technique. The computed values of Aη and Eη were 0.002 Pa and 19.22 kJ mol–1, respectively. The coefficient of determination equalled 0.987. A varietal effect on flow properties of green chilli puree was observed. While working on an unknown commercial variety of green chilli, Ahmed et al. (1999) found an activation energy value of 6.4 kJ mol–1. Vitali & Rao (1984) and Manohar et al. (1991) have reported activation energy values of 23.33 and 18.65 kJ mol–1, respectively, for orange and tamarind juice concentrates.
Fresh green chilli puree contained 559 μg g–1 of capsaicin. Thermal processing of the puree at 85 °C for 15 min resulted in 19.1% loss of capsaicin. The observed pungency for Punjab Selection-27 variety value was considerably lower than that of commercial CH-1, African and Nigerian varieties (8.3–10.0 mg g–1) (Mathew et al., 1971; Hundal, 1999) but higher than bell capsicum (20 μg g–1) (Chand & Govindarajan, 1985). The SHU of the fresh and heat-treated puree were 8500 and 7480, respectively.
Conclusion
The kinetics of colour degradation of green chilli puree followed first order kinetics. The combination L × a × b can be used to predict the variation of total colour in green chilli puree. The rate constant increased with temperature and the dependence could be described using the Arrhenius equation. The computed values of activation energy were 23.04 and 25.02 kJ mol–1 respectively for green- and total- colour degradation. Higher activation energy value signified greater heat sensitiveness of total colour during thermal processing of puree. Pungency in terms of capsaicin content and SHU decreased during thermal processing. Green chilli puree behaved as a shear-thinning fluid and the Arrhenius law described the relation between apparent viscosity and temperature.


