


Abstract
Ghrelin is known to act on the area postrema (AP), a sensory circumventricular organ located in the medulla oblongata that regulates a variety of important physiological functions. However, the neuronal targets of ghrelin in the AP and their potential role are currently unknown. In this study, we used wild-type and genetically modified mice to gain insights into the neurons of the AP expressing the ghrelin receptor [growth hormone secretagogue receptor (GHSR)] and their role. We show that circulating ghrelin mainly accesses the AP but not to the adjacent nucleus of the solitary tract. Also, we show that both peripheral administration of ghrelin and fasting induce an increase of c-Fos, a marker of neuronal activation, in GHSR-expressing neurons of the AP, and that GHSR expression is necessary for the fasting-induced activation of AP neurons. Additionally, we show that ghrelin-sensitive neurons of the AP are mainly γ-aminobutyric acid (GABA)ergic, and that an intact AP is required for ghrelin-induced gastric emptying. Overall, we show that the capacity of circulating ghrelin to acutely induce gastric emptying in mice requires the integrity of the AP, which contains a population of GABA neurons that are a target of plasma ghrelin.
Ghrelin is a 28–amino acid octanoylated peptide hormone predominantly secreted from endocrine cells of the gastric mucosa (1). The actions of ghrelin are mediated by the growth hormone secretagogue receptor (GHSR), a G protein–coupled receptor highly expressed in the brain (2). The effects of ghrelin in the central nervous system are diverse and include modulation of the growth hormone secretion, food intake, blood glucose homeostasis, stress responses, and gastrointestinal tract motility, among others (3). Some of these actions of ghrelin, including ghrelin-induced food intake and gastric emptying, occur within minutes after its systemic administration in mice (4). Because ghrelin transport to the brain across the brain–blood barrier is very low (5), the rapid central effects of circulating ghrelin likely involve brain areas with fenestrated capillaries such as the circumventricular organs. In this regard, it has been shown that plasma ghrelin can passively and rapidly diffuse through the fenestrated capillaries of the median eminence, which is located in close apposition to the hypothalamic arcuate nucleus, where ghrelin activates specific neurons that mediate its orexigenic actions (6, 7). Other studies suggest that the area postrema (AP), a key sensory circumventricular organ, is also a central target for the effects of circulating ghrelin (6, 8); however, the neuronal targets of ghrelin in the AP and its potential role are unclear.
The AP is located in the medulla oblongata within the caudal brainstem and forms a part of the dorsal vagal complex (DVC), which also consists of the nucleus of the solitary tract (NTS) and the dorsal motor nucleus of the vagus (DMV). The DVC serves as a major reflex center of the autonomic nervous system in which the NTS contains the visceral sensory neurons that receive and integrate information from visceral structures, and the DMV contains the efferent cholinergic motor neurons that receive most of their input from the NTS and innervate a variety of visceral structures, particularly the gut wall (9). The AP contains a set of sensory neurons that monitor the levels of circulating factors and then transfer this information to other brain areas, including the NTS, to regulate a variety of physiological reflexes (10). A subset of AP neurons express GHSR (2, 11), and peripherally administered ghrelin increases the marker of cellular activation c-Fos in some AP cells (6, 8, 12). Electrophysiological recordings of isolated AP neurons have also shown that ghrelin affects the membrane potential of a fraction of them (13). Notably, we have recently shown that the AP, together with the arcuate nucleus/median eminence region, is one the few brain areas directly accessible to circulating ghrelin (6). Thus, it seems that the AP is a key site mediating the effects of circulating ghrelin on the DVC. The NTS also contains a high density of GHSR-expressing cells (2), but previous observations that AP ablation impairs ghrelin-induced increase of c-Fos in the NTS have favored the notion that the AP is the primary target of ghrelin within the DVC (8). To our knowledge, however, no study has dissected the specific neuronal targets of circulating ghrelin within the AP and their role. Interestingly, it has been suggested that the DVC is a key regulator of ghrelin-induced gastric emptying (14), and gastric prokinetic actions of ghrelin are currently under investigation as a potential treatment of gastroparesis and delayed gastric emptying (15). Thus, it would be very valuable to gain a better understanding of the neuronal circuits through which ghrelin regulates the DVC function.
The goal of the present study was to gain insight into the role of the AP as a target of ghrelin. Overall, we confirmed that the AP is the only DVC site accessible to circulating ghrelin, and identified the phenotype of those AP neurons responsive to ghrelin. Also, we showed that an intact AP is required for ghrelin-induced gastric emptying.
Materials and Methods
Mice
This study was performed using 3- to 5-month-old male mice generated in the animal facility of the Instituto Multidisciplinario de Biología Celular. Experimental animals included the following. (1) Wild-type mice, on a pure C57BL/6 background. (2) GHSR-enhanced green fluorescent protein (eGFP) mice, in which the eGFP is under the control of the GHSR promoter (16). These mice [originally from the Mouse Mutant Regional Resource Center Repository, Tg(Ghsr-EGFP)KZ65Gsat; stock no. 030942] were derived from crosses between hemizygous animals backcrossed >10 generations onto a C57BL/6 genetic background. (3) Gad2-tdTomato mice, in which tdTomato red fluorescent protein is expressed in γ-aminobutyric acid (GABA) Gad2-expressing neurons. These mice were generated by crossing Gad2-CreER mice and Ai14 mice. Gad2-CreER mice [originally from The Jackson Laboratory, Gad2tm1(cre/ERT2)Zjh/J; stock no. 010702] express a tamoxifen-inducible Cre recombinase under the endogenous promoter elements of the Gad2 gene (17). Ai14 mice [originally from the Allen Institute, 129S6-Gt(ROSA)26Sortm14(CAG-tdTomato)Hze/J; stock no. 007908] harbor a targeted mutation of the Gt(ROSA)26Sor locus with a loxP-flanked STOP cassette preventing the transcription of the tdTomato (18), which is expressed only following Cre-mediated recombination. The Gad2-CreERT2 and Ai14 mice were bred with pure wild-type C57BL/6 mice for at least eight generations after their arrival to the Instituto Multidisciplinario de Biología Celular. Two-month-old Gad2-tdTomato mice received a daily dose of tamoxifen [70 mg/kg body weight (BW), intraperitoneally] or vehicle (sesame oil) for 4 consecutive days to induce Cre recombination. After 3 weeks, the pattern of red fluorescent cells displayed the distribution of Gad2 expression, as previously shown (17). (4) GHSR-eGFP/Gad2-tdTomato mice, in which tdTomato is expressed in GABA Gad2-expressing cells and eGFP is expressed in GHSR-expressing cells. These mice were generated by crossing Gad2-tdTomato mice and GHSR-eGFP or GHSR-eGFP/Ai14 mice. GHSR-eGFP/Gad2-tdTomato mice were injected with tamoxifen as described above. (5) GHSR-null mice, which fail to express the GHSR (19), were derived from crosses between heterozygous animals backcrossed >10 generations onto a C57BL/6 genetic background. All mice were housed in a 12-hour light/dark cycle in standard environmentally controlled conditions with regular chow and water available ad libitum, except when indicated otherwise.
Ethics statement and animal care
All experiments received approval from the Institutional Animal Care and Use Committee of the Instituto Multidisciplinario de Biología Celular (ID no. 10-0112). This study was carried out in strict accordance with the recommendations in the Guide for the Care and Use of Laboratory Animals of the US National Research Council, and all efforts were made to minimize suffering. To reveal an effect of endogenous rises in circulating ghrelin at the AP, we needed to use 48 hours of food deprivation because mice fasted such length of time showed a significant increase of the number of cells positive for c-Fos in the AP, as compared with the number found in ad libitum fed mice, that was not detected in mice fasted 24 hours (unpublished observations). Importantly, 48-hour fasting is a manipulation fully tolerated by wild-type mice that display a normal overall health status and locomotor activity (20). All mice were individually housed 3 days before starting the experiments, which were performed in the morning, between 9:00 am and 11:30 am.
Analysis of DVC sites responsive to circulating ghrelin
In this study, we peripherally injected a fluorescent ghrelin tracer into mice and then mapped the distribution of the tracer as well as the induction of phosphorylated extracellular signal-regulated kinase (p-ERK) in the DVC. Specifically, ad libitum fed wild-type mice were subcutaneously injected with either phosphate-buffered saline (PBS) alone or containing 0.3 nmol/g BW of fluorescein-ghrelin (n = 4 and 5, respectively). The fluorescent ghrelin (F-ghrelin) is an analog of the hormone ghrelin with a fluorescein moiety attached at its C terminus. F-ghrelin behaves similarly to ghrelin and can be used to study both binding and uptake of this hormone (21). Importantly, we have validated the specificity of this tracer by showing that F-ghrelin: (1) is bioactive in vivo; (2) labels the mouse brain with a pattern similar to that seen for GHSR messenger RNA (mRNA) expression; and (3) fails to label brain nuclei of GHSR-null mice (11). F-ghrelin was provided by Dr. L.G. Luyt from the University of Western Ontario (London, ON, Canada). Thirty minutes after treatment, mice were anesthetized and perfused, as described previously (22). Brains were dissected and processed to generate three equivalent series of 40-µm-thick coronal brain sections, which were used for immunohistochemistry. Two series of sections of each animal were pretreated with 0.5% H2O2 and treated with blocking solution (3% normal donkey serum and 0.25% Triton-X in PBS). A series of sections of each animal were incubated with either a goat anti-fluorescein antibody (Table 1) for 48 hours at 4°C, or a goat anti–p-ERK antibody (Table 1) overnight at room temperature. Next, all sections were treated with biotinylated donkey anti-goat antibody (Vector Laboratories, catalog no. BA-5000; 1:1000), and then with a Vectastain Elite ABC kit (Vector Laboratories, catalog no. PK-6200), according to the manufacturer’s protocols. Finally, a visible signal was developed with diaminobenzidine (DAB)/nickel solution, giving a black/purple precipitate. Antifluorescein immunostaining is specific, as immunostained brain sections of vehicle-treated mice display similar background signal as detected in negative control samples, in which either the primary or secondary antibody was omitted in the staining procedure (11).
Antibodies Used
| Peptide/Protein Target | Name of Antibody | Source | Species Raised in; Monoclonal or Polyclonal | Dilution Used | RRID |
|---|---|---|---|---|---|
| Fluorescein/Oregon Green | Antifluorescein/Oregon Green® | Molecular Probes, catalog no. A-11096 | Goat; polyclonal | 1:1500 | AB_221558 |
| p-ERK1/2 | p-ERK1/2 antibody (Thr202/Tyr204) | Santa Cruz Biotechnology, catalog no. SC-16982 | Goat, polyclonal | 1:500 | AB_2139990 |
| c-Fos | c-Fos antibody (H-125) | Santa Cruz Biotechnology, catalog no. SC-7202 | Rabbit; polyclonal | 1:4000 (chromogenic IHC); 1:1000 (fluorescent IHC) | AB_2106765 |
| GFP | GFP tag polyclonal antibody | Molecular Probes, catalog no. A-6455 | Rabbit; polyclonal | 1:20,000 | AB_221570 |
| TH | TH antibody (H-196) | Santa Cruz Biotechnology, catalog no. SC-14007 | Rabbit; polyclonal | 1:20,000 (chromogenic IHC); 1:5000 (fluorescent IHC) | AB_671397 |
Abbreviations: IHC, immunohistochemistry; RRID, Research Resource Identifier; TH, tyrosine hydroxylase.
Analysis of the responsiveness of eGFP cells of the DVC to exogenously administered ghrelin
In this study, we mapped the induction of c-Fos in the AP and the NTS of GHSR-eGFP mice that had been peripherally or centrally injected with ghrelin. A set of GHSR-eGFP mice (n = 6 per group) was subcutaneously injected with PBS alone or containing 0.3 nmol/g BW of ghrelin (Global Peptide, catalog no. PI-G-03). Another set of GHSR-eGFP mice was stereotaxically implanted with an intracerebroventricular (ICV) guide cannula in the lateral ventricle (placement coordinates: anteroposterior, −0.34 mm, lateral, +1 mm; ventral, −2.3 mm). Seven days after surgery, mice (n = 6 per group) were ICV injected with 2 µL of vehicle (artificial cerebrospinal fluid) alone or containing ghrelin (0.3 nmol per mouse). Mice were anesthetized and perfused 2 hours after treatment. Brains were dissected and coronally cut, as described above. In these experimental conditions, centrally injected ghrelin reaches most of its brain targets, including the DMV and the NTS (2, 11). The location of the cannula injectors into the lateral ventricle was verified at the end of the experiment by the histological analysis of the brain sections. For immunohistochemistry, sections were pretreated as indicated above and then incubated with a rabbit anti–c-Fos antibody (Table 1) for 48 hours at 4°C. Then, sections were incubated with biotinylated anti-rabbit antibody (Vector Laboratories, catalog no. BA-1000; 1:3,000). Visible signal was developed with the Vectastain Elite ABC kit and a DAB/nickel solution, as also described above. Then, c-Fos immunostained sections were incubated with a rabbit anti-eGFP antibody (Table 1) for 48 hours, and sequentially incubated with a secondary antibody and the Vectastain Elite ABC kit, as detailed above. Finally, visible signal was developed with DAB solution, which generates a brown precipitate.
Analysis of the responsiveness of eGFP cells of the DVC to endogenous increments of plasma ghrelin
In this study, we mapped the induction of c-Fos in the AP and the NTS of GHSR-eGFP mice that had been fasted. In particular, GHSR-eGFP mice were kept ad libitum fed (n = 5) or fasted (n = 6) by removing their food at 10:00 am. After 48 hours, animals were weighed, and mouse brains were obtained and processed for double immunohistochemistry against c-Fos and eGFP as described above. Blood samples were collected from mouse tails immediately before perfusion, and plasma glucose and ghrelin levels were determined using an enzymatic colorimetric assay (Weiner Laboratory) or a ghrelin enzyme immunoassay kit (Cayman Chemical Company), according to the manufacturer’s instructions. Visceral fat pads were dissected from perfused mice and weighed. In an independent study, we also mapped the induction of c-Fos in the AP of 48-hour fasted wild-type mice that received, or not, fluid replacement (n = 5 per group) with two daily injections of sterile warm saline (0.01 mL/g BW). The brains of these mice were obtained and processed for immunohistochemistry against c-Fos, as described above.
Analysis of the requirement of ghrelin signaling for the fasting-induced activation of the AP cells
In this study, we quantified the induction of c-Fos in the AP of fed and fasted GHSR-null mice. In particular, wild-type and GHSR-null mice were kept ad libitum fed or fasted by removing their food at 10:00 am. In this experiment, we used a total of 23 mice that were divided as follows: wild-type fed (n = 4), GHSR-null fed (n = 6), wild-type fasted (n = 6), and GHSR-null fasted (n = 7). After 48 hours, mouse brains were obtained and processed for immunohistochemistry against c-Fos, as described above.
Characterization of the phenotype of eGFP cells of the AP
In this study, we tested whether eGFP neurons of the AP of the GHSR-eGFP mice were catecholaminergic or GABAergic. In both cases, we tested whether each neuronal type either expresses eGFP or increases c-Fos in response to ghrelin. In one case, a red fluorescent immunostaining against tyrosine hydroxylase (TH), the gold standard marker in the identification of catecholaminergic neurons, was performed. Thus, brain sections of GHSR-eGFP mice (n = 4) were treated with blocking solution and incubated with a rabbit anti-TH antibody (Table 1) for 48 hours at 4°C. Then, sections were incubated with an Alexa Fluor 594 anti-rabbit antibody (Molecular Probes, catalog no. A21207; 1:1000) for 2 hours. Additionally, we performed a double chromogenic immunostaining against c-Fos and TH in coronal brain sections of wild-type mice that had been subcutaneously treated with either vehicle (n = 5) or ghrelin (0.3 nmol/g BW, n = 3) and perfused 2 hours afterward. The immunostaining against c-Fos and TH was performed using the double immunohistochemistry strategy described above, but using a rabbit anti-TH antibody (Table 1) instead of the anti-eGFP antibody. To test whether eGFP-expressing cells of the AP were GABAergic, we mapped the colocalization of red and green cells in the AP of brain sections of the GHSR-eGFP/Gad2-tdTomato mice (n = 3). Additionally, we performed an immunostaining against c-Fos in brain sections of Gad2-tdTomato mice that had been subcutaneously treated with either vehicle (n = 3) or ghrelin (0.3 nmol/g BW, n = 4) and perfused 2 hours afterward. In this case, brain sections were treated with blocking solution and incubated with anti–c-Fos antibody (Table 1) for 48 hours at 4°C. Then, sections were incubated with an Alexa Fluor 488 anti-rabbit antibody (Molecular Probes, catalog no. A-11008; 1:1000) for 2 hours.
Neuroanatomical quantitative analysis
Bright-field images were acquired with a DS-Ri1 Nikon digital camera. Fluorescent images were acquired with a laser-scanning Olympus FV1000 confocal microscope with emission filters of 490 to 540 nm for eGFP detection (laser 473 nm) and 575 to 675 nm for Alexa 594 or tdTomato detection (laser 559 nm). All images were taken in comparable areas and under the same optical and light conditions. Anatomical limits of the AP and NTS were identified using a mouse brain atlas (23), together with coronal brain sections of wild-type mice stained with thionin (0.025%, Sigma-Aldrich, catalog no. T7029). Quantitative analyses were performed on every third section between bregma −7.20 and −7.92 mm for the AP and between bregma −6.24 and −7.76 mm for the NTS; thus, at least five sections containing the AP and 10 sections containing the NTS were analyzed per mouse. For quantification of the fluorescein-immunoreactive (IR) and p-ERK-IR chromogenic signals, 16-bit color photomicrographs were converted into 32-bit grayscale images and their optical density (OD) was calculated by taking the negative decimal logarithm of the original gray values divided by the corresponding values from a white flat-field image using the software Fiji (National Institutes of Health). The mean OD was determined in the AP, the NTS, and the medullary reticular nucleus, which was used as a control region because it does not express GHSR and, as a consequence, no fluorescein-IR or p-ERK signals were expected or detected. The fluorescein-IR and the p-ERK-IR signals are expressed as relative OD per section, as compared with the mean OD value in the medullary reticular nucleus, and then normalized to the levels found in the vehicle-treated group. For c-Fos immunostaining, the total number of cells containing a nuclear purple-black precipitates signal (c-Fos+ cells) was estimated in the AP and the NTS. To quantify c-Fos induction in specific neuronal types, all eGFP-IR (eGFP+) cells, TH-IR (TH+) cells, or tdTomato+ cells that were c-Fos+ and c-Fos− were counted in each case. To estimate the phenotype of the AP eGFP-expressing cells, the total number of green fluorescence– and/or red fluorescence–labeled cells was quantified in AP of either brain slices of GHSR-eGFP mice immunostained against TH or brain slices of GHSR-eGFP/Gad2-tdTomato mice. All data were corrected for double counting, according to the method of Abercrombie (24), where the ratio of the actual number of neurons or cell nuclei to the observed number is represented by T/(T + h), where T is section thickness and h is the mean diameter of the neuron or cell nuclei along the z-axis. The mean diameter of the neurons or cell nuclei was determined using Fiji. Blind quantitative analysis was performed independently by at least two observers in one series per animal.
Analysis of the requirement of the AP for the ghrelin-induced gastric emptying
To ablate the AP, anesthetized wild-type mice were subjected to a surgical incision between the occipital crest and midcervical region. The foramen magnum was slightly enlarged, exposing the AP. The AP was aspirated with a 25-gauge needle and the skin was closed in a set of mice (AP-ablated), whereas the skin was sutured without any manipulation in another set of mice (AP-intact). Mice were daily treated with flunixin meglumine (Flumeg 5%) for 4 consecutive days to reduce inflammation and maintained with ad libitum access to food and water. After 1 week, ghrelin-induced food intake was assessed in a cross-over designed manner. In particular, mice were subcutaneously treated with PBS alone or containing ghrelin (0.3 nmol/g BW) in a randomized alternating scheme on consecutive days. Food intake was calculated by subtracting the remaining food weight 2 hours after treatment from the initial food weight. After 4 days, the gastric emptying was measured using the gold standard phenol red method (25). Briefly, ad libitum fed mice were administered with 0.1 mL of test solution (0.5 mg/mL phenol red and 5% glucose in water) by oral gavage using a bulb-tipped gastric feeding needle. After 1 minute, mice were subcutaneously injected with either vehicle alone or containing ghrelin (0.3 nmol/g BW). After 20 minutes, anesthetized mice were euthanized by decapitation and their stomachs were exposed by laparotomy, quickly ligated at both the pylorus and the esophagus–gastric junction, and removed. Stomachs and their contents were homogenized in 0.1 N NaOH; proteins were precipitated using 20% trichloroacetic acid and further centrifugation. Finally, supernatants were mixed with 4 M NaOH, and the 540 nm absorbance was measured. The gastric emptying was expressed as a percentage and calculated according to the following equation: [1 − (absorbance in test stomach/average of initial absorbance)] × 100. The initial absorbance was obtained with an independent group of mice (n = 3), which was euthanized 1 minute after the administration of the test solution, and their stomachs were processed as described above. After the assessment of gastric emptying, brains were dissected, fixed overnight in 4% formaldehyde, and coronally cut. Then, the sections were mounted, stained with thionin, and used to estimate the extent of the AP lesion. Mice with partial lesions of the AP or significant lesions of the NTS were excluded from the analysis. After the confirmation of the complete AP ablation, a total of 41 mice were included in the analysis and grouped as follows: vehicle-treated AP-intact (n = 18), ghrelin-treated AP-intact (n = 12), vehicle-treated AP-ablated (n = 5), and ghrelin-treated AP-ablated (n = 6).
Statistical analysis
Data are expressed as the mean ± standard error of the mean (SEM). Equality of variance was analyzed using Bartlett’s test. t test was performed to compare data from vehicle- vs ghrelin- or F-ghrelin–treated mice. Two-way analysis of variance (ANOVA) followed by the Bonferroni test was used to compare data from experiments of fasting and of gastric emptying. Significant differences were considered when P < 0.05.
Results
Peripherally administered ghrelin impacts the AP but not the NTS
First, we analyzed if circulating ghrelin accesses the AP and the NTS, which are the components of the DVC with highest density of GHSR-expressing cells (2, 16). For this purpose, we subcutaneously injected mice with F-ghrelin and mapped the presence of this tracer in the AP and the NTS [Fig. 1(a)]. Because fluorescence lifetime of F-ghrelin is short, we used an antifluorescein antibody followed by chromogenic immunostaining to stabilize the signal and increase the sensitivity of the assay (11). As compared with vehicle-treated mice, F-ghrelin–treated mice showed a significant increase of fluorescein-IR signal intensity in the AP, whereas no significant differences were detected in the NTS [Fig. 1(b) and 1(c)]. Additionally, we studied the activation of the ERK signaling, as a direct marker of ghrelin action (26), to further characterize the primary targets of circulating hormone within the DVC [Fig. 1(d)]. Quantitative analysis indicated that F-ghrelin–treated mice showed a significant increase of p-ERK-IR signal intensity in the AP, whereas no significant differences were detected in the NTS [Fig. 1(e) and 1(f)]. Thus, peripherally administered F-ghrelin accesses and directly activates the AP region of the DVC.

Peripherally administered F-ghrelin exclusively impacts the AP component of the DVC. (a and d) Representative images of DVC of vehicle- and F-ghrelin–treated mice (n = 4 and 5, respectively) subjected to chromogenic immunostaining against fluorescein and p-ERK, respectively. Insets in each image show high magnification of the areas marked in low-magnification images. Scale bars, 100 and 10 µm for the low- and high-magnification images, respectively. Bar graphs of quantitative analysis of fluorescein-IR (b and c) and p-ERK-IR ODs (e and f) are shown. Data represent the mean ± SEM. *P < 0.05 vs vehicle group. SC, subcutaneous.
Peripherally administered ghrelin activates GHSR-expressing cells of the AP and fails to activate GHSR-expressing neurons of the NTS
To better characterize the response to ghrelin of the different DVC components, we used GHSR-eGFP mice, in which eGFP expression reports on the location of GHSR-expressing cells. We have recently shown that eGFP+ cells are detected in all three nuclei of the DVC of the GHSR-eGFP mice and that they show a high degree of colocalization with GHSR mRNA, indicating that these mice are a useful tool for studying GHSR function in the brainstem (16). We have also shown that visualization of eGFP+ neurons within this mouse model by either direct detection of eGFP fluorescence or chromogenic immunostaining displays a very similar neuroanatomical pattern of signal (16). The neuroanatomical analysis of eGFP cells reported in the present study was performed using chromogenic immunostaining because this strategy is more sensitive due to the amplification steps of the reaction. Within the AP, the number of eGFP+ neurons was quantified as 837 ± 74. These cells were relatively homogeneous, mostly small sized (average diameter, 9.2 ± 0.2 µm) and dark stained as compared with eGFP neurons within the other DVC regions. The AP eGFP neurons were densely packed, and most of them displayed a single ventrolaterally projecting fiber [Fig. 2(a)].
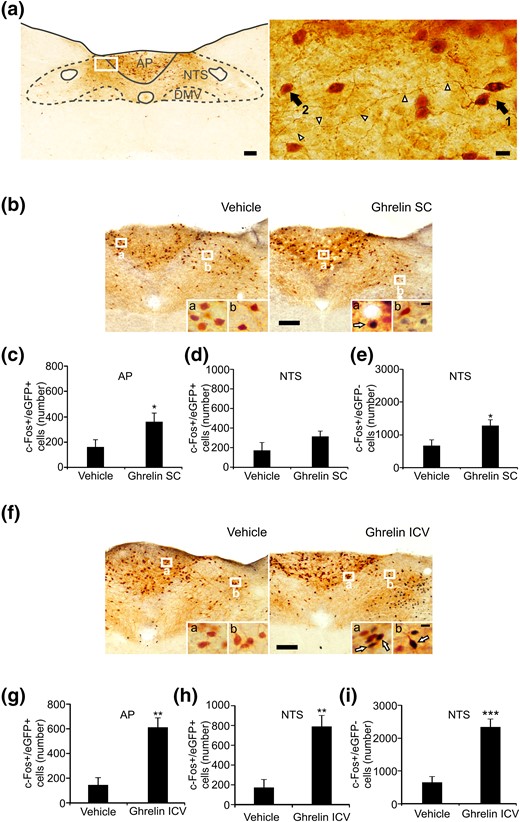
Peripherally administered ghrelin exclusively impacts GHSR-expressing cells of the AP of GHSR-eGFP mice. (a) Distribution pattern of eGFP+ cells within the DVC of GHSR-eGFP mice. Right photomicrograph shows a higher magnification of the area marked in the low-magnification photomicrograph (left). Arrow 1 points to the cell body of an eGFP cell located in the AP and arrowheads point to its axon. Arrow 2 points to the cell body of an eGFP cell located in the NTS. Scale bars, 100 μm (low magnification), 10 μm (high magnification). (b and f) Representative low-magnification images of the DVC of vehicle- and ghrelin-treated GHSR-eGFP mice subjected to double chromogenic immunostaining for c-Fos (circle-like black) and eGFP (gray) (n = 6 per group). Insets in each image show high magnification of the areas marked in low-magnification images. Arrows point to dual-labeled cells. Scale bars, 100 μm (low magnification), 10 μm (high magnification). (c, d, g, and h) Bar graphs displaying the number of eGFP+ cells positive for c-Fos in the AP and NTS in each experimental condition. (e and i) Bar graphs displaying the number c-Fos+ cells negative for eGFP in the NTS in each experimental condition. Data represent the mean ± SEM. *P < 0.05, **P < 0.01, ***P < 0.001 vs vehicle group. SC, subcutaneous.
Peripheral administration of ghrelin to wild-type mice increases the number of cells positive for c-Fos in both the AP and the NTS (6). To test the ability of GHSR-expressing neurons of the DVC to respond to circulating ghrelin, we peripherally administered ghrelin to GHSR-eGFP mice and mapped c-Fos in eGFP+ and eGFP− neurons [Fig. 2(b)]. Quantitative analysis was performed in both the AP and the NTS nuclei. As compared with vehicle-treated animals, ghrelin-treated GHSR-eGFP mice showed a significant increase in the number of c-Fos+/eGFP+ cells in the AP [Fig. 2(c)], representing 18.7% ± 5.9% vs 45.6% ± 8.2% of total AP eGFP+ cells, respectively, and failed to show a significant increase in the number of c-Fos+/eGFP− cells (23 ± 5 vs 11 ± 4 cells per AP, for ghrelin- and vehicle-treated mice, respectively, P = 0.082). In the NTS, ghrelin-treated GHSR-eGFP mice failed to show an increase in the number of c-Fos+/eGFP+ cells vs vehicle-treated animals [Fig. 2(d)], representing 14.4% ± 3.0% vs 8.2% ± 4.0% of total NTS eGFP+ cells, respectively, but showed a significant increase in the number of c-Fos+/eGFP− cells [Fig. 2(e)]. To test whether eGFP+ neurons of the NTS are able to increase c-Fos in response to ghrelin, we mapped c-Fos induction in the DVC of GHSR-eGFP mice ICV injected with ghrelin [Fig. 2(f)]. As compared with ICV vehicle-treated animals, GHSR-eGFP mice ICV treated with ghrelin showed a significant increase in the number of c-Fos+/eGFP+ cells in the AP [Fig. 2(g)], representing 16.8% ± 5.0% vs 71.7% ± 6.6% of total AP eGFP+ cells, respectively. In the NTS, GHSR-eGFP mice ICV treated with ghrelin showed a significant increase of the number of c-Fos+/eGFP+ cells [Fig. 2(h)], representing 40.9% ± 7.1% vs 8.6% ± 3.7% of total NTS eGFP+ cells, respectively, as well as of the number of c-Fos+/eGFP− cells [Fig. 2(i)]. None of these experimental manipulations affected the total number of eGFP+ cells in the AP or the NTS of GHSR-eGFP mice (not shown). Collectively, these data indicate that circulating ghrelin acts on GHSR-expressing neurons of the AP whereas it fails to activate GHSR-expressing neurons of the NTS, which can be activated by centrally administered ghrelin.
GHSR-expressing cells of the AP respond to 48-hour fasting
To test whether GHSR-expressing neurons of the AP are sensitive to endogenous rises in circulating ghrelin, we quantified the induction of c-Fos in eGFP-expressing neurons of the AP and the NTS of fasted GHSR-eGFP mice. Fasted mice displayed a good overall health status without signs of dehydration (i.e., displayed normal skin turgor) during the fasting period. As compared with ad libitum fed animals, fasted GHSR-eGFP mice lost ∼19% of BW and ∼65% of their body fat, and they displayed hypoglycemia as well as an increase of plasma ghrelin levels (Table 2). As compared with fed animals, fasted GHSR-eGFP mice displayed an increase of the number of c-Fos+/eGFP+ cells in the AP [Fig. 3(a) and 3(b)], representing 12.1% ± 2.8% vs 36.1% ± 5.4% of total AP eGFP+ cells, respectively, as well as an increase in the number of c-Fos+/eGFP− cells (20 ± 7 vs 585 ± 78 cells per AP for fed vs fasted mice, respectively, P < 0.05). In the NTS, fasted GHSR-eGFP mice failed to change the number of c-Fos+/eGFP+ cells as compared with fed GHSR-eGFP mice [Fig. 3(c)], representing 3.4% ± 1.3% vs 5.3% ± 1.8% of total NTS eGFP+ cells, respectively, but they displayed a significant increase of the number of c-Fos+/eGFP− cells [Fig. 3(d)]. Because food intake deprivation may affect body fluid homeostasis, we compared c-Fos induction in the AP of fasted wild-type mice that received, or not, fluid therapy in an independent experiment, in which we found similar numbers of c-Fos+ cells in both experimental groups (524 ± 94 and 464 ± 108, respectively).
Parameters of Ad Libitum Fed and Fasted GHSR-eGFP Mice
| Fed | Fasted | |
|---|---|---|
| BW, g | 25.4 ± 1.0 | 20.5 ± 0.7a |
| Visceral fat, g | 0.55 ± 0.06 | 0.19 ± 0.03a |
| Glucose, mg/mL | 138 ± 8 | 87 ± 11a |
| Ghrelin, pg/mL | 382 ± 43 | 701 ± 121a |
| Fed | Fasted | |
|---|---|---|
| BW, g | 25.4 ± 1.0 | 20.5 ± 0.7a |
| Visceral fat, g | 0.55 ± 0.06 | 0.19 ± 0.03a |
| Glucose, mg/mL | 138 ± 8 | 87 ± 11a |
| Ghrelin, pg/mL | 382 ± 43 | 701 ± 121a |
P < 0.05 vs fed mice.
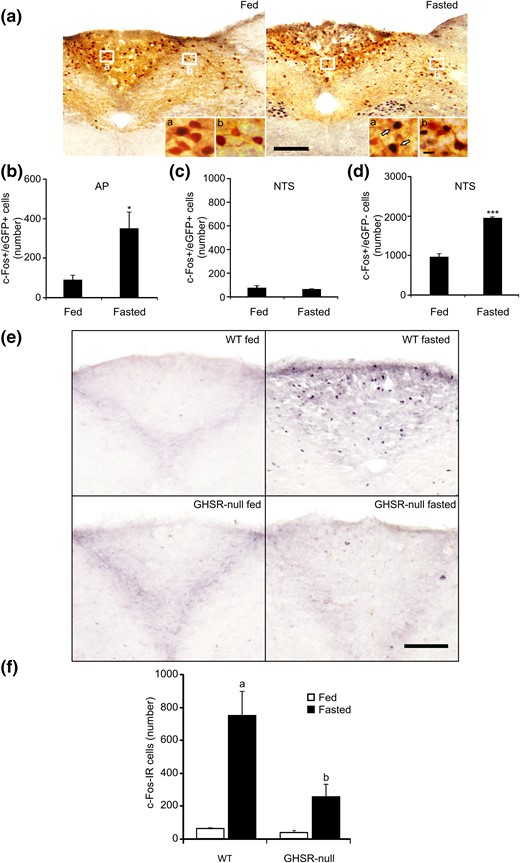
GHSR-expressing cells of the AP are activated by fasting, and fasting-induced activation of the AP requires GHSR signaling. (a) Representative low-magnification images of DVC of GHSR-eGFP mice ad libitum fed or 48-hour fasted subjected to double chromogenic immunostaining for c-Fos (circle-like black) and eGFP (gray) (n = 5 and 6, respectively). Insets in each image show high magnification of the areas marked in low-magnification images. Arrows point to dual-labeled cells. Scale bars, 100 μm (low magnification), 10 μm (high magnification). (b and c) Bar graphs displaying the number of eGFP+ cells positive for c-Fos in the AP and NTS in each experimental condition. (d) Bar graphs displaying the number c-Fos+ cells negative for eGFP in the NTS in each experimental condition. Data represent the mean ± SEM. *P < 0.05, ***P < 0.001 vs eGFP mice fed. (e) Representative low-magnification (×20) images of AP of wild-type and GHSR-null mice ad libitum fed or 48-hour fasted subjected to chromogenic immunostaining for c-Fos (circle-like black). Scale bar, 100 μm. (f) Bar graphs of quantitative analysis of the number of c-Fos-IR cells in the AP in each experimental condition. Data represent the mean ± SEM. aP < 0.001 vs wild-type fed; bP < 0.001 vs wild-type fasted.
Fasting-induced activation of AP neurons requires GHSR expression
To test whether ghrelin signaling is required for the fasting-induced increase of c-Fos in the AP, we quantified the number of c-Fos+ cells in the AP of wild-type and GHSR-null mice that had been ad libitum fed or 48 hours fasted [Fig. 3(e)]. Two-way ANOVA revealed a significant interaction between feeding status and genotype. In particular, fasted wild-type mice showed a significant increase of the number of c-Fos+ cells in the AP, as compared with fed wild-type animals. Fed GHSR-null mice displayed a similar number of c-Fos+ cells in the AP to that seen in fed wild-type mice. The number of c-Fos+ cells in the AP of fasted GHSR-null mice was ∼6.6-fold that of fed animals (P = 0.1076), and it was significantly smaller as compared with the number found in the fasted wild-type mice [Fig. 3(f)].
AP GHSR-expressing cells are GABA neurons
One of the main neuronal types within the AP is known to synthesize catecholamines (27). To test whether GHSR-expressing cells of the AP are catecholaminergic, we performed a red fluorescent immunostaining against TH in brain sections of GHSR-eGFP mice. No TH+/eGFP+ neurons were detected in the AP [Fig. 4(a)]. To determine whether ghrelin activates AP catecholaminergic neurons, we performed double immunostaining against TH and c-Fos in brain samples of wild-type mice peripherally treated with ghrelin, and we found that ghrelin-treated mice failed to show c-Fos+/TH+ cells in the AP [Fig. 4(b)].
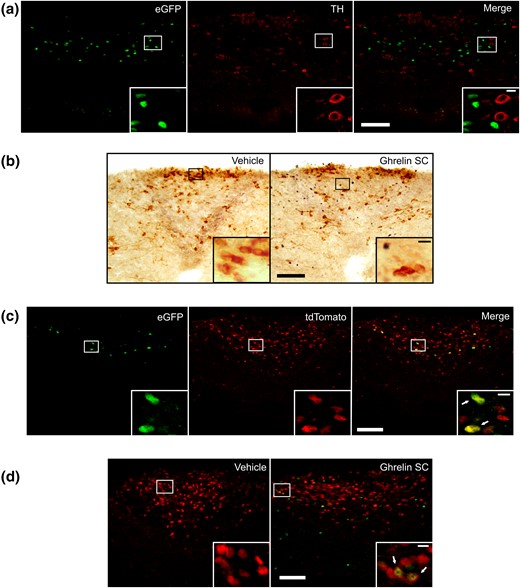
AP GHSR-expressing cells are GABA neurons. (a) Representative confocal photomicrographs of the AP of a GHSR-eGFP mouse subjected to fluorescent immunostaining against TH; left photomicrograph shows eGFP cells, middle photomicrograph shows TH-IR cells, and the right photomicrograph shows the merge of the respective left and middle images. (b) Representative low-magnification (×20) magnification images of the AP of vehicle- and ghrelin-treated wild-type mice subjected to double immunostaining for c-Fos (circle-like black) and TH (gray). (c) Representative confocal photomicrographs of the AP of a GHSR-eGFP/Gad2-tdTomato mouse; left photomicrograph shows eGFP cells, middle photomicrograph shows tdTomato cells, and right photomicrograph shows the merge of the respective left and middle images. (d) Representative confocal photomicrographs of the AP of vehicle- and ghrelin-treated Gad2-tdTomato mice subjected to fluorescent immunostaining against c-Fos (lighter circle-like signal). Inserts in each panel shows in high magnification the areas marked in low-magnification photomicrographs. Arrows point to dual-labeled cells. Scale bars, 100 μm (low magnification), 10 μm (high magnification).
Another key subset of neurons of the AP produces GABA (28). To test whether AP GHSR-expressing cells are GABAergic, we generated GHSR-eGFP/Gad2-tdTomato transgenic mice that express eGFP in GHSR-expressing cells and tdTomato in Gad2-expressing (GABAergic) cells. The distribution pattern of eGFP+ cells and tdTomato+ cells in the GHSR-eGFP/Gad2-tdTomato reporter mice was similar to that seen in each independent mouse model (not shown). The quantitative analysis of the degree of colocalization in the AP indicated that double tdTomato+/eGFP+ cells represent 69% ± 8% of the total AP eGFP+ cells and 18% ± 4% of the total AP tdTomato+ cells [Fig. 4(c)]. To test whether ghrelin activates AP GABAergic neurons, we analyzed c-Fos induction in the AP of Gad2-tdTomato mice peripherally treated with ghrelin. Ghrelin-treated mice displayed a significant increase of the percentage of c-Fos+/tdTomato+ cells in the AP, as compared with the percentage found in vehicle-treated mice [9% ± 2% vs 0% ± 0%, respectively, P < 0.05, Fig. 4(d)].
Ghrelin-induced gastric emptying is impaired in AP-ablated mice
The AP mediates the gastric emptying effects of other hormones (29), and ghrelin is able to induce gastric emptying in mice (30). Thus, we tested whether the effect of ghrelin on the gastric emptying requires an intact AP. For this purpose, we generated AP-intact and AP-ablated mice using a surgical strategy [Fig. 5(a)]. First, we tested the ability of ghrelin to increase food intake. We found that ghrelin-injected AP-intact mice significantly increase food intake, as compared with their own food intake in response to vehicle, and that ghrelin-injected AP-ablated mice also significantly increase food intake, as compared with their own food intake in response to vehicle [Fig. 5(b)]. Ghrelin-induced food intake did not significantly differ between AP-intact and AP-ablated mice, and no interaction between group and treatment was found by two-way ANOVA. Then, we tested the ability of ghrelin to affect gastric emptying [Fig. 5(c)]. Two-way ANOVA revealed no significant interaction between the effects of ablation and treatment. However, ghrelin-injected AP-intact mice showed a significant increase of the percentage of gastric emptying, as compared with vehicle-injected AP-intact mice (P < 0.01), whereas ghrelin-injected AP-ablated mice failed to increase the percentage of gastric emptying, as compared with vehicle-injected AP-ablated mice.
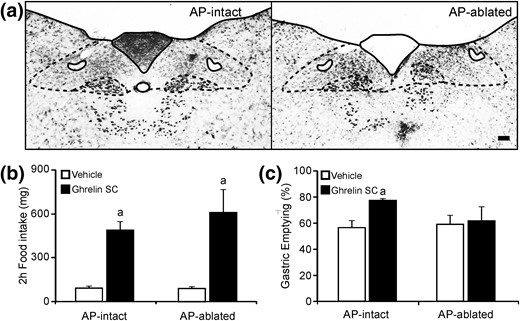
Ghrelin-induced gastric emptying is impaired in AP-ablated mice. (a) Representative images of thionin staining of the DVC of AP-intact and AP-ablated animals. Scale bars, 100 μm. (b and c) Bar graphs representing the 2-hour food intake and the percentage of gastric emptying, respectively, in AP-intact or AP-ablated mice treated with either vehicle or ghrelin. Data represent the mean ± SEM. aP < 0.05 vs vehicle groups.
Discussion
The AP is one of the most highly vascularized regions in the brain (31); because this dense vascular supply is devoid of a blood–brain barrier, AP cells are permanently exposed to circulating molecules, including ghrelin (10). GHSR is highly expressed in the AP, and ghrelin increases c-Fos levels as well as the electrical activity of some AP neurons (2, 6, 13). Thus, our finding that peripherally administered F-ghrelin accesses and increases p-ERK in the AP was expected. Our studies using GHSR-eGFP mice showed that peripherally administered ghrelin increases c-Fos levels exclusively in GHSR-expressing cells of the AP, which, in turn, send projections toward other brain areas. In contrast, peripherally administered F-ghrelin failed to access or to increase p-ERK in the NTS, which also expresses GHSR (2, 6, 13), and peripherally administered ghrelin increases c-Fos levels in NTS cells that lack GHSR. Overall, current data suggest that the AP is the component of the DVC that senses plasma ghrelin concentrations, whereas the NTS is not directly targeted by circulating ghrelin, and this presumably occurs due to the presence of the funiculus separans, which is a layer of cells that functions as a barrier separating the AP from the underlying brain tissue (10).
The peripheral administration of ghrelin in our experimental conditions acutely increases the plasma hormone concentration, peaking a few minutes after injection and then dropping to basal levels by ∼60 minutes later; the transient elevation of circulating ghrelin represents a ∼10-fold increase at 30 minutes after treatment, as compared with basal levels (6, 26). A 10-fold elevation of plasma ghrelin levels is comparable to the increase found in chronically food-restricted mice (32). To test the responsiveness of AP neurons to endogenous ghrelin, we tested the induction of c-Fos in 48-hour fasted mice, which display an approximately twofold increase of plasma ghrelin levels. Using GHSR-eGFP mice, we found that 48 hours fasting increases c-Fos in both GHSR-expressing and GHSR-lacking cells of the AP. A fasting-induced increase of c-Fos in AP cells that lack GHSR was expected because this DVC region also contains neurons responsive to other metabolic or hormonal factors (i.e., glucose, insulin, leptin, CCK), which are also altered during fasting (10). The observation that fasting increases c-Fos only in GHSR-lacking cells of the NTS of 48-hour fasted GHSR-eGFP mice goes along with the notion that GHSR-expressing cells of the NTS do not sense plasma ghrelin levels. Fasting is known to decrease water intake that may, in turn, induce dehydration-mediated activation of the AP (10, 33); however, the fasting-induced increase of c-Fos in the AP was not affected by fluid therapy, suggesting that activation of the AP is not related to alterations of the body fluid balance. In contrast, the fasting-induced increase of c-Fos in the AP seems to depend on the ghrelin signaling because fasted GHSR-null mice have an impaired response as compared with fasted wild-type mice. It is interesting to stress that the use of 48 hours of food deprivation was based on pilot studies that showed that only this period of food restriction, as opposed to 24-hour fasting, induced a significant increase of the number of c-Fos+ cells in the AP, as compared with the numbers found in ad libitum fed condition (unpublished observations). The reason behind the requirement of a more severe fasting condition to reveal a role of ghrelin signaling in the AP is uncertain, especially because similar plasma ghrelin levels are found in 24- or 48-hour fasted mice (20). It can be hypothesized, however, that mice fasted for longer periods of time are more sensitive to ghrelin. Such a notion is supported by studies demonstrating elevated hypothalamic GHSR mRNA levels in 48-hour fasted mice as compared with ad libitum fed and 24-hour fasted mice (20). In any case, the observation that ghrelin action in the AP plays a minor role under more physiological conditions but becomes relevant during prolonged fasting is not unexpected. Indeed, previous studies have shown that mice need to be exposed to extreme energy deficit conditions to reveal some essential roles of ghrelin (34, 35). Thus, we would predict that our current results may help us to better understand the protective mechanisms recruited by the ghrelin system in response to severe energy conditions, including fasting, cachexia, anorexia, or malnutrition.
In this study, we show that most GHSR-expressing cells (∼70%) are GABAergic whereas only a relatively small subset of GABA neurons (∼20%) expresses GHSR. Around 10% of the GABA neurons of the AP increase c-Fos expression in response to ghrelin; because no c-Fos is detected in AP cells lacking GHSR of ghrelin-treated GHSR-eGFP mice, it can be inferred that ghrelin activates approximately half of all GABA neurons expressing GHSR. Because most GHSR-expressing neurons are activated by 48-hour fasting, it is possible to hypothesize that most ghrelin-responsive GABA neurons of the AP are recruited under such conditions. Interestingly, a previous study showed that ghrelin hyperpolarizes around half of the ghrelin responding AP neurons, whereas the other half of them were depolarized (13). The physiological implications of this differential role of ghrelin on different populations of AP GABA neurons are currently unknown. In this study, we also showed that TH-IR cells of the AP do not express GHSR or increase c-Fos levels in response to ghrelin, indicating that the catecholaminergic system of the AP is not a target of the hormone in mice. This finding is similar to previous observations made in rats (2).
Several studies have shown that ghrelin increases gastric emptying. In mice, a ghrelin receptor antagonist reduces gastric emptying (36) whereas ghrelin stimulates gastric emptying without effects on acid secretion or gastric endocrine cells (30, 37). Also, GHSR-deficient mice display a delayed gastric emptying (38), and fasted mice show increased gastric emptying (39). Gastric emptying is controlled by the vago-vagal reflex pathway, which involves three sets of neurons: the vagal afferent neurons of the nodose ganglia that transmit the sensory information from the gastrointestinal tract to the NTS, the visceral sensory neurons of the NTS, and the cholinergic motor neurons of the DMV. The sensory neurons of the AP can modulate the activity of the vago-vagal reflex (10). In this study, we found that gastric emptying induced by peripherally injected ghrelin requires an intact AP. Similarly, the ghrelin-induced pancreatic protein secretion, which also depends on the vago-vagal reflex, is impaired in AP-ablated animals (8). It is well established that AP neurons provide to the NTS an important GABA input, which regulates the vago-vagal circuit (10, 40, 41). We found that GHSR-expressing neurons of the AP are GABAergic and send ventrolateral projections toward the NTS. Thus, it can be hypothesized that ghrelin-sensitive GABA neurons of the AP regulate gastric emptying via modulation of the NTS neurons that are part of the vago-vagal reflex. In support of this model, a previous study showed that peripherally administered ghrelin fails to increase c-Fos in the NTS of AP ablated animals (8). Still, the ghrelin-induced activation of AP GABA neurons would induce inhibition of downstream target neurons. Thus, further studies are required to understand the neuronal circuits by which ghrelin activates GHSR-lacking cells of the NTS.
Circulating ghrelin requires the integrity of the AP to increase gastric emptying; however, we cannot rule out that such effect involves the simultaneous action on multiple targets. GHSR is expressed in the nodose ganglia neurons innervating in the stomach, and ghrelin has been shown to inhibit vagal afferent responses to tension (42, 43). Thus, ghrelin could increase gastric emptying via inhibition of the vagal afferents and further reduction of the inhibitory inputs on the gastric motor function (42). In rats, ghrelin could also regulate gastrointestinal motility independently of the vago-vagal reflex, as peripherally administered ghrelin increases antral contractions in vagotomized animals (44) and cholinergic antagonists only partially reduce the effect of ghrelin on gastric myoelectrical activity and gastric emptying (45). Ex vivo studies showed that ghrelin stimulates small intestine motility of rats through intrinsic myenteric neurons, which also express GHSR (43, 46–48). In mice, ghrelin increases electrically stimulated contractions of fundic strips in an in vitro setting (49). It is interesting to stress that the administration of ghrelin directly in the DVC also elicits contractions of the gastric corpus through the cholinergic DMV efferent pathway (14). Electrophysiological recordings of brain slices have shown that ghrelin stimulates the excitatory, but not the inhibitory, inputs provided by the NTS to the preganglionic DMV motor neurons (14) and that it inhibits the excitatory inputs into the catecholaminergic neurons of the NTS (50). Because our data indicate that circulating ghrelin does not have access to the NTS, the physiological relevance of the direct action of ghrelin on this DVC region is unclear. We found that GHSR-expressing neurons of the NTS are responsive to centrally injected ghrelin; thus, fluctuations of cerebrospinal ghrelin may regulate GHSR signaling in the NTS. Additionally, GHSR-expressing cells of the NTS may be regulated by mechanisms independent of ghrelin, as GHSR is known to act in ligand-independent manner by either its high constitutive activity or its heterodimerization with other G protein–coupled receptors (51, 52).
Because the AP also regulates other branches of the autonomic nervous system, ghrelin may also recruit the AP to regulate other physiological functions, besides gastric emptying or pancreatic secretion. For instance, AP neurons may mediate some effects of ghrelin on the control of glycemia because mice with selective expression of GHSR in Phox2b-expressing neurons, which includes but is not limited to AP neurons, display a normalization of the relative hypoglycemia detected in GHSR-deficient mice upon fasting (53). Additionally, the AP is involved in the control of body fluid balance, and peripherally administered ghrelin not only activates the AP but also inhibits water intake in dehydrated rats (12). Thus, GHSR-expressing neurons of the AP may mediate some of the antidipsogenic effects of ghrelin (12). In this regard, it is interesting to stress that ghrelin-signaling in the AP may be also involved in the fasting-induced decrease of water consumption. However, further studies are required to test this hypothesis.
It is controversial whether the DVC can mediate orexigenic actions of ghrelin. Early studies showed that vagotomy or capsaicin treatment, which spares myelinated afferents and lesions nonvagal afferents, abolished ghrelin-induced food intake (54, 55). However, further studies using complete subdiaphragmatic deafferentation indicated that ghrelin does not require vagal afferent signaling for food intake regulation (56). Ablation of catecholamine neurons of the medulla also failed to affect ghrelin-induced food intake (57). In this study, we found that AP-ablated mice remain fully responsive to the orexigenic effect of peripherally administered ghrelin. This observation is in line with our previous studies indicating that the orexigenic effects of peripherally administered ghrelin require an intact arcuate nucleus (6), in which ghrelin targets the AgRP neurons (35, 58), whereas this effect is not observed in mice with expression of GHSR limited to Phox2b-expressing cells (53). Interestingly, it has been reported that AP-ablated rats display a reduced cumulative food intake, after the sixth day of treatment, in response to daily administrations of ghrelin (59). The conserved ghrelin-induced food intake of AP-ablated rats in the initial days of treatment together with our observation that AP-ablated mice show an impaired ghrelin-induced gastric emptying suggest that the role of the AP mediating the effect of ghrelin on cumulative food intake may be secondary to the effect of the hormone on the gastrointestinal motility, which could impact the meal size. Finally, importantly, note that we cannot exclude the possibility that GHSR-expressing neurons of the NTS regulate food intake, as it has been shown that intra-DVC administration of ghrelin increases food intake (60).
Abbreviations:
- ANOVA
analysis of variance
- AP
area postrema
- BW
body weight
- DAB
diaminobenzidine
- DMV
dorsal motor nucleus of the vagus
- DVC
dorsal vagal complex
- eGFP
enhanced green fluorescent protein
- F-ghrelin
fluorescent ghrelin
- GABA
γ-aminobutyric acid
- GHSR
growth hormone secretagogue receptor
- ICV
intracerebroventricular
- IR
immunoreactive
- mRNA
messenger RNA
- NTS
nucleus of the solitary tract
- OD
optical density
- PBS
phosphate-buffered saline
- p-ERK
phosphorylated extracellular signal-regulated kinase
- SEM
standard error of the mean
- TH
tyrosine hydroxylase.
Acknowledgments
We thank Maria Eugenia Padin for initial assistance with the project, and Ichiro Sakata for comments. Dr. Guillermo Lanuza and Alejandro Schinder, from the Instituto Leloir, provided the Gad2-CreERT2 and Ai14 mice.
This work was supported by Grant PICTO2013-0065 to M.P., which is co-financed by the National Agency of Scientific and Technological Promotion of Argentina and GlaxoSmithKline, as well as by the Diana and Richard C. Strauss Professorship in Biomedical Research and the Mr. and Mrs. Bruce G. Brookshire Professorship in Medicine to J.M.Z. A.C., M.P.C, G.F., and M.U. were supported by CONICET, and P.N.D.F. was supported by the Scientific Research Commission, Province of Buenos Aires.
Disclosure Summary: The authors have nothing to disclose.
References
Author notes
These authors contributed equally to this study.
Address all correspondence and requests for reprints to: Mario Perelló, PhD, Laboratory of Neurophysiology, IMBICE, Calle 526 s/n entre 10 y 11, PO Box 403, 1900 La Plata, Buenos Aires, Argentina. E-mail: [email protected]; or [email protected].
