


Des-acyl ghrelin (DAG), the most abundant form of ghrelin in humans, has been found to reduce arterial blood pressure and prevent cardiac and endothelial cell apoptosis. Despite this, data regarding its direct effect on cardiac function and coronary blood flow, as well as the related involvement of autonomic nervous system and nitric oxide (NO), are scarce. We therefore examined these issues using both in vivo and in vitro studies. In 20 anesthetized pigs, intracoronary 100 pmol/mL DAG infusion with a constant heart rate and aortic blood pressure, increased coronary blood flow and NO release, whereas reducing coronary vascular resistances (P < .05). Dose responses to DAG were evaluated in five pigs. No effects on cardiac contractility/relaxation or myocardial oxygen consumption were observed. Moreover, whereas the blockade of muscarinic cholinoceptors (n = 5) or α- and β-adrenoceptors (n = 5 each) did not abolish the observed responses, NO synthase inhibition (n = 5) prevented the effects of DAG on coronary blood flow and NO release. In coronary artery endothelial cells, DAG dose dependently increased NO release through cAMP signaling and ERK1/2, Akt, and p38 MAPK involvement as well as the phosphorylation of endothelial NO synthase. In conclusion, in anesthetized pigs, DAG primarily increased cardiac perfusion through the involvement of NO release. Moreover, the phosphorylation of ERK1/2 and Akt appears to play roles in eliciting the observed NO production in coronary artery endothelial cells.
The ghrelin-related peptides, acylated ghrelin and des-acylated ghrelin, are gastrointestinal hormones that have been reported to exert variable effects on the cardiovascular system. Apart from being able to stimulate food intake and adiposity (1–4), ghrelin has been found to reduce arterial and pulmonary blood pressure (BP) (5–8), to increase myocardial contractility (5, 9), and to exert opposite effects on different vascular beds (10–13). For example, ghrelin has been shown to increase human forearm blood flow and dilate human mammary and rat mesenteric arteries, whereas in rats and pigs, it caused coronary vasoconstriction.
The deacylated form of ghrelin, des-acyl ghrelin, is far more abundant in circulation than ghrelin and is devoid of any endocrine activity (1, 2, 4, 14), although several authors strongly suggest that des-acyl ghrelin has intrinsic and specific actions in many physiological and pathophysiological conditions, mainly as a functional antagonist of ghrelin (15). To date, however, the function of des-acyl ghrelin is currently unknown, with the few studies examining its cardiovascular effects highlighting a role as a vasodilating and antiapoptotic agent. Des-acyl ghrelin induced relaxation in perfused mesenteric vascular beds, human isolated mammary arteries, and saphenous veins, whereas in H9c2 cardiomyocytes and porcine aortic endothelial cells, des-acyl ghrelin exerted antiapoptotic effects (16–18).
Regarding the mechanisms of action, only the effects of acylated ghrelin have been reported to be generally mediated by the GH secretagogue receptor (GHSR)-1a, which is a G protein-coupled receptor endowed with a strong GH release activity (19). Other mechanisms have also been hypothesized to play a role in mediating the effects of ghrelin. In the intestinal vascular bed, both peptides were shown to promote vasodilatation by a mechanism not involving GHSR-1a activation (16). Moreover, endothelial calcium-activated potassium channels (17), MAPK, and Akt (18) were found to be involved in the vascular and apoptotic effects of des acyl ghrelin.
With regard to the involvement of nitric oxide (NO), the reported data are controversial. Hence, in rat mesenteric vessels and human forearm blood flow, the effects of ghrelin have not been found to be associated with changes in NO release (10, 16). In contrast, in porcine coronary arteries (11) and in human pulmonary endothelial cells, ghrelin administration was found to exert cytoprotective effects by an enhanced expression of phosphorylated Akt and endothelial NO synthase (eNOS)-related NO release (20). Moreover, in mice cerebral circulation, des-acyl ghrelin but not ghrelin exerted protective effects through the modulation of NO release (21). Furthermore, in hypertensive patients, the plasma levels of des-acyl ghrelin were positively correlated to NO (22).
Whereas the effects of ghrelin on the cardiovascular system have been widely examined, information is scarce regarding the effects of des-acyl ghrelin on cardiac function and perfusion and the related mechanisms of action.
Based on this evidence, in the present study, we examined the effects of des-acyl ghrelin on coronary blood flow, cardiac contractility, and relaxation in anesthetized pigs as well as the involvement of the autonomic nervous system and NO. In addition, we investigated the intracellular signaling leading to NO release in coronary artery endothelial cells (CECs).
Materials and Methods
In vivo
The experiments were carried out in accordance with the Guide for the Care and Use of Laboratory Animals (1996 [7th edition], National Research Council, National Academies Press), the Animal Research: Reporting In Vivo Experiments guidelines, the national guidelines (DLGS 27/01/1992, license number 116), and with the approval of the local ethical committee.
Animal's instrumentation and measurements
The experiments were carried out in 25 prepubertal female domestic pigs, weighing 64–72 kg and supplied by an accredited dealer (Azienda Invernizzi). Because the animals were prepubertal, the differences related to hormonal status and gender were avoided. After being fasted overnight, the pigs were anesthetized with im ketamine (20 mg/kg; Parke-Davis) followed by iv sodium pentobarbitone after 15 minutes (15 mg/kg; Siegfried), with the animals artificially ventilated with oxygen-enriched air using a respiratory pump (Harvard 613; Harvard Apparatus). Anesthesia was maintained throughout the experiments by a continuous iv infusion of sodium pentobarbitone (7 mg/kg · h), with assessments performed as previously reported (23). Measurement of hemodynamic variables, coronary arterial and venous partial pressure of oxygen (PO2), arteriovenous oxygen content, and NO was performed as in previous studies on the same animal model (23–31). Infusions into the left anterior descending coronary artery (LAD) were performed using a catheter connected to a butterfly needle inserted into the coronary artery, distal to the flow meter probe. Methods for preventing blood coagulation and for keeping the rectal temperature between 38°C and 40°C were the same as those previously used (24–31). Hemodynamic variables were monitored and recorded together with heart rate and the maximum and minimum rate of change of left ventricular (LV) systolic pressure (±dP/dtmax) by using a micro-1401 A/D converter (Cambridge Electronic Design) displayed on a personal computer and processed by using Spike2 software (Cambridge Electronic Design).
The dP/dtmax was used to define the timing of the cardiac cycle for segment length measurements with ultrasonic crystals. Percentage of segmental shortening (%SS) was calculated using the formula: %SS = (end diastolic length-end systolic length) × 100/end-diastolic length. The data from the Sonomicrometer crystals were digitally processed by specific hardware and software (Sonometrics). The cardiac output was derived using the Sonosoft system from the data recorded by piezoelectric crystals. To calculate the coronary vascular resistance, the difference between the mean aortic BP and mean LV pressure during diastole was considered as the coronary pressure gradient. Coronary vascular resistance was calculated as the ratio between this pressure gradient and the mean diastolic coronary blood flow during the steady state. At the end of the experiment, each animal was killed by an iv injection of 90 mg/kg pentobarbitone sodium.
In vitro
Cell culture
CECs were isolated from coronary arteries of anesthetized pigs and cultured as previously described (26, 30, 32). For the Griess study, 1 × 10⁴ cells were plated in 96-well plates in serum-free medium composed of phenol red free DMEM supplemented with 1% penicillin-streptomycin-glutamine for 4–6 hours. For the Western immunoblot experiments, the cells were plated in 0.1% gelatin-coated dishes in endothelial growth media-2, and at confluence, they were incubated with serum-free medium overnight. For the PCR experiments, the cells were plated in six-well plates at 3.5 × 10⁵ in complete medium.
Experimental protocol
In vivo
The experiments were initiated after at least 30 minutes of steady state conditions. In 20 of the 25 pigs, the effects of des-acyl ghrelin (DAG; Sigma) on cardiac perfusion and function were examined by infusing DAG dissolved in saline or saline alone into the LAD. DAG was infused at 100 pmol/mL · min of measured coronary blood flow over a 5-minute period by means of an infusion pump (model 22; Harvard Apparatus), working at constant rate of 1 mL/min. In 5 of the 25 pigs, a dose-response study was performed by infusing DAG in the LAD at subsequent doses of 1, 25, 50, 75, 100, and 150 pmol for each milliliter per minute of measured coronary blood flow. Each infusion was performed over 5 minutes. The doses correspond to plasma DAG concentrations found in humans, which range from 20 to 300 pg/mL (33, 34). It should be also noted that plasma des-acyl ghrelin levels in pigs have been reported to be in the range of picomoles (35).
Recordings taken for 10 minutes during the steady state with a constant heart rate and aortic BP prior to the infusion of DAG were used as controls. Measurements of hemodynamic variables, coronary artery and coronary venous PO2, oxygen content, and NO were obtained during the last 30 seconds of each dose in the steady state and compared with control values. Myocardial oxygen consumption (milliliters of O2 per minute−1 per 100 gram−1) and coronary NO were measured as previously described (24–31).
In the 20 pigs, the role of muscarinic cholinoceptors and α- and β-adrenoceptors was examined throughout by repeating DAG administration (100 pmol for each milliliter per minute of measured coronary blood flow) after the iv infusion of muscarinic cholinoceptor blocker, atropine sulfate (0.5 mg/kg, n = 5; Sigma), α-adrenoceptor blocker phentolamine (1 mg/kg, n = 5; Sigma), and β-adrenoceptor blocker propranolol (0.5 mg/kg, n = 5; Sigma). The involvement of NO synthase (NOS) was evaluated by repeating DAG infusion after the intracoronary administration of the NOS inhibitor, Nω-nitro-L arginine methyl ester (L-NAME; 2 mg/ml · min of measured coronary blood flow, n = 5; Sigma).
All drugs were given without controlling heart rate and aortic pressure to assess their effects on baseline hemodynamic variables in the steady state. Thereafter, heart rate and aortic BP were kept constant, and measured hemodynamic variables were taken as the control. In all subsequent experiments, the effects of DAG in the presence of blocking agents were examined while preventing changes in heart rate and aortic BP.
In vitro
NO production
The NO production was measured in CEC culture supernatants using the Griess method (Promega). Cells plated in 96-wells were incubated in starvation medium and then treated for 30, 120, and 300 seconds with DAG (10−11 to 10−7 M; Sigma) in dose-dependent and time-course studies. In specified experiments, the GHSR-1a blocker, D-Lys-GHRP-6 (10−7 M; 15 min; Santa Cruz Biotechnologies, Inc) was administrated prior to DAG (10−7 M). To examine the intracellular pathways leading to NO release, DAG was administrated to cells in the presence or absence of the adenylyl cyclase blocker 2′5′-dideoxyadenosine (1 nM to 1 μM, 15 min; Sigma), the protein kinase A (PKA) inhibitor H89 (1 nM to 1 μM, 15 min; Sigma), the phospholipase C (PLC)-γ inhibitor U73122 (1 nM to 10 μM, 15 min; Sigma), the Src inhibitor, 4-amino-5-(4-chlorophenyl)-7-(t-butyl)pyrazolo[3,4-d] pyrimidine (PP2; 1 nM to 10 μM, 15 min; Santa Cruz Biotechnologies), the NOS blocker L-NAME (10 mM, 15 min; Sigma), the p38 MAPK inhibitor SB203580 (1 nM to 1 μM, 15 min; Sigma), the phosphatidylinositol 3-kinase inhibitor wortmannin (1 nM to 1 μM, 15 min; Sigma), and the MAPK kinase-1 inhibitor UO126 (1 nM to 10 μM, 15 min; Sigma). Acetylcholine chlorohydrate (10 μM; Sigma) was used as the positive control. The various agonists/antagonists and their vehicle were also tested in the basal medium without agents. At the end of the stimulations, NO production in the sample supernatants was examined by adding an equal volume of Griess reagent (Promega) according to the manufacturer's instructions, and the absorbance at 570 nm was measured by a spectrometer (BS1000 Spectra Count) (26, 32, 36–39).
Western immunoblot
The CECs at confluence plated on the 0.1% gelatin-coated dishes with starvation medium overnight were stimulated with DAG (10−11 and 10−7 M). After the stimulation, the cells were washed with 1× PBS supplemented with 1:200 sodium orthovanadate and 1:100 protease inhibitors (Sigma) and then lysed in radioimmunoprecipitation assay buffer (50 mM HEPES, 150 mM NaCl, 0,1% sodium dodecyl sulfate, 1% Triton X-100, 1% sodium deoxycholate, 10% glycerol, 1.5 mM MgCl2, 1 mM EGTA, 1 mM sodium fluoride; Sigma) supplemented with 1:200 sodium orthovanadate, 1:100 protease, and phenylmethanesulfonyl fluoride (1:100; Sigma) on ice. The extracted proteins were quantified by bicinchoninic acid protein assay (Pierce).
Cell lysates (30 μg protein each sample) under reduced conditions, were resolved on 10% SDS-PAGE, transferred to polyvinylidene difluoride membranes and incubated overnight at 4°C with specific primary antibodies: antiphospho-ERK1/2 (Thr202/Tyr204, 1:1000; Cell Signaling Technologies), anti-ERK1/2 (1:1000; Cell Signaling Technologies), antiphospho-Akt (Ser473, 1:1000; Cell Signaling Technologies), anti-Akt (1:1000; Cell Signaling Technologies), antiphospho-eNOS (Ser1177, 1:1000; Cell Signaling Technologies), anti-eNOS (1:1000; Cell Signaling Technologies), and anti GHSR-1a (1:1000; Santa Cruz Biotechnologies). The membranes were washed and then incubated with horseradish peroxidase-coupled goat antirabbit IgG, peroxidase-coupled rabbit antigoat IgG for 45 minutes, and developed using chemiluminescence enhanced chemiluminescence (PerkinElmer Life and Analytical Sciences). Phosphorylated protein expression was normalized to the specific total protein expression and verified through β-actin detection (1:1000; Cell Signaling Technologies), as previously performed (36–39).
Reverse transcription-polymerase chain reaction
Total RNA was extracted from CECs using the TRIzol reagent (Invitrogen) and quantified at 260 nm by the NanoDrop 2000c spectrophotometry (Thermo Fisher Scientific). Subsequently, two micrograms of total RNA were reverse transcribed into cDNA with the high-capacity cDNA reverse transcription kit (Life Technologies), using random primers and the MultiScribe reverse transcriptase (Thermo Fischer Scientific), according to the manufacturer's protocol.
For the GHSR-1a gene expression studies, two microliters of cDNA were amplified using the following intron-spanning primers: p5′-CTACTTCGCCATCTGCTTCC-p3′ and p5′-AGCTTCCTGCCGATGAGACT-p3′. The glyceraldehyde 3-phosphate dehydrogenase (GAPDH) housekeeping gene was also amplified as a positive control. The primer sequences for the glyceraldehyde 3-phosphate dehydrogenase gene amplification are as follows: p5′-GAAGGTGAAGGTCGGAGTCAAC-p3′ and p5′-CAGAGTTAAAAGCAGCCCTGGT-p3′. The PCR amplification was carried out using the AmpliTaq Gold DNA polymerase (Life Technologies) under the following conditions: initial denaturation at 95°C for 10 minutes, followed by 35 cycles with denaturation at 95°C for 30 seconds, annealing at 52°C for 30 seconds, and extension at 72°C for 30 seconds, with a final extension at 72°C for 5 minutes. The resulting RT-PCR products were checked on a 2% agarose gel (Sigma) with the images acquired using the Gel Doc imaging system (Bio-Rad Laboratories).
Statistical analysis
All data were recorded using the institution's database. Statistical analysis was performed using STATVIEW version 5.0.1 for Microsoft Windows (SAS Institute). Data were checked for normality before the statistical analysis. A Student's paired t test was used to examine changes of measured variables within each animal before and after any treatment. One-way ANOVA followed by Bonferroni post hoc tests were used to examine changes in NO production and protein phosphorylation caused by various agents among the groups. In the in vitro studies, data represent the mean of at least five independent experiments for each experimental protocol. Pearson correlation coefficients (r) were calculated to examine the relationship between hemodynamic effects and NO release. Data are expressed as mean ± SD (minimum and maximum values). A value of P < .05 was considered statistically significant.
Results
In vivo
Dose-related effects of intracoronary DAG on hemodynamic variables, NO release, and myocardial oxygen metabolism
In all pigs the recordings commenced approximately 5 hours after the induction of anesthesia. The mean pH, arterial pressure of oxygen (PO2), and partial pressure of CO2 of arterial blood were 7.4 ± 0.01 (7.39–7.43), 118 ± 9.6 (100–135) mm Hg, and 40 ± 1.3 (38–42) mm Hg and the hematocrit was 40% ± 0.8% (39–41).
In Figure 1, an example of recordings taken from 1 of the 20 pigs is shown. The effects of DAG were observed within 30 seconds of starting the infusion and reached a steady state at about 2 minutes. These effects were lost at approximately 10 minutes after the des-acyl ghrelin infusion. Table 1 summarizes the hemodynamic variables measured in the 20 pigs. In these pigs, the intracoronary infusion of DAG caused an increase in mean coronary blood flow of 38.4% ± 5.6%, which was accompanied by a decrease of coronary vascular resistance of 31.5% ± 4.9%, an increase of coronary NO release of 80.9% ± 12.2%, an increase of coronary venous pO2 of 8% ± 2.4%, and a decrease of arteriovenous oxygen content of 23.7% ± 9.9% with respect to the control values (Table 1 and Figure 2). Moreover, DAG did not cause any changes in cardiac function, cardiac output, and myocardial oxygen consumption (Table 1). Intracoronary infusion of the vehicle did not cause any changes in hemodynamic variables.
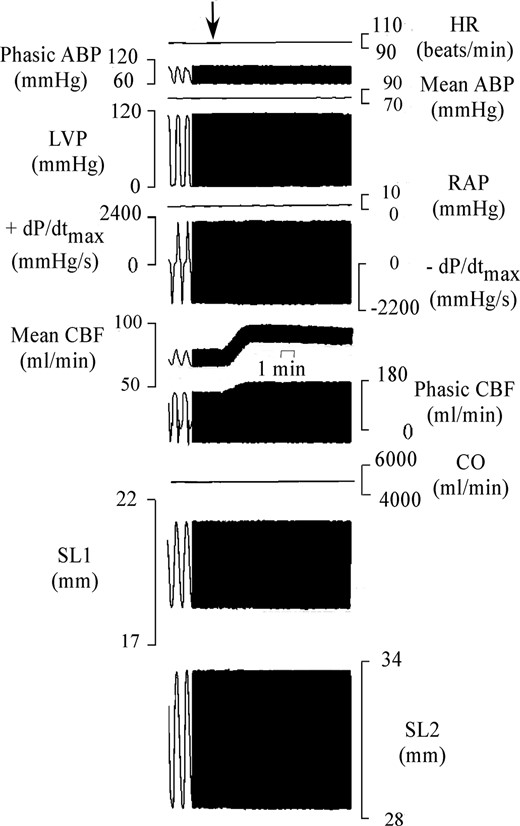
Example of experimental recording taken in 1 of the 20 pigs. From top to bottom are shown heart rate (HR), phasic and mean aortic BP (ABP), LV pressure (LVP), right atrial pressure (RAP), maximum rate of change of left systolic ventricular pressure (+dP/dtmax), minimum rate of change of left systolic ventricular pressure (−dP/dtmax), mean and phasic coronary blood flow (CBF), cardiac output (CO), and segment length (SL1 and SL2). The arrow indicates the start of des-acyl ghrelin infusion at 100 pmol/mL measured coronary blood flow.
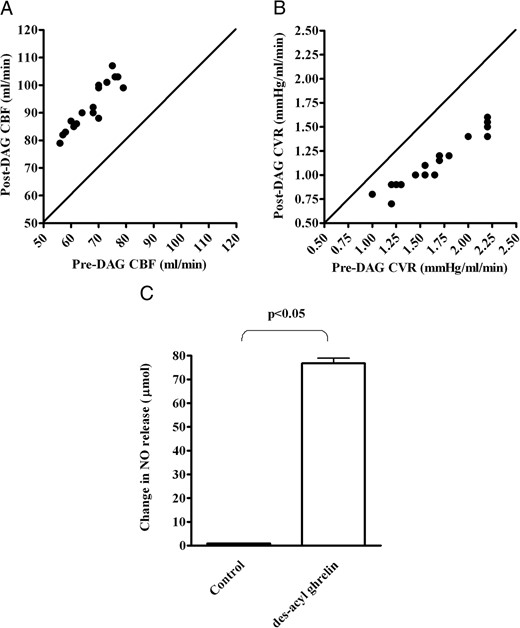
Effects of intracoronary infusion of des-acyl ghrelin on mean coronary blood flow (CBF; A), coronary vascular resistances (CVR; B), and coronary NO (C) in 20 pigs. In panels A and B, the changes in the hemodynamic variables obtained in the 20 pigs during the test period of measurement are plotted against the respective control values. The continuous line is the line of equality. In C, the effects of DAG on coronary NO release are reported. Results are means ± SD.
Changes in Hemodynamic Variables Caused by Intracoronary Infusion of 100 pmol DAG for Each Milliliter per Minute of Coronary Blood Flow in 20 Pigs
| Data | Before DAG | After DAG | Change |
|---|---|---|---|
| HR, beats/min | 102.1 ± 6.5 | 102.2 ± 6.5 | 0.1 ± 0.5 (from −1 to 2) |
| ABP, mm Hg | 80 ± 11 | 79.9 ± 11 | −0.05 ± 0.22 (from −1 to 0) |
| +dP/dtmax, mm Hg/sec | 2039 ± 172.7 | 2044 ± 173 | 4.5 ± 41 (from −100 to 70) |
| −dP/dtmax, mm Hg/sec | −1860 ± 131 | −1861 ± 128 | −1 ± 10.8 (from −23 to 22) |
| RAP, mm Hg | 2.4 ± 0.3 | 2.4 ± 0.3 | −0.006 ± 0.04 (from −0.1 to 0.1) |
| LVEDP, mm Hg | 4.6 ± 0.6 | 4.6 ± 0.6 | −0.004 ± 0.02 (from −0.1 to 0) |
| CBF, mL/min | 66.5 ± 7 | 91.8 ± 8.1a | 25.3 ± 3.2 (18–32)a |
| CVR, mm Hg/mL · min | 1.69 ± 0.4 | 1.15 ± 0.27a | −0.53 ± 0.16 (from −0.8 to −0.2)a |
| CO, mL/min | 5690 ± 504 | 5693 ± 511 | 2.3 ± 31.2 (from −62 to 59) |
| %SS | 14.2 ± 1 | 14.2 ± 0.9 | 0.005 ± 0.2 (from −0.4 to 0.3) |
| NO, μmol per 1.5 μg protein | 0.96 ± 0.05 | 77 ± 9.6a | 76 ± 9.6 (59–98)a |
| pO2vc | 19.62 ± 1.15 | 21.2 ± 1.15a | 1.57 ± 0.5a |
| (A-V)O2, mL O2 per 100 mL | 10.9 ± 0.4 | 8.3 ± 1a | 2.6 ± 1.1 (from −0.2 to 3.9)a |
| mVO2, mL/min O2 per 100 g | 7.3 ± 0.87 | 7.7 ± 0.13 | 4.1 ± 0.92 (from −0.8 to 2.3) |
Abbreviations: ABP, mean aortic BP; (A-V)O2, coronary arteriovenous oxygen content; CBF, mean coronary blood flow; CO, cardiac output; CVR, coronary vascular resistances; HR, heart rate; ±dP/dtmax, maximum and minimum dP/dtmax; LVEDP, LV end diastolic pressure; mVO2, myocardial oxygen consumption; pO2vc, coronary venous pO2; RAP, mean right atrial pressure. Data are means ± SD (range).
P < .0001 vs control (taken before DAG administration at constant HR and ABP).
In the five pigs of the dose-response study, heart rate, aortic BP, right atrial pressure, LV end diastolic pressure ± dP/dtmax, cardiac output, %SS, and coronary NO, respectively, amounted to 102 ± 4.7 beats/min, 83 ± 13 mm Hg, 2.5 ± 0.5 mm Hg, 4.4 ± 0.5 mm Hg, 2091 ± 240 mm Hg/sec, 1928 ± 144 mm Hg/sec, 5930 ± 518 mL/min, 14.6% ± 1%, and 0.98 ± 0.08 μmol per 1.5 μg protein. These values were taken as control.
As described in Figure 3, DAG (at 1–150 pmol/mL measured coronary blood flow) caused a dose-dependent increase in coronary blood flow and NO release while reducing coronary vascular resistance. Moreover, a linear correlation between DAG doses and the observed effects was found. No changes in ±dP/dtmax, cardiac output and %SS were observed during the intracoronary DAG administration (Figure 4).
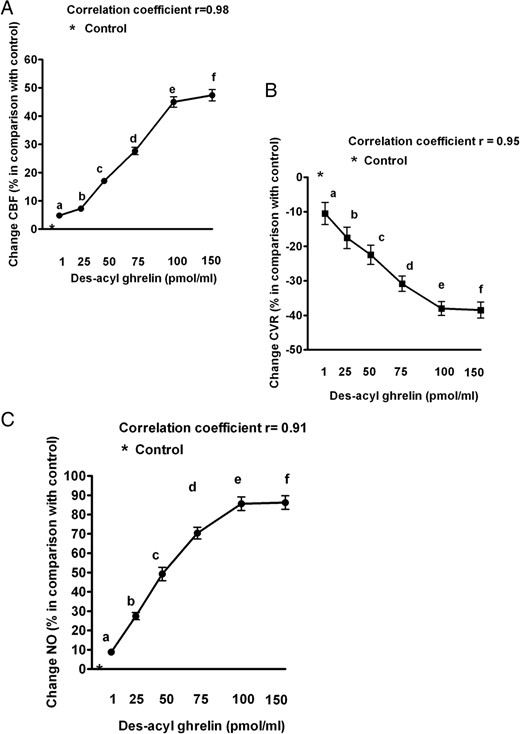
Dose-response effects of des-acyl ghrelin on coronary blood flow (CBF; A), coronary vascular resistances (CVR; B), and coronary NO (C) in five pigs. The means of percentage changes in hemodynamic data and NO release obtained in the five pigs during the test period of measurement are plotted against des-acyl ghrelin from 1 to 150 pmol/mL measured coronary blood flow. Abbreviations are the same as in previous figures. The bars indicate SD. b, c, d, e, and f, P < .05 vs a; c, d, e, and f, P < .05 vs b; d, e, and f, P < .05 vs c; e and f P < .05 vs d.
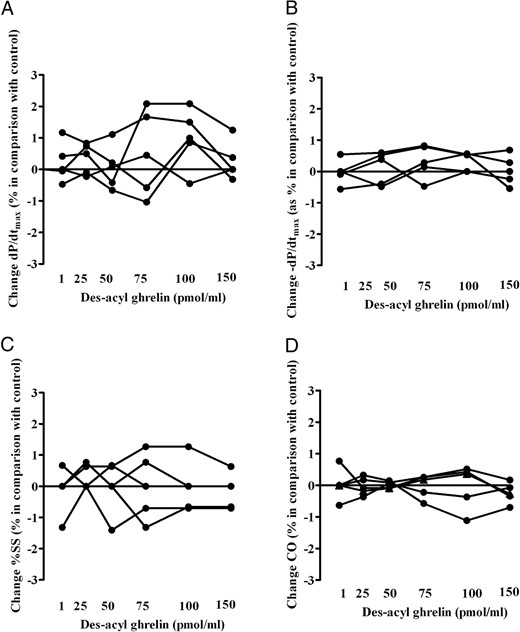
Effects of intracoronary infusion of des-acyl ghrelin on maximum and minimum rate of change of left systolic ventricular pressure (±dP/dtmax; A and B), %SS (C), and cardiac output (CO; D) in the five pigs of the dose-response study. The means of percentage changes in hemodynamic data obtained in each pig during the test period of measurement are plotted against des-acyl ghrelin from 1 to 150 pmol/min measured coronary blood flow.
Mechanisms of the responses
In Supplemental Table 1 and in Table 2, the effects of various blockers on hemodynamic variables and DAG after those inhibitors are respectively shown. In the 20 pigs, blockade of muscarinic cholinoceptors (n = 5), α-adrenoceptors (n = 5), and β-adrenoceptors (n = 5) did not affect the coronary response or the NO release caused by the intracoronary infusion of DAG (Table 2 and Figure 5, A–D). In contrast, in the pigs treated with L-NAME (n = 5), the effects of DAG on the coronary blood flow and NO release were abolished (Table 2 and Figure 5, E and F).
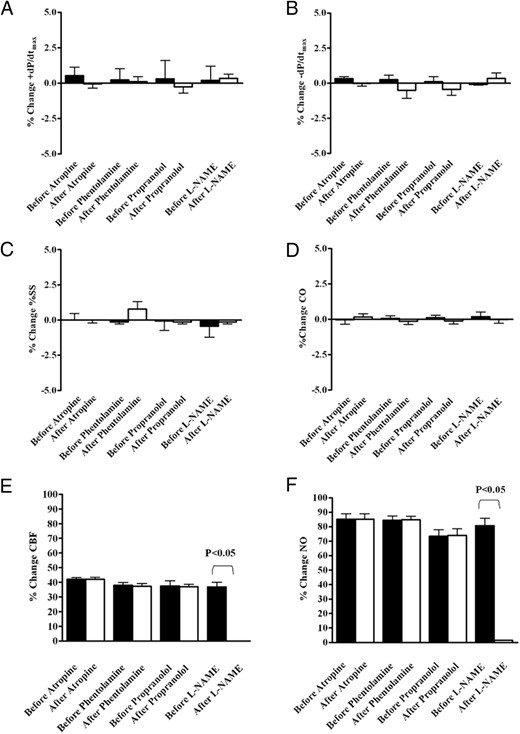
Effects of intracoronary infusion of des-acyl ghrelin on maximum and minimum rate of change of left systolic ventricular pressure (±dP/dtmax; A and B), %SS (C), cardiac output (CO; D), coronary blood flow (CBF; E), and NO (F) before and after blockade of muscarinic cholinoreceptors (n = 5), α-adrenoceptors (n = 5), β-adrenoceptors (n = 5), and the NOS (n = 5). The bars indicate SD. *, P < .0001.
Effect of DAG on Hemodynamic Variables After Blockade of Muscarinic Cholinoceptors, α/β-Adrenoceptors and NOS at Constant HR and ABP
| Data | Control | DAG |
|---|---|---|
| Atropine | ||
| HR, beats/min | 105.2 ± 4.9 | 105 ± 5 |
| ABP, mm Hg | 83.8 ± 12.6 | 84 ± 12.7 |
| CBF, mL/min | 67 ± 5.7 | 95.2 ± 7.4a |
| +dP/dtmax, mm Hg/sec | 2316 ± 172 | 2318 ± 174 |
| −dP/dtmax, mm Hg/sec | −1870 ± 114 | 1869 ± 107 |
| CO, mL/min | 6332 ± 350 | 6343 ± 354 |
| %SS | 14.5 ± 1 | 14.5 ± 1 |
| Phentolamine | ||
| HR, beats/min | 108.6 ± 5.1 | 108.4 ± 5.2 |
| ABP, mm Hg | 67.6 ± 9.7 | 67.4 ± 9.9 |
| CBF, mL/min | 65 ± 6 | 89.9 ± 6.5a |
| +dP/dtmax, mm Hg/sec | 2060 ± 160 | 2062 ± 159 |
| −dP/dtmax, mm Hg/sec | −1768 ± 152 | −1776 ± 141 |
| CO, mL/min | 5490 ± 478 | 5494 ± 489 |
| %SS | 13.84 ± 0.88 | 13.82 ± 0.88 |
| Propranolol | ||
| HR, beats/min | 90 ± 5.4 | 90.2 ± 5.4 |
| ABP, mm Hg | 76.4 ± 11.2 | 76.2 ± 11 |
| CBF, mL/min | 61 ± 7.1 | 84 ± 11.3† |
| +dP/dtmax, mm Hg/sec | 1672 ± 108 | 1674 ± 117 |
| −dP/dtmax, mm Hg/sec | −1744 ± 59 | −1750 ± 71 |
| CO, mL/min | 5286 ± 646 | 5284 ± 630 |
| %SS | 13.36 ± 1.1 | 13.34 ± 1.1 |
| L-NAME | ||
| HR, beats/min | 101 ± 6.5 | 101.2 ± 6.7 |
| ABP, mm Hg | 91 ± 9.8 | 91.2 ± 9.5 |
| CBF, mL/min | 66.4 ± 8.8 | 65.8 ± 9.5 |
| +dP/dtmax, mm Hg/sec | 2023 ± 157 | 2018 ± 167 |
| −dP/dtmax, mm Hg/sec | −1751 ± 121 | −1759 ± 117 |
| CO, mL/min | 5826 ± 392 | 5818 ± 394 |
| %SS | 14.12 ± 0.93 | 14.1 ± 0.94 |
Abbreviations: ABP, mean aortic BP; CBF, mean coronary blood flow; CO, cardiac output; HR, heart rate; ±dP/dtmax, maximum and minimum dP/dtmax. Data are means ± SD. Control, hemodynamic variables after blocking agents, at constant heart rate and aortic blood pressure. Des-acyl ghrelin, effects of 100 fmol des-acyl ghrelin given after blocking agents at heart rate and aortic blood pressure constant.
P < .0002 vs control.
In vitro
Effects of asenapine on NO release in CEC
As shown in Figure 6, A and B, the RT-PCR and Western blot highlighted the expression of GHSR-1a in CECs. Moreover, a grading in NO release was observed in CECs treated with DAG (10−11 to 10−7 M; Figure 6C). The highest effect was found at 10−7 M DAG for 120 seconds of stimulation, which in turn was used for the experiments with blocking agents. In addition, the effects of DAG were not abolished by D-Lys-GHRP-6 (Figure 6D).
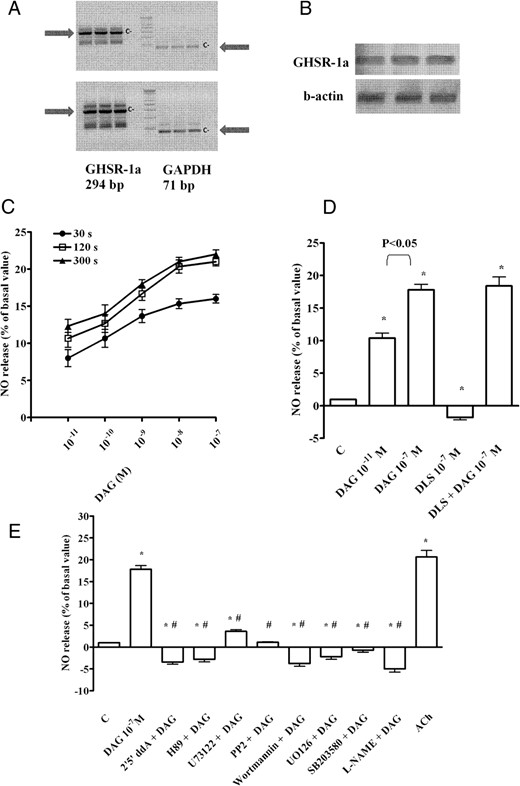
Effects of DAG on NO production in coronary endothelial cells. A, Two examples of RT-PCR of GHSR-1a expression in CECs taken from two different cell populations. c−, negative control (with all reagents for amplification except RNA); GAPDH, glyceraldehyde 3-phosphate dehydrogenase. B, Examples of GSHR-1a expression (upper panel) in CECs by Western blot compared with β-actin (lower panel). C, Dose-related and time-course effects on NO production (in percentages) obtained during the test period of measurement plotted against DAG (10−11 to 10−7 M) administered for 30 seconds, 120 seconds, and 300 seconds. These percentage values correspond to the NO (in micromoles) produced by samples containing 1.5 μg protein each. D, Effects of DAG on NO release in the absence or presence of the GHSR-1a inhibitor, D-Lys-GHRP-6 (DLS; 10−7 M). E, Effects of DAG on NO release in the absence or presence of various agents. ACh, acetylcholine (10 μM); 2′5′ddA, 2′5′ dideoxyadenosine (1 μM); L-NAME, 10 mM. Bars indicate SD. In D, *, P < .05 vs control (C). In E, *, P < .05 vs control (C); #, P < .05 vs DAG alone. In C–E, the results are reported as means ± SD of five different experiments for each experimental protocol.
To establish the right dose for each blocker, we have performed a dose-response study (Supplemental Figure 1). As shown, 1 μM 2′5′-dideoxyadenosine, 1 μM H89, 1 μM PP2, 1 μM SB203580, and 1 μM wortmannin were the most effective in inhibiting the effects of DAG (10−7 M; 120 sec stimulation). In contrast, U73122 was able to only reduce the response of CECs, even when used at 10 μM. In addition, the MAPK kinase-1 blocker, UO126, inhibited the effects of DAG at doses higher than 1 μM. For this reason we have chosen 1 μM for all agents other than UO126, which were used at 10 μM, for our studies.
The results of the costimulation of DAG (10−7 M; 120 sec stimulation) with 1 μM 2′5′-dideoxyadenosine, 1 μM H89, 1 μM U73122, 1 μM PP2, 1 μM SB203580, 1 μM wortmannin, and 10 μM UO126 are reported in Figure 6E. Also, 10 mM L-NAME was able to prevent the effects of DAG on CECs (Figure 6E). These findings have shown that DAG would increase NO release in CECs by activating a signaling mainly related to cAMP/PKA, leading to p38 MAPK, ERK1/2 phosphatidylinositol 3-kinase, and NOS activation. In the intracellular pathway, Src could also play a role in eliciting the response of cells to DAG.
Kinase involvement in NO release caused by DAG in CECs
To confirm the involvement of the above kinases in the signaling activated by DAG, as well as the role of eNOS in NO release, Western immunoblot analyses of the degree of phosphorylation of ERK1/2, Akt, and eNOS were performed in CECs stimulated with DAG (10−11 and 10−7 M) for 2 minutes. As shown in Figures 7, A and C, and 8A, DAG dose dependently increased the phosphorylation of the aforementioned kinases.
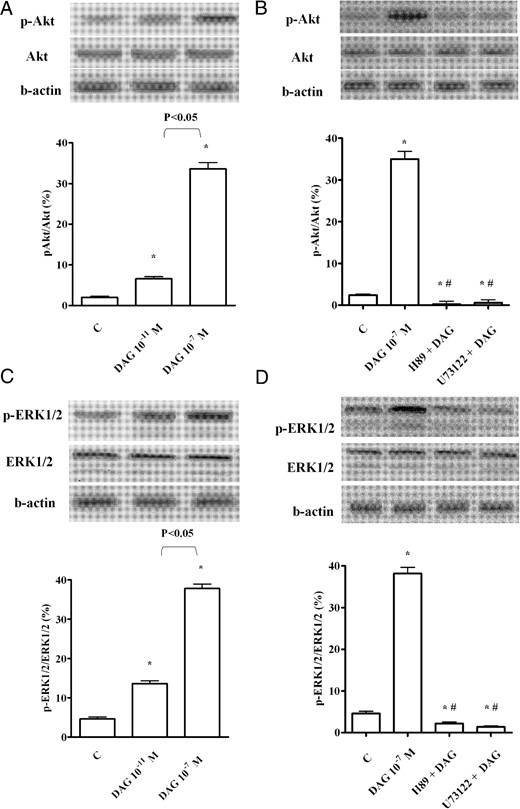
Phosphorylation of Akt (A and B) and ERK1/2 (C and D), caused by DAG in CECs. In A–D, the densitometric analysis and example of immunoblots with the relative specific proteins and β-actin are shown. The results of a densitometric analysis are the means ± SD of five different experiments for each experimental protocol. Abbreviations are the same as those used in previous figures. In A–D, *, P < .05 vs control (C); #, P < .05 vs DAG alone.
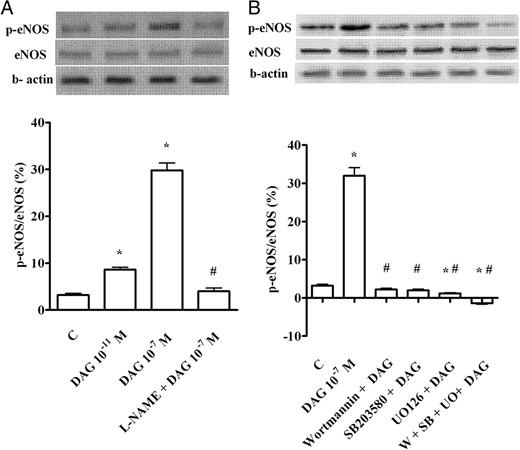
Phosphorylation of eNOS (A and B) caused by DAG in CECs. In A and B, the densitometric analysis and example of immunoblots with the relative specific protein and β-actin are shown. The results of a densitometric analysis are the means ± SD of five different experiments for each experimental protocol. SB, SB203580; UO, UO126; W, wortmannin. Other abbreviations are the same as those used in previous figures. In A and B, *, P < .05 vs control (C); #, P < .05 vs DAG alone.
Moreover, in CECs pretreated with H89 and U73122, the effects of DAG on ERK1/2 and Akt were abolished, which supports a role for both PKA and PLC in the upstream signaling, leading to the phosphorylation of these kinases (Figure 7, B and D). Finally, in the presence of wortmannin, SB203580, and UO126 given alone or together, DAG failed to cause eNOS phosphorylation (Figure 8B) (Table 3).
Antibody Table
| Peptide/Protein Target | Antigen Sequence (if Known) | Name of Antibody | Manufacturer, Catalog Number, and/or Name of Individual Providing the Antibody | Species Raised (Monoclonal or Polyclonal) | Dilution Used |
|---|---|---|---|---|---|
| p-ERK1/2 | Phospho-p44/42 MAPK (ERK1/2) (Thr202/Tyr204) | Cell Signaling Technologies | Rabbit, monoclonal | 1:1000 | |
| ERK1/2 | p44/42 MAPK (ERK1/2) (137F5) rabbit mAb | Cell Signaling Technologies | Rabbit, monoclonal | 1:1000 | |
| p-Akt | Phospho-Akt (Ser473) antibody | Cell Signaling Technologies | Rabbit, monoclonal | 1:1000 | |
| Akt | Akt (pan) (C67E7) rabbit mAb | Cell Signaling Technologies | Rabbit, monoclonal | 1:1000 | |
| p-eNOS | Phospho-eNOS (Ser1177) (C9C3) rabbit mAb | Cell Signaling Technologies | Rabbit, monoclonal | 1:1000 | |
| eNOS | eNOS antibody | Cell Signaling Technologies | Rabbit, polyclonal | 1:1000 | |
| β-Actin | β-Actin (13E5) rabbit mAb | Cell Signaling Technologies | Rabbit, monoclonal | 1:1000 | |
| GHSR1a | GHSR1a (F16) | Santa Cruz Biotechnologies Inc | Goat, polyclonal | 1:1000 |
Abbreviation: mAb, monoclonal antibody.
Discussion
This is the first study showing that intracoronary acute des-acyl ghrelin administration increased coronary blood flow in absence of changes of cardiac function through a NO-dependent mechanism in anesthetized pigs. Furthermore, the intracellular pathways involving ERK1/2, Akt, and p38 MAPK activation led to eNOS-dependent NO release in CECs. Moreover, Src was found to play a role in the upstream signaling, leading to NO production.
Des-acyl ghrelin, the most abundant form of ghrelin in humans, exerts vasodilation in both human and rat arteries (16, 17) and prevents cardiac and endothelial cell apoptosis (18). Regarding its effect on cardiac function, the currently reported data show opposite effects, depending on physiological or pathological conditions. Hence, in human paced atria or in hearts of normal dogs, neither ghrelin nor des-acyl ghrelin was found to exert any action (17, 41); in a rat model of myocardial injury, in contrast, des-acyl ghrelin was found to exert a protective effect, however to a lower extent than ghrelin (42). Lastly, in the guinea pig papillary muscle, a negative inotropic effect was observed (43). Thus, our data showing no cardiac response to acute intracoronary des-acyl ghrelin infusion in normal anesthetized pigs are in agreement with findings obtained in physiological conditions.
Overall, our results are also in line with previous studies regarding the vasodilating properties exerted by des-acyl ghrelin. It is worthy to note that because the experiments were carried out while preventing changes in heart rate and arterial BP and in the absence of changes in cardiac filling pressures, the observed responses represent primary acute effects of des-acyl ghrelin on the coronary circulation. With respect to cardiac function and metabolism, our findings, which confirm the observations from isolated human atria and normal dog hearts, also support the direct actions of des-acyl ghrelin because the design of the experiments avoided any secondary interference from reflex and physical effects (44). Furthermore, none of the responses on coronary circulation to des-acyl ghrelin could be obtained during intracoronary infusion of the vehicle alone given at the same rate as that of the peptide. In addition, the above effects were accompanied by a significant increase of coronary venous PO2, which is an index of myocardial tissue oxygenation, which is a balance between oxygen supply and demand. They were also accompanied by a decrease of arteriovenous sinus oxygen content, which could be related to the increased coronary blood flow caused by des-acyl ghrelin (45). Finally, the direct relationship between the hormone and its coronary response was also confirmed during the dose-response study, which showed that both the increase in coronary blood flow and the decrease of coronary vascular resistance, could be augmented by increasing the dose of the infused substance.
As previously shown, the pig coronary circulation and cardiac function can be the target of many hormones and peptides that can exert their function through interaction with adrenergic receptors as well as NO release. Hence, in anesthetized pigs, iv infusion of many agents including ghrelin was able to primarily cause coronary vasoconstriction by inhibiting a vasodilatory β-adrenoceptors-mediated effect related to the release of NO (11, 46). In addition, the effects of gastrin, secretin and human chorionic gonadotropin on coronary circulation and cardiac function could be prevented by the blockade of β-adrenoceptors and NOS (25–27), whereas intracoronary genistein and melatonin acutely increased coronary blood flow through β-adrenergic-mediated NO release (28, 29). Finally, the administration of insulin induced a coronary vasoconstriction, which could be considered as the net result of sympathetic α-adrenergic activation and increased release of NO (48).
For those reasons we planned to examine whether the autonomic nervous system could also be involved in the cardiovascular effects elicited by des-acyl ghrelin. Thus, in the same controlled animal preparation, the involvement of cholinergic receptors and α- and β-adrenergic receptors was examined by repeating des-acyl ghrelin administration after atropine, phentolamine and propranolol, given at the same doses previously used (24–31, 46–50). Neither blockade of cholinergic receptors nor adrenergic receptors affected the hemodynamic responses to des-acyl ghrelin, indicating that those responses did not involve the autonomic nervous system, and particularly β-adrenergic receptors, whose role was found in relation to the coronary effects of ghrelin (11).
The present results also demonstrate for the first time that in addition to exerting coronary vasodilatation, des-acyl ghrelin was able to increase coronary NO release, an effect that was related to des-acyl ghrelin doses. The detection of NO release was achieved as the coronary plasma nitrite level through the Griess system, which has been widely used in the in vivo studies for quantification of NO release (24–31, 51).
Furthermore, the involvement of NO on the coronary effects of des-acyl ghrelin was confirmed by experiments performed in the presence of L-NAME, the well-known NOS inhibitor that abolished the effects of des-acyl ghrelin, at the same dose previously used in anesthetized pigs to prevent the vasodilatation caused by hormones or peptides (24–31, 50).
In CECs, the administration of des-acyl ghrelin acutely increased NO production in a dose-dependent way and the level of phosphorylation of eNOS, ERK, and Akt, which are involved in the intracellular signaling of NO release in vascular endothelial cells (32, 36–39, 52, 53).
According to the in vivo studies, in CECs, NO was detected using the Griess method (Promega), which has been previously used to quantify changes in NO release in the same cellular model and in porcine aortic endothelial cells in response to various agents (32, 36–39, 54, 55). Our data regarding the NO involvement in the vascular effects of des-acyl ghrelin are in agreement with previous findings in mice cerebral circulation (21) and with observations obtained in hypertensive patients, whose plasma NO was positively correlated with des-acyl ghrelin levels (56).
Using RT-PCR and Western blot, we have also been able to detect GHSR-1a in CECs. Despite its expression, however, the results obtained in the presence of D-Lys-GHRP-6 highlighted that the response of CEC to des-acyl ghrelin was not abolished by GHSR-1 blocker; this confirms previous studies that report GHSR-1a receptor is not involved in the effects of the deacylated form of the peptide (1, 17).
The in vitro experiments performed in the presence of various blockers showed that the effects of des-acyl ghrelin on NO release could be abolished by 2′,5′-dideoxyadenosine and H89, prevented by the concomitant administration of ERK, p38, and Akt inhibitors, wortmannin, U0126, and SB203580 and reduced by PLC blocker, U73122 (32, 36–39, 57, 58). Thus, it could be speculated that des-acyl ghrelin would increase NO release in CECs by mainly activating a cAMP/PKA pathway leading to Akt, ERK1/2, p38MAPK, and eNOS activation. However, further studies will be necessary to better address this issue and in particular to analyze the involvement of ERK1/2.
Our results, examining the role of the described kinases in eNOS activation and NO release, are in agreement with previous findings. Hence, the activity of eNOS is regulated by complex signal transduction pathways that involve various phosphorylation events and protein-protein interactions (59–62).
As yet the receptor through which des-acyl ghrelin could exert its functions has not been discovered. Despite this, we attempted to examine the downstream signaling leading to NO release by performing experiments in presence of Src blocker, PP2. Hence, the Src/ phosphatidylinositol 3-kinase/Akt pathway, ERK1/2, and MAPK has been shown to mediate the stimulatory effect of many agents on eNOS (63–65). Our results have highlighted for the first time the role of Src in NO release caused by des-acyl ghrelin because its effects were abolished by PP2. Further experiments will be necessary to better understand its involvement and the relationship with downstream pathways.
With respect to ERK and Akt, our results confirm previous observations regarding their role in mediating some effects of des-acyl ghrelin. In these cases, intestinal cell proliferation and antiapoptotic effects in both cardiomyocytes and endothelial cells were variably inhibited by UO126 and wortmannin (18, 66). Moreover, the upstream signaling leading to their activation was found to be related to both PKA and PLC stimulation, as shown by Western blot analyses performed in the presence of specific inhibitors.
In summary, our data provide evidence of an increase of cardiac perfusion in response to des-acyl ghrelin in anesthetized pigs, which relates to eNOS-dependent NO release. Moreover, our data increase the knowledge regarding the role of ghrelin in the physiological control of the cardiovascular system. In consideration of previous findings obtained in the same anesthetized animal model for hemodynamic responses caused by the acylated form of peptide, it could be hypothesized that there exists a balance in the effects of ghrelin and des-acyl ghrelin on coronary blood flow, which would be achieved by opposite changes in NO release. It is widely accepted that NO plays a significant role in cardiovascular regulation through the modulation of vascular tone and endothelial function. Although data from the literature seem to suggest no requisite role for NO signaling in coronary functional hyperemia (40, 47, 67), decreased coronary endothelium-dependent vasodilator capacity could result in impaired myocardial perfusion and worsened ventricular function. As such, the maintenance of endothelial function could be regulated by ghrelin to /des-acyl ghrelin ratio.
Acknowledgments
We thank Azienda Ospedaliera Maggiore della Carità for its help.
Disclosure Summary: The authors have nothing to disclose.
Abbreviations
- BP
blood pressure
- CEC
coronary artery endothelial cell
- DAG
des-acyl ghrelin
- dP/dtmax
maximum rate of change of LV systolic pressure
- eNOS
endothelial NO synthase
- GHSR
GH secretagogue receptor
- LAD
left anterior descending coronary artery
- L-NAME
Nω-nitro-L arginine methyl ester
- LV
left ventricular
- NO
nitric oxide
- NOS
NO synthase
- PKA
protein kinase A
- PLC
phospholipase C
- PO2
partial pressure of oxygen
- PP2
4-amino-5-(4-chlorophenyl)-7-(t-butyl)pyrazolo[3,4-d] pyrimidine
- %SS
percentage of segmental shortening.
