


Abstract
Abundant evidence indicates that oestrogen (E2) plays a protective role against hypertension. Yet, the mechanism underlying the antihypertensive effect of E2 is poorly understood. In this study, we sought to determine the mechanism through which E2 inhibits salt-dependent hypertension.
To this end, we performed a series of in vivo and in vitro experiments employing a rat model of hypertension that is produced by deoxycorticosterone acetate (DOCA)-salt treatment after uninephrectomy. We found that E2 prevented DOCA-salt treatment from inducing hypertension, raising plasma arginine-vasopressin (AVP) level, enhancing the depressor effect of the V1a receptor antagonist (Phenylac1,D-Tyr(Et)2,Lys6,Arg8,des-Gly9)-vasopressin, and converting GABAergic inhibition to excitation in hypothalamic magnocellular AVP neurons. Moreover, we obtained results indicating that the E2 modulation of the activity and/or expression of NKCC1 (Cl− importer) and KCC2 (Cl− extruder) underpins the effect of E2 on the transition of GABAergic transmission in AVP neurons. Lastly, we discovered that, in DOCA-salt-treated hypertensive ovariectomized rats, CLP290 (prodrug of the KCC2 activator CLP257, intraperitoneal injections) lowered blood pressure, and plasma AVP level and hyperpolarized GABA equilibrium potential to prevent GABAergic excitation from emerging in the AVP neurons of these animals.
Based on these results, we conclude that E2 inhibits salt-dependent hypertension by suppressing GABAergic excitation to decrease the hormonal output of AVP neurons.

1. Introduction
One of the most important risk factors for the development of cardiovascular and renal disorders is hypertension. Epidemiological studies have indicated that the incidence and severity of hypertension are lower in women before menopause than in age-matched men.1 Also, studies performed with genetic (Dahl salt-sensitive and spontaneously hypertensive rats) or acquired animal models of hypertension [deoxycorticosterone acetate (DOCA)-salt- and aldosterone/salt-treated rats] have shown that females are less hypertensive than males.2–5 Blood pressure (BP) increases in female rats after ovariectomy are reversible by oestrogen (E2) replacement.2,3,5 Together, these data indicate that the lower incidence and severity of hypertension in females are due to the protective effect against hypertension by E2.
A large body of data indicate that E2 exerts its antihypertensive effect by acting on the cardiovascular and renal systems.6–10 Also, growing evidence suggests that the inhibitory action of E2 against hypertension involves the regulation of the renin–angiotensin–aldosterone system (RAAS) in the brain regions that control the output of the autonomic nervous system (ANS).11 We speculate that, at least in the case of salt-dependent hypertension, E2 achieves its antihypertensive effect by suppressing the release to the general circulation of arginine vasopressin (AVP), a neurohormone that has antidiuretic and vasoconstrictive effects and plays a crucial role in the pathogenesis of salt-dependent hypertension.12–15 E2 receptors (ERs) are expressed in the magnocellular AVP neurons of the supraoptic (SON) and paraventricular nuclei (PVN).16 It has also been reported that E2 inhibits both the osmotically evoked increase in AVP release and AVP mRNA content,17 while ERs contribute to extracellular fluid homeostasis by regulating AVP secretion.16 Finally, there is strong evidence that GABAergic inhibition is converted into excitation in magnocellular AVP neurons in the rat models of salt-dependent hypertension and this conversion contributes to the increase in AVP secretion which plays a crucial role in the development and maintenance of hypertension in the animal models.18–20 Using the rat model of DOCA-salt hypertension, we sought to test the hypothesis that E2 inhibits salt-dependent hypertension by preventing the inhibitory-to-excitatory transition of GABAergic transmission in magnocellular AVP neurons.
2. Methods
2.1 Animals
Sprague-Dawley rats (Orient Bio Co., Sungnam, Korea) were used in this study. They were housed in a temperature-controlled vivarium (23 ± 2°C) with a 12–12 h light-dark cycle from >7 days before the start of experiment till the end of the experiment. All the experiments were approved by Institutional Animal Care and Use Committee (KOREA-2016-0271), while conforming to the guidelines of the NIH (USA) and of the National Institutes of Health Guide for the Care and Use of Laboratory Animals. At the end of in vivo experiments, the rats were anaesthetized with isoflurane (2–3%, Hana Pharm, Seoul, Korea) and euthanized with CO2 gas. Meanwhile, those already anaesthetized with urethane for non-recovery procedures (see below) were killed by decapitation.
2.2 DOCA-salt hypertension model
At 6–7 weeks of age, rats were subjected to unilateral nephrectomy. A week later, they were injected weekly for 4–5 weeks with DOCA (30 mg/kg body weight in 0.4 mL of sesame oil, subcutaneous, SC) while being supplied with 1% NaCl solution as drinking fluid. All the surgeries were done in an aseptic condition, under isoflurane (2–3%) anaesthesia and sulpyrine [Sam-yang Anypharm, Seoul, Korea; 250 mg/kg body weight, single intramuscular (IM) injection] analgesia.
2.3 Ovariectomy and E2 replacement
Female rats were subjected to sham or genuine ovariectomy immediately after the uninephrectomy for the modelling of DOCA-salt hypertension (see above). Some ovariectomized rats were E2-replaced with an SC injection of E2 (2 μg in 100 μL sesame oil) on every 4th day21 during the DOCA-salt treatment period.
2.4 BP measurement
2.4.1 Tail cuff method
Tail cuff method (CODA2 Tail-Cuff BP system; Kent Scientific) was used as previously described18 for the measurement of systolic BP (SBP) from all the experimental rats. In brief, the rat was acclimatized to the restraint holder, and the tail was warmed on a warming pad for 15–20 min before the commencement of each cycle of 15 BP measurements. An average of >10 acceptable measurements was taken as the data point for each rat.
2.4.2 Telemetry method
Radio telemetry (TRM54P; KAHA Sciences) was additionally used in the study in which the effect of repetitive intraperitoneal (IP) injections of CLP290 on arterial BP (ABP) was continuously and chronically monitored in awake rats. The telemetry catheter was inserted into the left carotid artery under isoflurane (2–3%) anaesthesia ≥3 days before the experiment. The body of the telemetry device was fixed within the dorsal SC pocket with non-absorbable suture. Telemetry device-implanted rats were injected with an antibiotic (ubacillin; 50 mg/kg body weight, IM) twice a day for 3 days after the surgery. The ABP signals were digitized and sampled at 100 μs intervals (PowerLab, LabChart 7 pro; AD Instruments).
2.4.3 Direct method
For short-term, continuous monitoring of ABP in awake or urethane (1.25 g/kg body weight, single IP injection) anaesthetized rats, we measured BP directly through a polyethylene catheter (PE50) inserted into the left carotid artery, which was connected to bridge amplifier (FE224; AD Instruments) via a pressure transducer (MLT0699; AD Instruments). The ABP signals were digitized and sampled at 100 μs intervals.
2.5 Plasma sampling for the enzyme-linked immunosorbant assay of AVP or E2
Trunk blood was obtained by decapitation under urethane anaesthesia (1.25 g/kg body weight, single IP injection). For enzyme-linked immunosorbant assay (ELISA), blood samples were collected in vacutainer tubes containing anticoagulant K2-EDTA (BD biosciences) and protease inhibitor aprotinin (0.6 TIU/mL blood). The plasma, separated by the centrifugation of collected blood at 1600 g for 15 min at 4°C, was kept in a deep freezer (−80°C) until being used for AVP (AVP ELISA kit; Enzo Life Sciences) and E2 ELISA (17β-estradiol ELISA kit; Abcam). We performed AVP- and E2-ELISA according to the manuals. The AVP-ELISA was preceded by an extraction procedure suggested by the manual. The intra- and inter-assay coefficients of variation of AVP- and E2-ELISA were 6.143 and 11.427%, and 8.078 and 14.439%, respectively.
2.6 Measurement of the effects of AVP and V1a receptor antagonist on BP
The short-term effects on BP of AVP and the V1a receptor antagonist (Phenylac1,D-Tyr(Et)2,Lys6,Arg8,des-Gly9)-vasopressin were examined in rats under urethane anaesthesia (1.25 g/kg body weight, single IP injection), which drastically reduces the stress and/or movement-elicited noises and hence allows the detection of relatively small signals. The effects of AVP and (Phenylac1,D-Tyr(Et)2,Lys6,Arg8,des-Gly9)-vasopressin on BP were monitored through a PE50 tubing inserted into the left carotid artery. The polyethylene catheter was installed under urethane anaesthesia 1–2 h prior to the experiment. AVP and (Phenylac1, D-Tyr(Et)2,Lys6,Arg8,des-Gly9)-vasopressin were administered intravenously (IV) via a second catheter inserted into the right jugular vein.
2.7 Electrophysiology
Intracellular recordings from AVP neurons were obtained in SON slices (350–400 µm thickness) prepared as described previously.18,22 The SON was identified as a translucent region right next to the optic chiasm. The AVP neurons were identified according to their electrophysiological characteristics, i.e. little or no inward rectification at membrane potentials between −50 and −170 mV and/or phasic firing patterns (Supplementary material online, Figure S3A),18,23,24 we had shown that the cell identification based on the electrophysiology is very reliable.18,24 We recorded voltage or current signals from AVP neurons using the gramicidin-perforated patch-clamp recording technique, which preserves the intracellular Cl− concentration of the recorded cell.25 Stable perforated recording condition was usually achieved 10–25 min after seal was formed. Those recordings having steady series resistances (range 30–50 MΩ) and action potential amplitudes of >45 mV (measured from action potential threshold) were the only ones included in the data pool. The voltage errors resulting from the series resistance were compensated offline for voltage-clamp recordings and online for current-clamp recordings by using the bridge circuit. We corrected the liquid junction potential before the experiments; we set the pipette potential to −9 mV just before the formation of patch configuration, knowing that the liquid junction potential was 15.8 mV (at 34.5°C: temperature of slice-bathing medium) while the perforated patch potential arising from gramicidin perforation was −6.8 mV. We assumed that the change in resting membrane potential detected when the recording mode was transformed from perforated to whole-cell configuration represented the perforated patch potential.
To isolate the GABAergic postsynaptic potentials (PSPs) from glutamatergic PSPs in AVP neurons, we included in the slice perfusion medium the N-methyl-D-aspartate (NMDA) receptor blocker DL-2-amino-5 phosphonopentanoic acid (AP5, 50 µmole/L) and the non-NMDA receptor blocker 6,7-dinitroquinoxaline-2,3-dione (DNQX, 20 µmole/L).18,22,26
2.8 Intracerebroventricular infusion of drugs using osmotic mini-pump
To infuse E2 and its antagonist, ICI182780, into the cerebral ventricle of the rat, we used an osmotic mini-pump (Model 2002; Alzet,) which was connected to the infusion cannula (Brain Infusion Kit 2; Alzet) and positioned subcutaneously in the scapular region, as previously described.18 In brief, with the use of a stereotaxic instrument, we positioned the infusion cannula targeting the right lateral ventricular (AP: 1.0 mm from the bregma, ML: 1.6 mm from the midline, DV: 4 mm below the surface of the skull) in the rat anaesthetized with an IP injection of a mixture of ketamine (43 mg/kg body weight) and xylazine (8.7 mg/kg body weight). E2 and ICI182780 were dissolved in 20% hydroxypropyl-β-cyclodextrin (HPCD, vehicle) prior to infusion.
2.9 Western blot
Western blotting was performed for the SON tissues excised from hypothalamic slices as described previously.18,22 Since SON area is very small, tissues from 2 to 3 rats were pooled to form a single sample. Each sample was homogenized in 100 μL RIPA buffer (ELPIS Biotech.) containing protease and phosphatase inhibitors (Roche). Total protein concentration was determined using a bicinchoninic acid protein assay kit (Thermo Scientific), and the tissue lysate was denatured with SDS reducing buffer and heat (100°C, 5 min). The denatured lysate and prestained molecular size markers were resolved by 8% SDS-PAGE (12% for BDNF assay) and transferred to nitrocellulose membrane. Blots were incubated for 1 h at room temperature in blocking solution (5% skimmed milk in TBS containing 0.1% Tween 20) and then incubated overnight at 4°C in a blocking solution including the primary antibodies [mouse monoclonal anti-NKCC1 (1:300; Developmental Studies Hybridoma Bank), rabbit polyclonal anti-KCC2 (1:500; Millipore), mouse monoclonal anti-BDNF (1:500; Abcam), rabbit monoclonal anti-TrkB (1:1000; Thermo Fisher), rabbit polyclonal anti-TrkB pY515 (1:100; Abcam), or rabbit polyclonal anti-β-actin (1:1000; Santa Cruz Biotechnology)] and HRP-conjugated secondary antibodies (anti-mouse IgG or anti-rabbit IgG; 1:1000; Santa Cruz Biotechnology). The integrated optical density of bands was quantified using the ImageJ software (NIH). Each sample was normalized to the content of β-actin, a constitutively expressed protein.
2.10 Drugs
We purchased all the drugs and chemicals used in this study from Sigma-Aldrich, except muscimol (GABAA receptor agonist; Tocris), VU0463271 (KCC2 inhibitor; Tocris), (Phenylac1,D-Tyr(Et)2,Lys6,Arg8,des-Gly9)-vasopressin (V1a receptor antagonist; Bachem), CLP257, and CLP290 (KCC2 activators; gift from Dr Y. De Koninck at Université Laval, Québec, Canada).
2.11 Statistical analysis
All data plotted in bar charts indicate mean’s ± standard error of mean. Specific statistical tests employed for the analyses of data are given in each figure legend (see below). P < 0.05 was considered significant. This significance level, however, was reduced with the Bonferroni correction when the problem of multiple comparisons arises. In order to minimize the possibility that the observed effects in electrophysiological experiments arose from the use of specific animals, we obtained electrophysiological data from at least three rats for each experimental group (see below).
3. Results
3.1 E2 inhibits hypertension in female rats
In the DOCA-salt hypertension model, there is a clear evidence for sex differences as female rats develop hypertension with a slower trajectory and a reduced magnitude compared to males.5 These benefits are dependent upon sex hormones as ovariectomy makes the female more like the male while E2 replacement reverses the ovariectomy effects.27 In the present study, we first validated these prior findings by examining the effects of DOCA-salt treatment on SBP in male rats and three groups of female rats, i.e. sham ovariectomized rats (Sham), ovariectomized rats (OVX), and ovariectomized rats with E2 replacement (OVX+E2). Plasma E2 levels were significantly higher in Sham and OVX+E2 rats than OVX rats (Figure 1A), and OVX rats, like males, exhibited rapidly developing and large magnitude of increases in SBP in response to DOCA-salt treatment (Figure 1B). On the other hand, Sham rats showed more slowly developing and much smaller magnitude of increases in SBP in response to DOCA-salt treatment than did male rats (Figure 1B). Meanwhile, OVX+E2 rats showed no significant SBP changes in response to DOCA-salt treatment, as did Sham, OVX, and OVX+E2 rats that were not treated with DOCA-salt (Figure 1B). The faster and larger DOCA-salt treatment-induced increases in SBP in OVX rats than Sham and OVX+E2 animals were not due to greater saline drink intake nor ovariectomy-associated obesity. Although OVX rats had more saline drink intake on Day 16 compared to other groups of rats, the amounts of saline drink intake on other days were not significantly different among the animal groups (Supplementary material online, Figure S1A). Furthermore, DOCA-salt-untreated OVX rats, which had weight gain almost comparable to that of DOCA-salt-treated OVX rats (Supplementary material online, Figure S1B), showed no evidence of BP increase unlike DOCA-salt-treated OVX rats (Figure 1B). Collectively, these results provide a clear demonstration that E2 has a protective role against DOCA-salt hypertension in female rats.
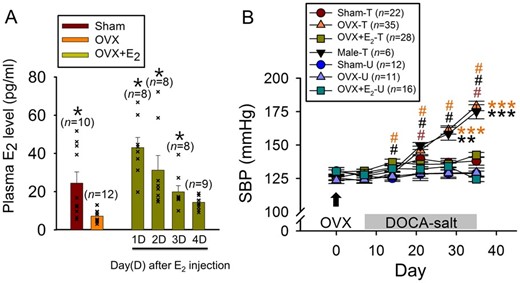
Protective role of E2 against DOCA-salt hypertension. (A) Plasma levels of E2 in Sham, OVX, and OVX+E2 rats. In OVX+E2 rats, the E2 level was measured at 1–4 days after a single E2 injection (2 μg in 100-μL sesame oil, SC). *P < 0.05 compared with OVX (Kruskal–Wallis one-way ANOVA on ranks followed by pairwise comparison with Dunn’s Method). n: number of rats. (B) Effects of DOCA-salt treatment on the SBP in male and female (Sham, OVX, and OVX+E2) rats. #P < 0.05 compared with the value on Day 7 in a given group; **P < 0.01, ***P < 0.001 compared with Sham-T, OVX-E2-T, Sham-U, OVX-U, and OVX+E2-U groups (two-way repeated measures ANOVA followed by pairwise comparison with the Holm–Sidak procedure; group × time: P < 0.001, group: P < 0.001, time: P < 0.001). T and U in the key box indicate DOCA-salt-treated and untreated, respectively.
3.2 E2 suppresses AVP release and, hence, AVP-mediated vasoconstriction
AVP-evoked vasoconstriction has been reported to contribute to the development and/or maintenance of DOCA-salt hypertension.28 E2 may inhibit hypertension by suppressing AVP release, thus reducing V1a receptor-mediated vasoconstriction, or by lowering the responsiveness of the V1a receptor. To distinguish between these possibilities, we carried out three sets of experiments. First, we measured the effects of an IV-injected V1a receptor antagonist [(Phenylac1,D-Tyr(Et)2,Lys6,Arg8,des-Gly9)-vasopressin, 300 μg/kg body weight] on BP in DOCA-salt-treated Sham, OVX, and OVX+E2 rats. The V1a receptor antagonist suppressed BP more in OVX, than Sham or OVX+E2, rats (Figure 2A–C). Second, we measured the plasma AVP levels in Sham, OVX, and OVX+E2 rats that were either treated or untreated with DOCA-salt. Plasma AVP levels were significantly higher in DOCA-salt-treated OVX, than Sham or OVX+E2, rats (Figure 2D), whereas they were not different across DOCA-salt-untreated Sham, OVX, and OVX+E2 rat groups (Figure 2D). Lastly, we compared the pressor effects of IV injected AVP in DOCA-salt-untreated Sham, OVX, and OVX+E2 rats at 11–12 weeks of age. The pressor effects of AVP examined at three different doses (10, 100, 1000 ng/kg body weight, IV) were not significantly different across the different rat groups, although there was a clear dose-dependence (Supplementary material online, Figure S2). Taken together, these results indicate that E2 inhibits DOCA-salt hypertension by suppressing AVP release and, hence, attenuating V1a receptor-mediated vasoconstriction, but not by reducing the responsiveness of vascular AVP receptors.
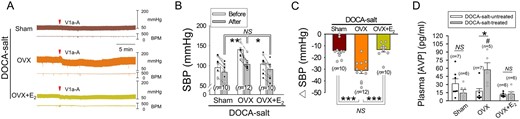
E2 attenuates AVP-mediated vasoconstriction by suppressing AVP release in female rats. (A) Representative traces showing the effects of IV-injected V1a receptor antagonist on BP in Sham, OVX, and OVX+E2 rats treated with DOCA-salt for 4 weeks. BPM, beats per minute. (B) SBP measured before and after the injection of the antagonist in the three rat groups above. *P < 0.05, **P < 0.01 (analysis of covariance followed by Bonferroni test). (C) Plots showing the amounts of changes in SBP (Δ SBP) induced by the AVP receptor antagonist injection. The effect of the antagonist was defined as the difference between the baseline SBP averaged over the 5-min period immediately before the drug injection and a peak of the SBP response averaged over a 30-s period. ***P < 0.001, NS, statistically not different in this and following figures (one-way ANOVA followed by pairwise comparison with the Holm–Sidak procedure). (D) Plasma levels of AVP in Sham, OVX and OVX+E2 rats that were or were not treated with DOCA-salt. (#significant difference from Sham and OVX+E2 groups, *P < 0.05; two-way ANOVA followed by pairwise comparison with the Holm–Sidak procedure, group × treatment: P = 0.004, group: P = 0.033, treatment: P = 0.225). The data were log‐transformed to fulfil the model assumptions for two-way ANOVA. n: number of rats (in B–D).
3.3 E2 inhibits the emergence of GABAergic excitation in AVP neurons
To test the possibility that E2 suppresses DOCA-salt hypertension by inhibiting the inhibitory-to-excitatory-transition of GABAergic transmission in AVP neurons, we examined GABAergic PSP profile and GABA equilibrium potential (EGABA) in the AVP neurons of Sham, OVX, and OVX+E2 rats that were or were not treated with DOCA-salt. The AVP neurons were sampled in SON slices prepared from these six groups of rats and identified according to their electrophysiological characteristics (Supplementary material online, Figure S3A),23,24,29 while the EGABA in these cells was estimated as in Supplementary material online, Figure S3B. The GABAergic PSPs recorded in the AVP neurons of Sham, OVX, and OVX+E2 rats that were not treated with DOCA-salt were mostly inhibitory (i.e. IPSPs) (Figure 3A and B), and the EGABA was generally negative to action potential threshold, which was about −45 mV (Figure 3C). The GABAergic PSPs in the AVP neurons of Sham and OVX+E2 rats that were treated with DOCA-salt were also mostly inhibitory (i.e. IPSPs) (Figure 3A and B), with the EGABA of these cells again being generally negative to action potential threshold (Figure 3C). On the other hand, the GABAergic PSPs in the AVP neurons of DOCA-salt-treated OVX rats were mostly excitatory (i.e. EPSPs) due to the depolarized EGABA beyond the action potential threshold (Figure 3, Supplementary material online, Figure S3C and D). These results are consistent with the hypothesis that E2 suppresses DOCA-salt hypertension by inhibiting the conversion of GABAergic inhibition to excitation in AVP neurons.
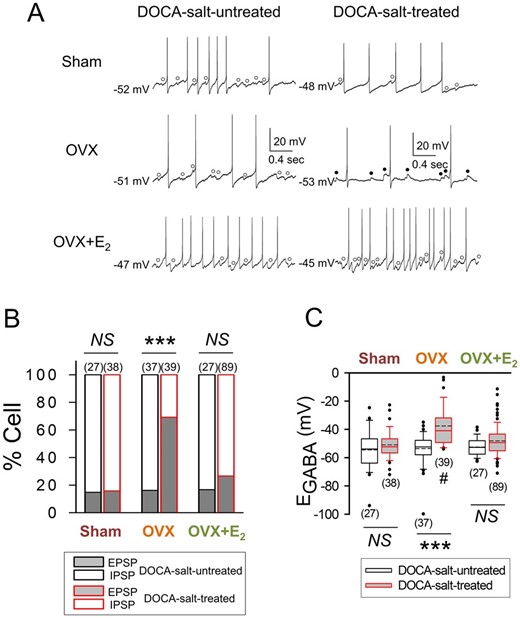
DOCA-salt treatment increases GABAergic excitation in AVP neurons in OVX rats. (A) Voltage traces showing GABAA receptor-mediated spontaneous IPSPs (○) and EPSPs (●) recorded in the AVP neurons of Sham, OVX, and OVX+E2 rats that were or were not treated with DOCA-salt. The baseline membrane potential is indicated to the left of each voltage trace. (B and C) Graphs summarizing the effects of DOCA-salt treatment on the proportions of AVP neurons showing GABAA receptor-mediated IPSPs and EPSPs (***P < 0.001, Fisher’s exact test) and on the EGABA of these cells in Sham, OVX, and OVX+E2 rats (#significant difference from Sham and OVX+E2 groups; ***P < 0.001, two-way ANOVA followed by pairwise comparison with the Holm–Sidak procedure; group × treatment: P = 0.001, group: P < 0.001, treatment: P < 0.001). Number in parentheses: number of cells (data from 7 to 16 rats).
The electrophysiological data, however, do not exclude the possibility that the E2 effect on the GABAergic transmission is mediated through peripheral ERs. To address this issue, we examined the effects of E2 infused intracerebroventricular for a week in the last week of DOCA-salt treatment (5 weeks) on SBP, GABAergic PSP profile and the EGABA of AVP neurons in OVX rats. The electrophysiological recordings were obtained from the SON slices prepared from these animals. The E2 infusion (20 μg/kg body weight/day)2 substantially lowered SBP, whereas the infusion of vehicle (20% HPCD) or E2 along with its blood-brain barrier-impermeable antagonist, ICI182780 (1.5 μg/kg body weight/day),2,30 did not significantly alter the SBP (Figure 4A). The E2 infusion also reduced the proportion of AVP neurons having GABAergic EPSPs (Figure 4B) by hyperpolarizing the EGABA (Figure 4C). This E2 effect was prevented by ICI182780 co-infused with E2 (Figure 4B and C). Thus, these results suggest that the effects of E2 on the DOCA-salt treatment-induced increase in SBP and changes in GABAergic transmission in AVP neurons are mediated through central ERs.
![E2 acts centrally to suppress the DOCA-salt treatment-induced hypertension and emergence of GABAergic excitation in AVP neurons. (A–C) The effects of E2, a combination of E2 and its antagonist, ICI182780 (ICI), and vehicle (20% HPCD) infused intracerebroventricular on the SBP (A) and the GABAergic PSP profile (B) and EGABA’s (C) of the AVP neurons of DOCA-salt-treated OVX rats. In (A), *P < 0.05, **P < 0.01 (analysis of covariance followed by Bonferroni test); n: number of rats. In (B and C), *P < 0.05, **P < 0.01, ***P < 0.001, n: number of cells (data from 6 to 8 rats, Fisher’s exact test in B and Kruskal–Wallis one-way ANOVA on ranks followed by pairwise comparison with Student–Newman–Keuls method in C). (D and E) The effects of E2, a combination of E2 and its antagonist [MPP (ERα), PHTPP (ERβ) or ICI (non-selective)] and vehicle (dimethyl sulfoxide, DMSO, final concentration: 0.02%), applied directly to the SON slices via the tissue perfusion medium on the EGABA’s of AVP neurons. Each data point denoted with different symbols in (D) indicates the EGABA value estimated for an AVP neuron sampled at the time indicated in the graph. The bar charts in (E) are the mean (±SEM) EGABA values of the AVP neurons sampled 0–4 h before and 0–12 h after the application of drug(s) or vehicle in (D). In (D), 32, 32, 43, 54, and 39 AVP neurons were sampled in vehicle-, E2-, E2+ICI-, E2+MPP-, and E2+PHTPP-applied SON slices from 5, 4, 4, 6, and 3 rats, respectively. The red dotted line denotes the approximate action potential threshold. In (E), * (P < 0.05) and NS: within-group comparison, # (P < 0.05): between-group comparison (two-way ANOVA followed by pairwise comparison with the Holm–Sidak procedure; group × treatment: P = 0.454, group: P = 0.146, treatment: P < 0.001). n: number of cells.](https://oup.silverchair-cdn.com/oup/backfile/Content_public/Journal/cardiovascres/117/10/10.1093_cvr_cvaa271/3/m_cvaa271f4.jpeg?Expires=1750480937&Signature=5FR0iMDqJVGkJrPfhFKZwG5qYfNx85spLbovPI5JYjCiQb-z79UcRz7~rlsEY6vdp-~vpoFHikjq8rR6usDswJS5atNhfG-jLHv1ozP11MeAU8O-ZYzyeJX7WqapmAHqvBbScNlTn6l32CRgwK35xLC3ZNJG~pP93-Kk2bIgUQs89izkNyK8lEW-4C9UtHmMUOTWAQ-6LiUDmq0-mStdJFzRL3K2IBj74SPA5NTKH50LRWCz~r6TwxVRw8DhbvvjHvc9SJuoc9JXCoGVU3q7PIsqS-EbcV10nQXoQGY2H30L8fMnbBlDEU5Tr8Og3g07kHBtKpLSeM87HJRFj5DbHw__&Key-Pair-Id=APKAIE5G5CRDK6RD3PGA)
E2 acts centrally to suppress the DOCA-salt treatment-induced hypertension and emergence of GABAergic excitation in AVP neurons. (A–C) The effects of E2, a combination of E2 and its antagonist, ICI182780 (ICI), and vehicle (20% HPCD) infused intracerebroventricular on the SBP (A) and the GABAergic PSP profile (B) and EGABA’s (C) of the AVP neurons of DOCA-salt-treated OVX rats. In (A), *P < 0.05, **P < 0.01 (analysis of covariance followed by Bonferroni test); n: number of rats. In (B and C), *P < 0.05, **P < 0.01, ***P < 0.001, n: number of cells (data from 6 to 8 rats, Fisher’s exact test in B and Kruskal–Wallis one-way ANOVA on ranks followed by pairwise comparison with Student–Newman–Keuls method in C). (D and E) The effects of E2, a combination of E2 and its antagonist [MPP (ERα), PHTPP (ERβ) or ICI (non-selective)] and vehicle (dimethyl sulfoxide, DMSO, final concentration: 0.02%), applied directly to the SON slices via the tissue perfusion medium on the EGABA’s of AVP neurons. Each data point denoted with different symbols in (D) indicates the EGABA value estimated for an AVP neuron sampled at the time indicated in the graph. The bar charts in (E) are the mean (±SEM) EGABA values of the AVP neurons sampled 0–4 h before and 0–12 h after the application of drug(s) or vehicle in (D). In (D), 32, 32, 43, 54, and 39 AVP neurons were sampled in vehicle-, E2-, E2+ICI-, E2+MPP-, and E2+PHTPP-applied SON slices from 5, 4, 4, 6, and 3 rats, respectively. The red dotted line denotes the approximate action potential threshold. In (E), * (P < 0.05) and NS: within-group comparison, # (P < 0.05): between-group comparison (two-way ANOVA followed by pairwise comparison with the Holm–Sidak procedure; group × treatment: P = 0.454, group: P = 0.146, treatment: P < 0.001). n: number of cells.
To obtain further evidence for this hypothesis, we examined the effect of bath-applied E2 (100 nmole/L)31 on the EGABA in AVP neurons recorded in the SON slices from OVX rats that were or were not treated with DOCA-salt for 4 weeks. In the slices from DOCA-salt treated rats, the application of E2 resulted in a significant hyperpolarization of EGABA (Figure 4D and E) in a fashion that could be prevented by co-applied ICI182780 (non-selective ER antagonist, 1 μmole/L)31 or 2-Phenyl-3-(4-hydroxyphenyl)-5,7-bis(trifluoromethyl)-pyrazolo[1,5-a]pyrimidine, 4-[2-Phenyl-5,7-bis(trifluoromethyl)pyrazolo[1,5-a]-pyrimidin-3-yl]phenol (PHTPP, selective ERβ antagonist, 1 μmole/L),32 but not 1,3-Bis(4-hydroxyphenyl)-4-methyl-5-[4-(2-piperidinylethoxy)phenol]-1H-pyrazole dihydrochloride (MPP, selective ERα antagonist, 5 μmole/L). On the other hand, E2 application had no significant effect on the EGABA in the cells recorded in the slices from DOCA-salt untreated rats (Supplementary material online, Figure S4). Thus, these results support the hypothesis that E2 acts via ERβ in the hypothalamus to suppress the DOCA-salt treatment-induced conversion of GABAergic inhibition to excitation in AVP neurons.
3.4 E2 suppresses the emergence of GABAergic excitation in AVP neurons by modulating NKCC1 and KCC2
EGABA and the polarity of GABAA receptor-mediated PSPs in central nervous system (CNS) neurons can be altered by changes in the expression and/or the activity of the Cl− co-transporters NKCC1 and KCC2.33 We speculated that E2 might keep GABAergic excitation from emerging by modulating the expression and/or activities of NKCC1 and KCC2 in AVP neurons. We tested this possibility first by examining the effects on EGABA of the NKCC1 inhibitor bumetanide (10 μmole/L) and the KCC2 inhibitor VU0463271 (5 μmole/L) in AVP neurons sampled in the SON slices from Sham, OVX, and OVX+E2 rats treated with DOCA-salt. In the AVP neurons of Sham and OVX+E2 rats, bath-applied bumetanide did not significantly alter EGABA (Figure5A and C, upper panels), whereas in the cells of OVX rats, it significantly hyperpolarized EGABA (Figure 5B, upper panel). This effect of bumetanide was accompanied by a significant change in the GABAergic PSP profile, i.e. the ratio of neurons showing GABAergic EPSPs and IPSPs changes from 8:2 to 0:10 (P ≤ 0.001; Fisher’s exact test). Meanwhile, bath-application of VU0463271 brought about a significant, reversible depolarizing shift of EGABA in the AVP neurons of Sham and OVX+E2 rats (Figure 5A and C, lower panels). These effects of VU0463271 were accompanied by changes in the ratio of neurons showing GABAergic EPSPs and IPSPs (2:10 to 10:2 in Sham, P ≤ 0.001 and 1:11 to 9:3 in OVX+E2, P ≤ 0.001; Fisher’s exact test). In the cells of OVX rats, VU0463271 was without effect (Figure 5B, lower panel). Taken together, these results suggest that E2 suppresses the emergence of GABAergic excitation in the AVP neurons of DOCA-salt-treated OVX rats by decreasing the activity of NKCC1 as well as increasing the activity of KCC2.
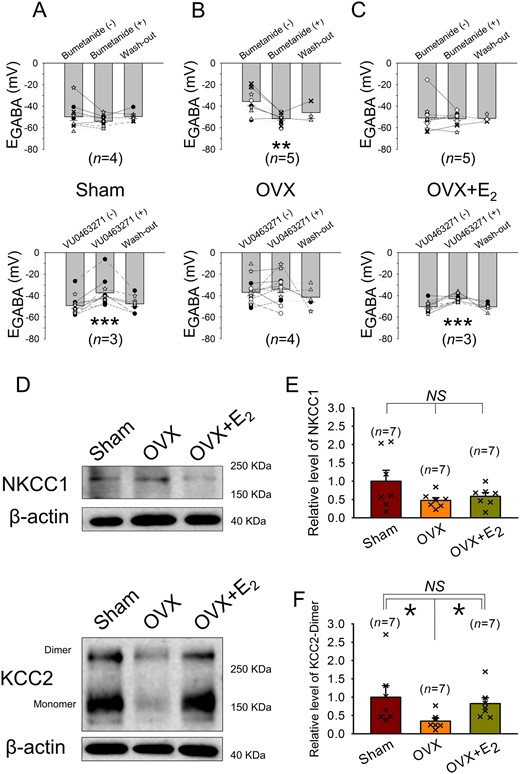
In female rats, E2 may suppress the depolarization of EGABA in AVP neurons associated with DOCA-salt treatment by inhibiting the up-regulation of NKCC1 and down-regulation of KCC2. (A–C) Effects of the NKCC1 blocker bumetanide (10 μmole/L) and the KCC2 blocker VU0463271 (5 μmole/L) on EGABA in AVP neurons recorded in the SON slices from DOCA-salt-treated Sham, OVX, and OVX+E2 rats. The bar charts are the EGABA values of these cells. The symbols connected by lines indicate data from the same cells, and the same kind of symbols indicate that they were from the same rat. n: number of rats used for the preparation of the SON slices. **P < 0.01, ***P < 0.001 compared with the value before drug application (one-way repeated measures ANOVA followed by pairwise comparison with the Holm–Sidak procedure). (D) NKCC1 (145∼205 KDa), KCC2 (140∼270 KDa), and β-actin (∼40 KDa) bands recognized by western blotting of the SON tissues from DOCA-salt-treated Sham, OVX and OVX+E2 rats. (E and F) Bar charts showing the relative levels of NKCC1 and KCC2 in the SON of these rats. For each experiment, values were normalized to the mean value of the samples collected from Sham rats. *P < 0.05 (Kruskal–Wallis one-way ANOVA on ranks followed by pairwise comparison with Student–Newman–Keuls method). n: number of samples.
Next, we investigated the expression levels of NKCC1 and KCC2 in the SON tissues from Sham, OVX, and OVX+E2 rats treated with DOCA-salt. Western blotting with NKCC1 and KCC2 antibodies revealed that the levels of NKCC1 expression (detected as 145–205 KDa bands, with the major band being ∼200 KDa) were not significantly different among the three groups (Figure 5D and E). In contrast, the expression level of KCC2 (dimer, the active form; detected as ∼270 KDa band)34 was significantly lower in OVX group than those in Sham and OVX+E2 groups (Figure 5D and F). These results raise the possibility that E2 suppresses the emergence of GABAergic excitation in AVP neurons, in part, by preventing the DOCA-salt treatment-induced decrease in KCC2 expression.
3.5 E2 may suppress hypertension in male rats through a similar mechanism
To determine whether E2 could inhibit hypertension from DOCA-salt treatment in the male and identify the underlying mechanisms, we examined the effects of E2 on SBP, plasma AVP, GABAergic transmission in AVP neurons, and the expression levels of NKCC1 and KCC2 in the SON in DOCA-salt-treated male rats. E2 (2 μg in 100-μL sesame oil, SC) was injected along with DOCA every 4th day for 4 weeks. The administration of E2 retarded the rise of SBP induced by DOCA-salt treatment (Figure 6A) and resulted in a significant increase in the plasma level of E2 (Figure 6B, upper panel). In addition, E2 treatment lowered plasma AVP level (Figure 6B, lower panel) and hyperpolarized EGABA in AVP neurons, thereby substantially reducing the proportion of cells exhibiting GABAergic EPSPs (Figure 6C and D). Lastly, E2 administration normalized the increased NKCC1 and decreased KCC2 levels caused by DOCA-salt treatment (Figure 6E–G). It was noted that major band detected in the SON tissue samples of male rats with NKCC1 antibody was ∼150 KDa unlike the one detected in female SON tissue samples (i.e. ∼200 KDa). Taken together, the results above indicate that exogenous E2 administration can suppress the development of DOCA-salt hypertension in the male rat. Moreover, they suggest that this antihypertensive effect is due to that E2 inhibits AVP release by blocking the emergence of GABAergic excitation in AVP neurons through the modulation of NKCC1 and KCC2.
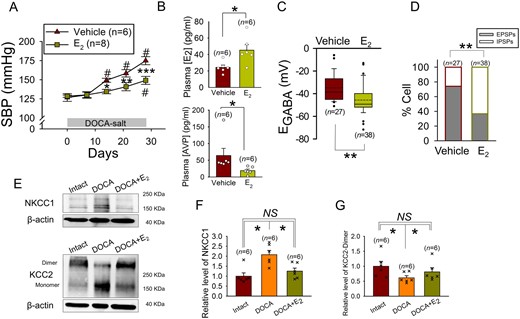
In male rats, E2 inhibits DOCA-salt induced hypertension and secretion of AVP. (A) Effect of E2 injection on the rise of SBP induced by DOCA-salt treatment in the male rat. #Significant difference from the value on Day 0; *P < 0.05, **P < 0.01, ***P < 0.001 compared with vehicle (two-way repeated measures ANOVA followed by pairwise comparison with the Holm–Sidak procedure; group × time: P = 0.001, group: P = 0.013, time: P < 0.001); n: number of rats. (B) The effects of E2 injection on the plasma levels of E2 and AVP in the DOCA-salt-treated male rat. *P < 0.05 compared with vehicle (top panel: Student t-test, bottom panel: Mann–Whitney rank sum test), n: number of rats. (C and D) Effects of E2 injection on the EGABA’s and GABAergic PSP profile of the AVP neurons of DOCA-salt-treated male rat. **P < 0.01 compared with vehicle (Mann–Whitney rank sum test in C) and (Fisher’s exact test in D), n: number of cells (data from 6 to 8 rats). (E) NKCC1 (145∼205 KDa), KCC2 (140∼270 KDa), and β-actin (∼40 KDa) bands recognized by western blotting of the SON tissues from control (Intact), DOCA-salt-treated (DOCA), and DOCA-salt- and E2-treated (DOCA+E2) male rats. (F and G) Bar charts showing the relative levels of NKCC1 and KCC2-dimer in the SON of these rats. For each experiment, values were normalized to the mean value of the samples collected from control rats. *P < 0.05 (Kruskal–Wallis one-way ANOVA on ranks followed by pairwise comparison with Student–Newman–Keuls method). n: number of samples.
3.6 CLP290, a prodrug of the KCC2 activator CLP257, may be an effective therapeutic agent against salt-dependent hypertension
We hypothesized that pharmacological agents modulating the activity/expression of NKCC1 or KCC2 might be effective in inhibiting salt-dependent hypertension. Recent work35 describes a class of KCC2-selective analogues (CLP257) that restore impaired Cl− transport in neurons with diminished KCC2 activity. An orally or peritoneally36 effective CLP257 prodrug was also described (CLP290). Therefore, we compared the effects of bath-applied E2 and CLP257 on the EGABA of AVP neurons in SON slices prepared from DOCA-salt-treated or -untreated OVX rats. Bath applications of E2, CLP257 and the mixture of these agents resulted in the hyperpolarization of EGABA in the cells of DOCA-salt-treated, but not untreated, rats (Figure 7A). The hyperpolarization produced by CLP257 was not significantly different in the extent from that induced by E2 or the mixture of both agents (Figure 7A, left panel), suggesting that CLP257 and E2 are working through the same pathway.
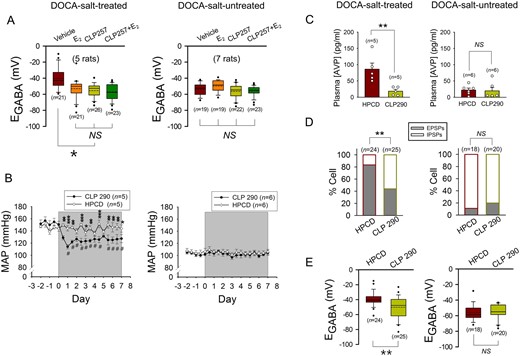
Pharmacological activation of KCC2 in DOCA-salt-treated OVX rats induces the hyperpolarization of EGABA in AVP neurons and decreases systemic AVP secretion to inhibit hypertension. (A) Effects of the bath applications of E2 (100 nmole/L), CLP257 (25 μmole/L), and a mixture of these agents on the EGABA of AVP neurons of DOCA-salt-treated or -untreated OVX rats. ***P < 0.001 (one-way ANOVA followed by pairwise comparison with the Holm–Sidak procedure). n: number of cells. (B and C) Effects of IP injection of CLP290 (100 mg/kg body weight, twice a day for 1 week; shaded period) and vehicle (20% HPCD) on MAP (B) and plasma AVP level (C) in OVX rats that were (left panels) or were not (right panels) treated with DOCA-salt for 5 weeks. CLP290 and vehicle were administered during the last week. BP was measured in awake condition with radio telemetry. #Significant difference from the value on Day 0; *P < 0.05, **P < 0.01, ***P < 0.001 compared with vehicle (two-way repeated measures ANOVA followed by pairwise comparison with the Holm–Sidak procedure in B, left panel: group × time: P < 0.001, group: P = 0.008, time: P < 0.001, right panel; group × time: P = 0.960, group: P = 0.593, time: P = 0.007). **P < 0.01 in C (Student t-test). n: number of rats. (D and E) Effects of CLP290 and vehicle (20% HPCD) on the GABAergic PSP profile (D) and EGABA’s (E) of the AVP neurons of OVX rats that were (left panels) or were not (right panels) treated with DOCA-salt. These neurons were recorded in the SON slices prepared from the OVX rats after the last administration of CLP290 or vehicle. **P < 0.01 (D: Fisher’s exact test, E: Student’s t-test). n: number of cells (data from four rats each).
Next, we examined the effects of IP administered CLP290 on mean arterial pressure (MAP), plasma AVP level and GABAergic transmission in AVP neurons in DOCA-salt-treated and -untreated OVX rats. In the DOCA-salt-treated rats, CLP290 significantly lowered MAP and plasma AVP level and decreased the proportion of AVP neurons showing GABAergic EPSPs by hyperpolarizing EGABA (Figure 7B–E, left panels). Meanwhile, in DOCA-salt-untreated control rats, CLP290 altered neither MAP and plasma AVP level nor the GABAergic PSP profile and EGABA (Figure 7B–E, right panels). Thus, these results support the possibility that drugs modulating the activity/expression of KCC2 could be effective as therapeutic treatments against salt-dependent hypertension.
4. Discussion
In this study, using the DOCA-salt hypertension rat model, we sought to determine the mechanism through which E2 inhibits salt-dependent hypertension. The development and maintenance of this kind of hypertension are known to heavily rely on increased AVP secretion,28 which results at least partly from the conversion of GABAergic inhibition to excitation in magnocellular AVP neurons.18–19 As such, we hypothesized that the suppression by E2 of the inhibitory-to-excitatory transition of GABAergic transmission in these cells underpins the effect of E2 against salt-dependent hypertension. The results from the current study support this hypothesis. Furthermore, they indicate that E2 through its action at ERs in the hypothalamus modulates the activity/expression of the chloride transporters NKCC1 and KCC2 in AVP neurons, to inhibit the transition of GABAergic transmission. To the best of our knowledge, this study is the first that identifies the mechanism of the antihypertensive effect of E2 at the levels of specific molecules in a neuronal population.
Magnocellular AVP neurons are located in both the SON and PVN. In the current study, we did not study the PVN but focused our attention on the SON since magnocellular neurons in both of these nuclei have very similar function (i.e. secreting the neurohormone AVP that has vasoconstrictive and antidiuretic effects). Of course, parvocellular PVN neurons could also play a role in the generation of DOCA-salt hypertension37 and, therefore, be the target of E2. Future studies will need to explore the relative contributions of AVP neurons in the SON and PVN to the hypertensive response.
Previous work suggested that increased sympathetic activity (as well as enhanced AVP secretion) plays a crucial role in the development and/or maintenance of DOCA-salt hypertension (for review, see Yemane et al. 2010).28 In addition, it has been reported that presympathetic neurons in the PVN receive excitatory afferents from AVP neurons,38 cells through which E2 seems to exert the antihypertensive effect (see above). Thus, it is possible that the antihypertensive effect of E2 in the DOCA-salt model arises partly from the E2 suppression of sympathetic activity. However, we found that the reduction of SBP and the increase of heart rate that followed the IV injection of the α1-adrenoceptor antagonist prazosin were not significantly different in magnitude among Sham, OVX, and OVX+E2 rats treated with DOCA-salt for 4 weeks (Supplementary material online, Figure S5). Furthermore, we discovered that the DOCA-salt treatment had no significant effect on the urinary norepinephrine level in all of the three groups of rats, although it increased the epinephrine level slightly in OVX+E2 rats (Supplementary material online, Figure S6). Thus, it is unlikely that E2 inhibits DOCA-salt hypertension by suppressing the sympathetic activity.
A previous study has provided evidence that chronic high salt intake impairs GABAergic inhibition in AVP neurons through a brain-derived neurotrophic factor (BDNF)-dependent activation of tropomyosin receptor kinase B (TrkB) and the resultant down-regulation of KCC2 expression.19 Thus, we thought that E2 might inhibit hypertension in the DOCA-salt model rat by keeping DOCA-salt treatment from activating the BDNF-TrkB pathway in AVP neurons. However, our western blot experiments revealed that the levels of BDNF, TrkB, and phosphorylated TrkB in the SON were not significantly different among Sham, OVX, and OVX+E2 rats that were treated with DOCA-salt for 4 weeks (Supplementary material online, Figure S7), suggesting that E2 is not working through the BDNF-TrkB pathway in exerting its antihypertensive effect.
Our results suggest that the mechanism of the E2 inhibition of salt-dependent hypertension is similar between males and females. Although the effect of E2 against DOCA-salt hypertension was less prominent in the male than the female (∼26 mmHg vs. 37–41 mmHg, Figures1B and 6A) and there was an apparent sex difference in the E2 effect on the DOCA-salt treatment-induced change in NKCC1 expression in the SON, the effects of E2 on other changes induced by DOCA-salt treatment were by and large identical between both sexes. As in female rats, E2 in the male opposed the increase in plasma AVP level, suppressed the depolarizing shift of EGABA and the resultant emergence of GABAergic excitation, and inhibited the KCC2 down-regulation in the SON tissue. The apparent sex difference in the effect of E2 on the NKCC1 expression might be related to the fact that the major bands reacted with NKCC1 antibody were different between the male and female. Or, it might reflect our use in the western blot experiments of the SON tissues, which contain not only AVP neurons but also oxytocin neurons and glial cells.
Previous work has indicated that E2 acts through the cardiovascular and renal systems to exert its antihypertensive effect.6–10 Also, accumulating evidence suggests that the effect of E2 against hypertension is dependent upon its modulating effect on the RAAS in the CNS regions that control the output of the ANS.11 On the other hand, the results of the current study indicate that E2 inhibits salt-dependent hypertension by modulating GABAergic transmission in magnocellular AVP neurons (Figure 3) to reduce AVP secretion (Figure 2D), and hence, vasoconstriction (Figure 2A–C). The present study was not designed to measure exactly how much this process contributes to the antihypertensive effect of E2. However, we found that, after 4 weeks of DOCA-salt treatment, the SBP was increased by ∼56 mmHg in OVX rats, while 9–12 mmHg in Sham and OVX+E2 rats (Figure 1B), and the magnitude of the depressor responses elicited by IV-injected V1a AVP receptor antagonist was ∼31 mmHg in OVX rats while 13–14 mmHg in Sham and OVX+E2 rats (Figure 2C). In addition, we discovered that, in DOCA-salt-treated OVX rats, IP-administered CLP290 (KCC2 activator), a drug which seems to work through the same pathway as does E2 in AVP neurons (Figure 7A), dampened the hypertension established in these animals by ∼24 mmHg (Figure 7B). Thus, these results allow us to estimate that the amount of BP reduction by E2 in DOCA-salt-treated female rats was 44–47 mmHg and at least 37–53% of this (i.e. 17–24 mmHg) resulted from the E2 effect on AVP neurons. This estimation highlights that the effect of E2 against salt-dependent hypertension heavily depends on its action through the hypothalamic AVP system.
There are some limitations in the methodology used in the present study. The tail cuff plethysmography is associated with significant restraint (i.e. 15–20 min of prior restraint) and thermal (tail warming) stress. Even with prior ‘training’ of the animals, the stress may affect the findings. However, the results of BP measurements obtained with the tail cuff method correlated strongly with those obtained with radio telemetry (Supplementary material online, Figure S8), minimizing this concern. The use of urethane anaesthesia in measuring the plasma AVP levels is another pitfall. It has been reported that anaesthetics elevate plasma AVP levels.39 The plasma AVP levels detected in our DOCA-salt-untreated female rats were two to three times higher than the normal resting AVP levels (2–5 pg/mL) reported for unstressed, unanaesthetized rats. This may be a reflection of the urethane effect. However, we do not think, the higher baseline levels would prevent the detection of the difference in plasma AVP levels among different rat groups that were or were not treated with DOCA-salt. E2 and CLP290 clearly inhibited the DOCA-salt treatment-induced rise of plasma AVP levels (Figures 2D, 6B, and 7C). Even if urethane generated some noise, the changes in AVP levels were dramatic.
5. Conclusion
Hypertension is a key risk factor for cardiovascular disease and a leading cause of death in both women and men.40 Numerous studies have shown that sex steroids can impact BP and premenopausal women have a lower prevalence of hypertension than age-matched men. The causal mechanisms are not clear and hormone replacement therapy with E2 does not consistently lower BP in postmenopausal women.41 Using the DOCA-salt hypertension rat model, we provide evidence that E2 inhibits salt-dependent hypertension by suppressing GABAergic excitation to decrease the output of AVP neurons. Our data raise the possibility that the pathways controlling GABAergic excitation in AVP neurons would provide novel targets to reduce salt-dependent hypertension.
Supplementary material
Supplementary material is available at Cardiovascular Research online.
Authors’ contributions
X.J., W.B.K., Y.-B.K., and Y.I.K. designed this project. X.J., W.B.K., M.-N.K., W.W.J., H.K.K., E.H.H., Y.S.K., and Y.-B.K. performed the experiments and analysed the results. W.J.S. and H.C.H. contributed essential experimental advice for measurement of blood pressure with telemetry method. C.S.C., Y.-B.K., and Y.I.K. wrote the manuscript. All authors reviewed and approved the final manuscript. The order of co-first authors was determined by lot.
Conflict of interest: There is no conflict of interest.
Funding
This work was supported by the National Research Foundation of Korea (NRF) grants funded by the Korea government (MSIP) to Y.I.K. (2014R1A2A1A11049900, 2017R1A2B2002277) and Y.-B.K. (2016R1D1A1B03932771, 2019R1I1A1A01057744) and by the Korea University grant to Y.-B.K. X.J., W.B.K., W.W.J., H.K.K.,Y.S.K., Y.-B.K., and Y.I.K. were supported by the Brain Korea 21 Project from 2009 to 2019.
Data availability
The data underlying this article are available in the article and in its online supplementary material.
References
Numerous studies have shown that sex steroids can impact blood pressure (BP) and premenopausal women have a lower incidence of hypertension than age-matched men. Postmenopausal women no longer enjoy this beneficial difference. The causal mechanisms are not clear and hormone replacement therapy with oestradiol (E2) does not consistently lower BP in postmenopausal women. In this study, we showed that rats treated with CLP290 to control GABAergic excitation in AVP neurons have the same phenotype as E2-supplemented rats in BP and plasma AVP level. This result indicates that CLP290 leverages the same pathway of E2 protective effects against salt-dependent hypertension, and therefore, raises the possibility that classes of drugs like CLP290 may have some utility as alternative antihypertensives in persons resistant to or contraindicated for E2 therapy.
Author notes
Xiangyan Jin and Woong Bin Kim contributed equally to this work.
