


Abstract
We study the long-term effects of a randomized intervention targeting children's socio-emotional skills. The classroom-based intervention for primary school children has positive impacts that persist for over a decade. Treated children become more likely to complete academic high school and enrol in university. Two mechanisms drive these results. Treated children show fewer attention deficit/hyperactivity disorder symptoms: they are less impulsive and less disruptive. They also attain higher grades, but they do not score higher on standardized tests. The long-term effects on educational attainment thus appear to be driven by changes in socio-emotional skills rather than cognitive skills.
1. INTRODUCTION
Socio-emotional skills are predictive of major life outcomes like educational attainment, employment, earnings, health, and participation in crime (Heckman and Rubinstein, 2001; Roberts et al., 2007; Almlund et al., 2011). While the predictive power of socio-emotional skills has been established, there is an ongoing debate about how malleable these skills are. If these skills are indeed malleable, interventions targeting children's socio-emotional skills may change the trajectory of a life and lead to lasting changes in educational attainment and labour market outcomes.
In this paper, we study how a randomized intervention among eight-year-old children in Switzerland affects tracking, high school completion, and university enrolment. The promoting alternative thinking strategies (PATHS) intervention is a classroom-based socio-emotional learning (SEL) programme for elementary school students that aim to reduce behavioural problems (Greenberg et al., 1995). The intervention consists of weekly lessons and homework assignments embedded in the school curriculum. PATHS lasts for up to two years and is designed to foster self-control, patience, social problem-solving skills, self-esteem, emotional intelligence, and academic engagement.
PATHS teaches children to think twice and to look ahead. For example, in one classroom exercise, children learn to make less impulsive choices in difficult situations with the three-part “stoplight approach”. First, on the red light, children slow down, take a few deep breaths, and explain the problem they face. Next, on the yellow light, children think about solution options and the consequences of their actions, and they plan a solution to the problem. Finally, on the green light, children execute their plan and evaluate whether it worked. Teachers support children in applying the stoplight approach in role-play and real-life situations occurring in class such as a conflict with peers. Children also practice this approach in homework assignments: they describe a school-related social or academic problem, explain solution strategies to parents or classmates, and collect feedback on their solution strategies. PATHS includes elements of cognitive behavioural therapy and targets problem-solving and regulatory skills that have been associated with improved externalizing behaviour conducive to learning, achievement, and future school success (Izard et al., 2004; Fantuzzo et al., 2007; Roberts et al., 2007; Raver et al., 2011; Deming, 2017).
The PATHS intervention was implemented in 2005 in Zurich, Switzerland. Its main goal was to reduce disruptive and aggressive behaviour by improving children's socio-emotional skills (Eisner et al., 2012a).1 PATHS was introduced in twenty-eight out of fifty-six randomly selected public primary schools. Randomization took place at the school level and was stratified within-school districts. The intervention was supposed to last for one school year in second grade; however, the programme was so popular that over 70% of schools accepted the offer to continue with the programme for a second year. The experimental design also included the Triple P parenting training programme, which was implemented in half of the schools in the PATHS treatment schools and in half of the control group schools. The Triple P intervention, in contrast to PATHS, was less intensive and parents received less than 2 h of intervention time on average. Triple P did not affect educational outcomes. In this paper, we focus on the PATHS intervention and, for completeness, discuss the additional intervention and evaluation results in Supplementary Appendix D.
To evaluate the long-term effects of the PATHS intervention, we follow the treatment and control groups over seventeen years using the Zurich Project on Social Development from Childhood to Adulthood (z-proso) panel. This panel surveyed children, teachers, and primary caregivers annually or biannually from late 2004 until early 2022, with the last wave interviewing children at age 24. The data include baseline and follow-up measures of children's socio-emotional skills, parenting practices, and family and household characteristics, as well as administrative and self-reported educational outcomes. The combination of multi-respondent survey data matched to administrative education records allows us to provide detailed evidence on how treatment effects evolve over time and what skills the intervention affects.
PATHS has lasting effects on educational careers. At age 13, four years after the intervention, treated children become 4.4 percentage points more likely to get tracked into academic high school (Gymnasium).2 The treatment effect persists, and treated children become 7.1 percentage points more likely to complete academic high school. This effect is economically significant. It represents a 23% increase relative to the mean of the control group. At age 24, fifteen years after the end of the intervention, the treatment group is 6.5 percentage points more likely to attend or have completed university, which is a 26% increase relative to the control group.
How does PATHS's effectiveness compare to other childhood intervention programmes? The size of the PATHS treatment effect is one-sixth of the treatment effect of the Abecedarian programme for college attendance (Campbell et al., 2002) and one-third of the size of the Perry Preschool Program for high school completion (Schweinhart, 1993; Heckman et al., 2010a). Our effect size on academic high school attendance is very similar to the treatment effect of the Baloo and You mentoring programme (Falk et al., 2020).
To investigate how the PATHS intervention affected children's educational attainment, we study four potential mechanisms. We evaluate changes in (1) grades and test scores, (2) socio-emotional skills, (3) children's classroom behaviour, and (4) parenting practices. We find evidence for the first three mechanisms. First, we find suggestive evidence that the intervention increases students’ teacher-assessed grades, but it has no impact on academic high school admission test scores. As grades are more influenced by socio-emotional skills and classroom behaviour than achievement tests (Borghans et al., 2016), our results suggest that the treatment effect is more likely to operate through changes in socio-emotional skills rather than through improved cognitive skills. Second, treated children display less attention deficit/hyperactivity disorder (ADHD) symptoms: they are less impulsive and less disruptive. Treated children also display less opposition, defiance, and non-aggressive conduct disorders (NACD). Children's anxiety, physical aggression, and prosociality are not affected by the intervention. Third, treated children are less likely to disturb lessons and more likely to focus on the teaching content in class. We do not find that treated children become more likely to complete their homework assignments, which suggests that the treatment mostly affects engagement and attention in the classroom. Fourth, we find no treatment effects on parenting practices.
Taken together, our analysis of the underlying mechanisms paints a consistent picture. The PATHS programme reduces children's impulsiveness and fosters their decision-making process. These behavioural changes improve classroom behaviour, which is rewarded by higher grades. In the long run, these improvements in grades lead students to enter the academic high school track and ultimately, university.
Our paper makes a series of novel contributions. Existing work typically studies treatment effects on socio-emotional skills or academic outcomes in isolation. Although a number of existing studies hypothesize that the long-term impact of early childhood interventions is driven by changes in socio-emotional skills, the direct empirical evidence for this link is limited. This paper fills that gap by studying both types of outcomes in a common framework and estimating to which degree changes in academic careers are mediated by changes in socio-emotional skills.
Existing childhood intervention studies either suffer from small sample sizes or are not able to follow individuals over an extended time period.3 Our study addresses both shortcomings. In contrast to some iconic childhood intervention studies, we have a substantially larger sample size and low attrition rates.4 Our ability to document how treatment effects evolve over a seventeen-year period distinguishes our work from the literature.
Our results add to recent evidence that challenge the view that effective interventions need to take place before age 6. We highlight that adding socio-emotional skills training to the primary school curriculum at ages 8–9 has meaningful long-run impacts on educational careers. Our paper thereby relates to a growing literature on other classroom-based primary school interventions targeting socio-emotional development. Alan et al. (2019) show that an intervention targeting grit increases students’ perseverance and math test scores two years after the intervention. Alan and Ertac (2018) show that an intervention targeting patience improves self-control and the ability to imagine future selves. These effects lead students to make more-patient intertemporal choices and persist over a three-year period. Schunk et al. (2022) show that training in self-regulation improves both cognitive and non-cognitive skills and makes students’ more likely to attend the academic high school track three years after the intervention. Berger et al. (2020) show that an intervention targeting students’ working memory improves both cognitive and socio-emotional skills with effects measured up to four years after the intervention. Brown et al. (2022) show that training in cognitive endurance improves student performance by 0.09 standard deviations. Cipriano et al. (2023) conduct a meta-analysis of school-based SEL programmes outside the economics literature and conclude that SEL programmes are generally effective. While Cipriano et al. (2023) find that most interventions lead to improved school climates and student behaviour, evidence on long-run effects remains extremely scarce. Hart et al. (2020) conduct a meta-analysis of education interventions targeting either cognitive or socio-emotional skills and conclude that most intervention effects appear to fade out within a few years. In contrast to existing papers on primary school interventions and the work summarized by these two meta-analyses, we have a much longer follow-up period and are the first to look at university enrolment as an outcome.
Our paper is not the first evaluation of the PATHS programme. Over the past two decades, PATHS has become increasingly popular and has been used in over thirty-six countries. Similar to the broader literature on SEL programmes, existing evaluations of PATHS focus on short- or medium-term behavioural changes in primary school (Malti et al., 2012; Crean and Johnson, 2013; Averdijk et al., 2016; Humphrey et al., 2016).5 Most of these evaluations were not designed to provide evidence of long-run effectiveness. In contrast to these studies, we follow students over a substantially longer time horizon and do not limit the analysis to survey-based behavioural measures. By looking at how the intervention affects university enrolment and graduation, we provide unique evidence on the long-term effectiveness of one increasingly popular SEL programme used in a variety of countries. In contrast to previous evaluations, our study is the first to establish a causal link between the PATHS programme, tracking, and participation in higher education.
2. THE PATHS TRAINING PROGRAMME
PATHS is a teacher-led programme for primary school children that was developed by Mark T. Greenberg and Carol A. Kusché at the University of Washington for the U.S. context (Kusché and Greenberg, 1994). The programme teaches systematic coping and decision-making strategies with the aim of fostering children's self-control, emotional understanding, and social problem-solving skills (Greenberg et al., 1995).
PATHS focuses on regulatory skills; it aims to foster social skills and improve externalizing behaviour (Greenberg et al., 1995, 1998). These behaviour changes should improve educational participation, reduce disruptive and aggressive behaviour in the classroom, and, ultimately, reduce violence, delinquency, and crime. Supplementary Table C1 provides an overview of the PATHS curriculum, which targets the following competencies:6
- (1)
Self-control and patience
- (2)
Decision-making strategies and social problem-solving
- (3)
Self-esteem
- (4)
Emotional intelligence
- (5)
Fairness and rules
(1) Self-control and patience: PATHS targets self-control and patience through several exercises. Children learn to calm down in stressful situations using breathing techniques. They learn that it is their own responsibility to avoid exploding in anger and losing self-control through the analogy of a balloon that can burst. They role-play situations in which they practice ignoring, interpreting, and handling teasing of other children. They listen to a story of a girl who learned how to control herself by calming down and recognizing her emotions. The children complete some of these exercises at home. For example, children interview their parents about situations in which they had to calm down and write a summary of how their parents managed the situation.
(2) Decision-making strategies and social problem-solving: PATHS targets decision-making strategies and social problem-solving based on the stoplight approach described in the introduction. Supplementary Figure C1 shows a poster used to explain the stoplight approach. After introducing the method in class, the teacher discusses concrete situations in which children can use the approach. Children then apply the stoplight approach in repeated role-play exercises that simulate everyday situations. These exercises involve conflict situations with peers, parents, or teachers, or problems with school assignments. In homework assignments, children describe their problem-solving approach to a specific situation. They also practice the approach at home and explain the three steps to their parents, who receive a separate information leaflet about the benefits of the stoplight approach (Supplementary Figure C5).
(3) Self-esteem: PATHS aims to increase children's self-esteem by making them aware of their strengths and skills. In one of the lessons, children learn to give and accept compliments from peers and teachers. The teacher explains the concepts of compliments and respect as well as how to express compliments. Children then practice how to give compliments to each other in the classroom. In one homework assignment, children exchange compliments with parents and other family members at home.
In another exercise, the “child of the week” receives special privileges and duties for one week. As part of this exercise, the child acts as the teacher's assistant. At the end of the week, the teacher and classmates prepare a special child-of-the-week certificate with a picture of the child and a series of compliments and anecdotes describing what attributes classmates value in the child. While this activity is supposed to foster self-esteem, it also teaches children that privilege comes with responsibilities. They are supposed to learn that being valued by others also requires contributing to the common good.
(4) Emotional intelligence: PATHS targets emotional intelligence by fostering the understanding and expression of feelings. In one lesson, the teacher reads stories and children guess what feelings the protagonist felt. In one homework assignment, children describe their feelings during a recent emotional situation and discuss with their parents how they dealt with their emotions. With this exercise, children learn about themselves and become more aware of how their behaviour affects the feelings and perceptions of peers, parents, and teachers. To facilitate the recognition and expression of feelings, children receive “feelings cards”. These cards show children expressing different emotions such as happiness, excitement, anger, surprise, sadness, and worry (see Supplementary Figure C2). Children first colour these cards and then use them to express their current emotional state by placing the corresponding card on their table. In a final step, children reflect on how to demonstrate an emotion. For example, they have to find appropriate verbal responses to feelings like anger or sadness.
(5) Fairness and rules: Starting with the first PATHS lesson, children discuss the importance of having rules and manners. They discuss with their teachers in class and parents at home which rules should be established in the classroom, at home, and in everyday life. PATHS also tries to foster children's understanding of fairness by introducing children to principles of fair behaviour. In one lesson, children have to identify fair and unfair behaviour in different situations. In another lesson, the teacher reads a story and the children discuss whether the protagonists’ behaviour is fair or unfair.
3. DATA AND INSTITUTIONAL BACKGROUND
This section provides the institutional background of this study. First, we introduce the Zurich Project on Social Development from Childhood to Adulthood (z-proso data collection). Second, we illustrate the main characteristics of the education system in the Canton of Zurich.
3.1 The z-proso study
The data we analyse in the paper come from the z-proso panel study (Malti et al., 2011; Eisner et al., 2012b; Averdijk et al., 2016). Ribeaud et al. (2022) provide a detailed description of the Zurich Project on the Social Development from Childhood to Adulthood (z-proso). The study surveys students, teachers, and primary caregivers7 to investigate the life course of 1,675 children starting primary school in 2004 in Zurich, which is the largest city in Switzerland. Supplementary Table B1 provides an overview of the timing of the surveys, the respondents, and the response rate in nine different waves that took place between 2004 and 2022. By 2022, the study had followed children over a seventeen-year period until they were twenty-four-years old. Throughout the nine interview waves, response rates remained high. At age 24, for example, about 70% of the original sample responded to the survey.
The z-proso data include pre-intervention (baseline) and follow-up measures of children's socio-emotional skills, parenting practices, family and household characteristics, and administrative and self-reported educational outcomes. Supplementary Appendix B describes the data collection, informed consent, and ethics approval in greater detail.
Two early prevention programmes were implemented as part of the z-proso study. The first intervention was PATHS—the school-based social and emotional learning-based programme we focus on in this paper (see Section 2). The second intervention was the “Positive Parenting Program” (Triple P). Triple P encourages “positive parenting” by teaching techniques that support desired child behaviour, routines that avoid parent–child conflicts, and techniques that help the child plan (Sanders, 1999). In this paper, we focus on the PATHS intervention. For completeness, we provide more details on the Triple P intervention in Section 4 and show its treatment effects in Sections 6 and Supplementary Appendix D.
3.2 Education and tracking system
Figure 1 illustrates the school system and educational transitions in the canton of Zurich. Children start primary school at age 7. At age 12, after six years of primary school, children are tracked into different secondary schools.
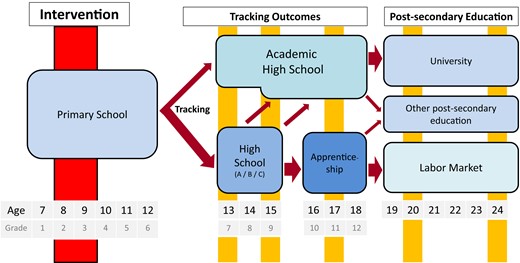
School tracking and measurement of educational outcomes Notes: This figure illustrates the structure of the school system in the canton of Zurich. Children attend primary school for six years from ages 7 to 12 (Grade 1 to Grade 6). At the end of primary school, at age 12, children are tracked either into academic high school (Gymnasium) or into regular high school (Sekundarschule). The tracking outcome is determined exclusively by children's grades in the final year of primary school and academic high school admission test scores. Children can either attend an academic high school directly starting from Grade 7 (long-term Gymnasium) or from Grade 9 onward (short-term Gymnasium). The non-academic high school track comprises three lower tracks called Sek A, Sek B, and Sek C. Children attending regular high school can also transfer to academic high school after two or three years. The Matura degree, obtained upon completion of academic high school, is required to enrol in university. Students graduating from regular high school typically start an apprenticeship at age 16. Apprenticeships last two to four years. The red vertical bar indicates the intervention period. The yellow bars indicate the points in time when we observe educational outcomes.
The highest school track is academic high school (Gymnasium). Students attend this school for six years and typically graduate when they are eighteen-years old. It prepares students for university education and allows them to obtain the Matura degree required to enrol in university.8 Tracking is determined by grades and an admission test. Parents cannot choose the secondary school track and have no direct influence on the tracking outcome.
Students can obtain the Matura degree from an academic high school either through attending long-term academic high school or short-term academic high school. Tracking into long-term academic high school takes place after Grade 6. Tracking into short-term academic high school takes place after Grade 8 or 9. Later transitions are possible if a student has sufficiently high grades and passes the standardized admission test. During the first two probation years, some students initially tracked into academic high school fail to meet performance standards and move to a lower track. Additionally, a substantial number of students from the lower track move into the academic high school at different points in time. As a result, the share of students in the highest track increases by 25% during the first three years of secondary school.
4. EXPERIMENTAL DESIGN
4.1 Selection of schools, randomization, and definition of treatment group
Selection of participating schools: Zurich has seven school districts and a total of ninety primary schools. In each school district, eight schools were randomly selected to participate in the experiment. All fifty-six selected schools complied with the request of the City of Zurich's School and Sports Department to participate in the study.
Stratification and randomization: The fifty-six participating schools were assigned to fourteen strata cells. These cells were constructed by dividing each of the seven school districts into two groups consisting of four similar-sized schools. Within each strata, each school was randomly assigned to one of four treatment groups using a random number generated in Microsoft Excel. Schools with the largest random number in each strata were assigned to the PATHS programme (PATHS only). Schools with the second-largest number were assigned to the Triple P programme (Triple P only). Schools with the third-largest number were assigned both to the PATHS and Triple P programmes (PATHS and Triple P). Finally, schools with the lowest number received neither the PATHS nor the Triple P intervention. These schools are the pure control group.
Definition of treatment and control groups: In this paper, we focus on the PATHS intervention and define the treatment group as the group of schools assigned to one of the two PATHS treatment arms—either PATHS only or PATHS and Triple P combined. The control group consists of the pure control group and the Triple P-only group. Based on this definition, we have twenty-eight treated and twenty-eight control schools.
We include Triple P schools in the control group because this programme had no impact on children's educational careers (Supplementary Table D1). Triple P also had no impact on children's problematic behaviour or educational outcomes (Malti et al., 2011; Eisner et al., 2012b). Triple P has been shown to be effective for younger children (Doyle, 2020). In our setting, however, participation rates were low: only 27% of parents assigned to Triple P enroled in the programme and attended at least one session. Less than 19% of parents assigned to Triple P completed all four course units. Triple P parents received, on average, less than 2 h of intervention time. Eisner et al. (2011) show that parents who decided to attend courses were more likely to come from families with a high socio-economic background and be of Swiss origin.
Given that there are four treatment arms of the original experimental design, we could also estimate effects for each of the three treatment groups separately. In Section 6.3, we show that this approach leads to similar results. Alternatively, we could drop all students that received the Triple P treatment and compare only the pure PATHS with the pure control group. We provide results based on this alternative sample definition in Section 6.3. Although we lose about half of our observations with this definition, results remain very similar.
4.2 Implementation of the intervention
In the 2005/2006 school year, PATHS was implemented in twenty-eight primary schools in cooperation with the Department of School and Sports of the City of Zurich. Prior to the implementation, the original PATHS material was translated and adjusted to the Swiss context by Rahel Jünger in collaboration with the U.S. developers (Eisner et al., 2007). Rahel Jünger also implemented the programme and conducted the teacher training and supervision. This implementation was done independently from the evaluation.
In the selected schools, all Grade 2 classes were treated. Parents were not aware of the school's treatment status or the implementation of the programme in Grade 2 when enroling their children in primary schools. The level of compliance was remarkably high, with less than 6% of children changing schools between Grade 1, when baseline characteristics were collected, and Grade 2, when the PATHS programme was implemented in the treated schools. We do not find that school changes were related to the treatment status.9
To prepare schools for delivering the PATHS intervention, all teachers in charge of running PATHS lessons participated in a three-day workshop with a PATHS coach. There was usually one teacher per treated class that received the PATHS training. Teachers not delivering PATHS were not trained. During this workshop, the PATHS coach gave teachers an overview of the key concepts, classroom activities, posters, toys, and over 400 pages of materials. During the first year of the programme, teachers regularly met their PATHS coach, who gave them feedback and support. PATHS coaches also monitored the implementation and observed six PATHS lessons for each participating class. After each of these observations, the coach provided suggestions for improvements and graded the quality of the implementation.
The 45-min PATHS lessons typically took place twice per week. Treated children received PATHS lessons throughout the entire year of Grade 2. PATHS lessons replaced the class “Humans and Environment” (Mensch und Umwelt), which teaches children about the environment and organization of Swiss society. To reinforce the practice of PATHS methods, teachers also applied PATHS strategies in lessons not explicitly dedicated to the PATHS curriculum itself. Over the course of Grade 2, children received about 45 h of PATHS lessons and about 20 h of PATHS homework assignments (Eisner et al., 2007). Because the majority of teachers, parents, and children highly appreciated PATHS, over 70% of schools continued using the programme for a second year in Grade 3. The programme ended for all children at the end of Grade 3 when classes were reshuffled, and students received a new teacher.
4.3 Outcome variables and descriptive statistics
Outcome variables: We evaluate the long-term effects of the PATHS intervention on educational outcomes. The key outcomes of interest are whether individuals attend and complete the academic high school track (Gymnasium), whether they obtain the Matura degree, which allows them to enrol in any university, and whether they are enroled in or graduated from university at age 24.
We observe students’ secondary school tracks at ages 13, 15, and 17 from administrative school data provided by the Department of Education of the Canton of Zurich. Some children leave the canton of Zurich and therefore disappear from the administrative data. We therefore complement the administrative records with self-reported tracking outcomes based on the z-proso survey.10 We observe whether students complete academic high school and enrol in university or graduate from university in the wave 9 z-proso survey administered at age 24.
Descriptive statistics
| (1) | (2) | (3) | (4) | (5) | |
|---|---|---|---|---|---|
| N | Mean | SD | Min | Max | |
| Educational outcomes | |||||
| Attending academic high school, age 13 | 1,589 | 0.157 | 0.364 | 0 | 1 |
| Attending academic high school, age 15 | 1,535 | 0.202 | 0.402 | 0 | 1 |
| Attending academic high school, age 17 | 1,305 | 0.261 | 0.439 | 0 | 1 |
| Completed academic high school, age 20 | 1,185 | 0.270 | 0.444 | 0 | 1 |
| Enrolled in university, age 20 | 1,178 | 0.167 | 0.373 | 0 | 1 |
| Enroled in university, age 24 | 1,158 | 0.194 | 0.396 | 0 | 1 |
| Enroled or graduated university, age 24 | 1,158 | 0.223 | 0.416 | 0 | 1 |
| Baseline child characteristics | |||||
| Age in 2005 | 1,238 | 7.033 | 0.396 | 5.699 | 8.494 |
| Swiss Citizenship | 1,238 | 0.599 | 0.490 | 0 | 1 |
| Female | 1,675 | 0.481 | 0.500 | 0 | 1 |
| Baseline child socio-emotional skills (teacher report) | |||||
| ADHD symptoms (disruptiveness and impulsiveness) | 1,348 | 1.246 | 0.989 | 0 | 4 |
| Opposition and defiance | 1,348 | 0.541 | 0.815 | 0 | 4 |
| Non-aggressive conduct disorder | 1,348 | 0.217 | 0.405 | 0 | 2.500 |
| Anxiety and depressivity | 1,348 | 0.871 | 0.762 | 0 | 4 |
| Overall aggression | 1,348 | 0.588 | 0.684 | 0 | 4 |
| Prosociality | 1,348 | 2.171 | 0.824 | 0 | 4 |
| Baseline child socio-emotional skills (parent report) | |||||
| ADHD symptoms (disruptiveness and impulsiveness) | 1,229 | 1.212 | 0.646 | 0 | 3.778 |
| Opposition and defiance | 1,229 | 0.966 | 0.621 | 0 | 2.750 |
| Non-aggressive conduct disorder | 1,229 | 0.296 | 0.326 | 0 | 2.800 |
| Anxiety and depressivity | 1,229 | 0.704 | 0.464 | 0 | 2.556 |
| Overall aggression | 1,229 | 0.601 | 0.423 | 0 | 2.750 |
| Prosociality | 1,229 | 2.577 | 0.528 | 0.600 | 4 |
| Baseline parenting practices (parent report) | |||||
| Corporal punishment | 1,229 | 0.454 | 0.489 | 0 | 2.667 |
| Inconsistent discipline | 1,229 | 1.188 | 0.598 | 0 | 3.200 |
| Parental control and supervision | 1,229 | 3.686 | 0.328 | 2 | 4 |
| Parental involvement | 1,229 | 3.189 | 0.422 | 1.500 | 4 |
| Positive parenting | 1,229 | 3.215 | 0.514 | 1.200 | 4 |
| Baseline household characteristics | |||||
| Mother completed at least Gymnasium degree | 1,215 | 0.393 | 0.489 | 0 | 1 |
| Father completed at least Gymnasium degree | 1,015 | 0.518 | 0.500 | 0 | 1 |
| Mother holds university degree | 1,215 | 0.160 | 0.367 | 0 | 1 |
| Father holds university degree | 1,015 | 0.249 | 0.433 | 0 | 1 |
| Single-parent household | 1,230 | 0.172 | 0.378 | 0 | 1 |
| Age mother in 2005 | 1,218 | 37.02 | 5.375 | 23 | 53 |
| Mother Swiss Citizenship | 1,663 | 0.486 | 0.500 | 0 | 1 |
| Mother born in Switzerland | 1,219 | 0.423 | 0.494 | 0 | 1 |
| Family receives financial aid | 1,213 | 0.380 | 0.486 | 0 | 1 |
| Family reports financial problems | 1,216 | 0.178 | 0.382 | 0 | 1 |
| Household income (in 1000 USDs) | 1,132 | 86.31 | 48.71 | 12 | 270 |
Notes: This table shows descriptive statistics for the variables used in our analysis. SD stands for standard deviation.
Table 1 shows that 16% of the participants attend academic high school at age 13, right after tracking has taken place. This number increases to 20% at age 15 and 26% at age 17.11 Twenty-seven percent of children complete academic high school, and 17% are enroled in university at age 20. At age 24, 22% have graduated from university or are still enroled in university.
Baseline measures: Table 1 shows characteristics of children and parents measured at the baseline, that is, in the year before the start of the intervention. At this time, children are, on average, seven-years old. Forty-eight percent are girls. Our sample comes from a diverse population: only 60% are Swiss, 90% were born in Switzerland, and only 49% of mothers are Swiss. Seventeen percent of households are single-parent households. About 39% of mothers have completed at least academic high school (Gymnasium), and 16% hold a university degree. Fathers are slightly more educated than mothers, with 52% having completed Gymnasium or other types of higher education and 25% holding a university degree. The average family household income is USD 86,000 per year; 38% of families are entitled to state funded financial aid, and 18% report financial problems at the baseline. Our data also contain detailed baseline measures of child behaviour assessed through the Social Behavior Questionnaire (SBQ; Tremblay et al., 1991; Murray et al., 2019) and the Alabama Parenting Questionnaire (APQ; Shelton et al., 1996).
5. EMPIRICAL STRATEGY
5.1 Empirical model
We aim to estimate the treatment effect of the PATHS intervention on educational outcomes. Equation (1) shows our main empirical model:
where
Vector
We estimate equation (1) using linear probability models and cluster standard errors at the school level. We additionally provide p-values based on randomization inference with 10,000 repetitions following Young (2019).
5.2 Balancing tests
The identifying assumption of our empirical strategy relies on the random assignment of children to the treatment status. To verify this assumption, we test whether baseline characteristics predict treatment status. In particular, we regress treatment status on each of the pre-treatment characteristics separately. We use all available characteristics on child and family demographics and measures for socio-emotional skills, and we estimate a total of fifty-six regressions.
Table 2 summarizes the balancing tests. Column (1) shows the number of statistically significant coefficients we obtain when regressing the indicator for treatment status (
Summary table for balancing of baseline characteristics
| (1) | (2) | |
|---|---|---|
| Number of | Expectation under random | |
| balancing tests | assignment | |
| Total number of balancing tests | 56 | |
| Number of tests significant with p < 0.01 | 1 | 0.560 |
| Number of tests significant with p < 0.05 | 2 | 2.800 |
| Number of tests significant with p < 0.1 | 5 | 5.600 |
Notes: This table summarizes the results of our balancing tests. To test random assignment, we regress treatment status on baseline characteristics. We run a separate linear probability model for each baseline characteristic. Table 3 shows a detailed list of all baseline characteristics and individual point estimates. All regressions include strata fixed effects for the level of randomization. Standard errors are clustered at the school level. Column (1) reports the total number of balancing tests and the number of statistically significant tests for different levels of significance. Column (2) reports the number of coefficients we would expect to be statistically significant due to chance under random assignment.
Table 3 provides a closer look at unbalanced variables by reporting point estimates from all fifty-six balancing regressions. The analysis reveals a substantial and significant imbalance (p < 0.01) in fathers’ education levels between the treatment and the control group. Given that parental education is a key determinant of children's educational outcomes, this imbalance deserves careful consideration. Children receiving the PATHS intervention come from families with, on average, less-educated parents. Treated children are about 10 percentage points less likely to have a father that holds at least an academic high school degree. This imbalance in fathers’ education levels will make it harder for us to identify effects of the intervention if the treatment affects children's educational outcomes positively. Without accounting for this imbalance, we would underestimate treatment effects of the PATHS programme.
Balancing tests of baseline characteristics
| (1) | (2) | (3) | (4) | ||||
|---|---|---|---|---|---|---|---|
| Child and household characteristics | PATHS | SBQ (parent report) | PATHS | SBQ (teacher report) | PATHS | SBQ (child report) | PATHS |
| Age in 2005 | −0.013 | Prosociality | 0.004 | Prosociality | 0.056** | Prosociality | −0.004 |
| (0.042) | (0.013) | (0.027) | (0.016) | ||||
| Female | 0.036* | Anxiety and depressivity | 0.009 | Anxiety and depressivity | 0.035 | Anxiety and depressivity | 0.009 |
| (0.020) | (0.014) | (0.021) | (0.013) | ||||
| Swiss Citizenship | 0.036 | ADHD symptoms (disruptiveness and impulsiveness) | −0.004 | ADHD symptoms (disruptiveness and impulsiveness) | 0.035 | ADHD symptoms (disruptiveness and impulsiveness) | 0.014 |
| (0.045) | (0.012) | (0.021) | (0.014) | ||||
| Mother holds university degree | −0.049 | Opposition and defiance | −0.022* | Opposition and defiance | 0.029 | Opposition and defiance | 0.013 |
| (0.045) | (0.013) | (0.024) | (0.013) | ||||
| Father holds university degree | −0.073 | Non-aggressive conduct disorder | 0.000 | Non-aggressive conduct disorder | 0.008 | Non-aggressive conduct disorder | −0.009 |
| (0.044) | (0.012) | (0.019) | (0.011) | ||||
| Mother completed at least Gymnasium degree | −0.049 | Non-aggressive externalizing problem behaviour | −0.016 | Non-aggressive externalizing problem behaviour | 0.020 | Non-aggressive externalizing problem behaviour | 0.005 |
| (0.035) | (0.013) | (0.022) | (0.012) | ||||
| Father completed at least Gymnasium degree | −0.099*** | Indirect aggression | 0.016 | Indirect aggression | 0.029 | Indirect aggression | 0.022 |
| (0.032) | (0.013) | (0.020) | (0.014) | ||||
| Single-parent household | 0.004 | Reactive aggression | 0.000 | Reactive aggression | 0.018 | Reactive aggression | 0.002 |
| (0.029) | (0.012) | (0.026) | (0.013) | ||||
| Age mother in 2005 | 0.003 | Physical aggression | −0.005 | Physical aggression | 0.001 | Physical aggression | 0.009 |
| (0.003) | (0.015) | (0.021) | (0.014) | ||||
| Mother Swiss Citizenship | 0.029 | Proactive aggression and dominance | −0.008 | Proactive aggression and dominance | 0.029 | Proactive aggression and dominance | 0.023* |
| (0.039) | (0.013) | (0.021) | (0.012) | ||||
| Mother born in Switzerland | 0.017 | Overall aggression | −0.005 | Overall aggression | 0.017 | Overall aggression | 0.013 |
| (0.036) | (0.014) | (0.023) | (0.014) | ||||
| Family receives financial aid | −0.031 | Overall externalizing behaviour | −0.009 | Overall externalizing behaviour | 0.029 | Overall externalizing behaviour | 0.013 |
| (0.028) | (0.013) | (0.024) | (0.014) | ||||
| Family reports financial problems | −0.009 | Overall behaviour score 1 | −0.002 | Overall behaviour score 1 | 0.017 | Overall behaviour score 1 | 0.016 |
| (0.043) | (0.014) | (0.025) | (0.015) | ||||
| Household income (in 1000 USDs) | 0.000 | Overall behaviour score 2 | −0.010 | Overall behaviour score 2 | −0.011 | Overall behaviour score 2 | 0.011 |
| (0.000) | (0.014) | (0.024) | (0.015) |
Notes: This table shows the coefficients from fifty-six separate ordinary least squares (OLS) regressions testing whether a characteristic predicts treatment status. The treatment indicator PATHS is regressed on one baseline variable. Baseline variables include all available child, parental, and household characteristics and baseline child SBQ measures. All models include strata fixed effects for the level of randomization. Robust standard errors clustered at the school level are in parentheses. ***p < 0.01, **p < 0.05, *p < 0.1.
To provide a better understanding of the initial imbalance and its consequences for our results, we conduct a series of exercises. In Section 6.2, we show how different sets of control variables affect our results. We highlight that we need to control for unbalanced parental education to obtain unbiased treatment effects. In Section 6.2, we further conduct a permutation exercise that highlights that creating a balanced estimation sample is an alternative way to obtain unbiased estimates that does not require the inclusion of control variables. Overall, our analyses highlight that it is essential to account for the initial imbalance in the sample to obtain unbiased results.
6. RESULTS
In this section, we provide the main results of our analysis on the impact of the PATHS curriculum on educational careers. We also provide a series of sensitivity analyses and test whether results are driven by selective attrition and estimate treatment effects for different subgroups.
6.1 Main results
Table 4 shows estimates of the PATHS treatment effect on education trajectories from equation (1). The dependent variable in column (1) is an indicator for academic high school attendance at age 13, immediately after tracking has occurred. The dependent variable in column (2) is an indicator for academic high school completion at age 20. In column (3), the dependent variable is an indicator for university enrolment or graduation at age 24.
Treatment effects on educational outcomes
| (1) | (2) | (3) | |
|---|---|---|---|
| Initial tracking | Academic | University | |
| into academic | high school | enrolment or | |
| high school | completion | graduation | |
| PATHS treatment | 0.044** | 0.071*** | 0.065*** |
| (0.020) | (0.021) | (0.022) | |
| Randomization inference p-value | 0.054 | 0.016 | 0.027 |
| Observations | 1,011 | 837 | 815 |
| R2 | 0.303 | 0.364 | 0.249 |
| Control group mean dependent variable | 0.199 | 0.308 | 0.252 |
| Child age | 13 | 20 | 24 |
| Panel wave | 5 | 8 | 9 |
Notes: This table shows the treatment effect of the PATHS intervention on initial tracking into academic high school at age 13, academic high school completion at age 20, and university enrolment or graduation at age 24. All outcomes are indicator variables and the specifications are estimated using linear probability models using controls for baseline child and household characteristics. Child controls include the age and gender of the child, having Swiss citizenship, measures for anxiety and depressivity, ADHD, non-aggressive externalizing problem behaviour, non-aggressive conduct disorder, opposition and defiance, prosociality, four measures of aggressive behaviour, and four measures of overall behaviour. Household controls include household income, mother's and father's education level (including an indicator for missing information), age of the mother, indicator variables for the mother's having Swiss citizenship and being born in Switzerland, and indicator variables for a single-parent household, a household that received financial aid, and a household that experienced financial problems. The outcome initial tracking into academic high school is based on administrative data. The outcomes academic high school completion and university enrolment or graduation are self-reported. All models include strata fixed effects for the level of randomization. The table also shows p-values based on randomization inference with 10,000 replications. Robust standard errors clustered at the school level are in parentheses. ***p < 0.01, **p < 0.05, *p < 0.1.
Table 4 shows positive and statistically significant treatment effects across all educational outcomes. The PATHS programme leads to a 4.4 percentage point increase in the likelihood of children attending an academic high school at age 13, immediately after tracking. This effect is economically significant, as it corresponds to a 22% increase compared to the control group mean. The positive impact persists over time. By age 20, attending PATHS increases the likelihood of completing academic high school by 7.1 percentage points, representing a 23% increase over the completion rate of the control group. Furthermore, the treatment effect of PATHS remains visible for higher education. At age 24, PATHS increases the likelihood of attending university or having already graduated from university by 6.5 percentage points (26%).12
The results presented in Table 4 suggest that the PATHS treatment effect is fairly persistent over time. Many students, however, move between tracks during their career. Supplementary Figure A1 shows a flowchart that illustrates how students switch between school tracks over time, which highlights substantial mobility. About 35% of students who graduate from academic high school were initially not admitted to this track at age 13. Similarly, 38% of students that are enroled in or have graduated from university at age 24 did not attend the academic high school track at age 13. This evidence calls for a closer examination of how treatment effects evolve over time.
Figure 2 shows how the PATHS treatment effect evolves over time using data from all available waves. The figure displays the treatment effects on academic high school enrolment at ages 13, 15, and 17, as well as high school completion and university enrolment at age 20, and university enrolment or graduation at age 24. All the point estimates in Figure 2 are positive and statistically significant. The PATHS treatment effect slightly increases over time. Notably, the mean of the dependent variables also increases over time with the relative treatment effect being fairly constant over time.13,14
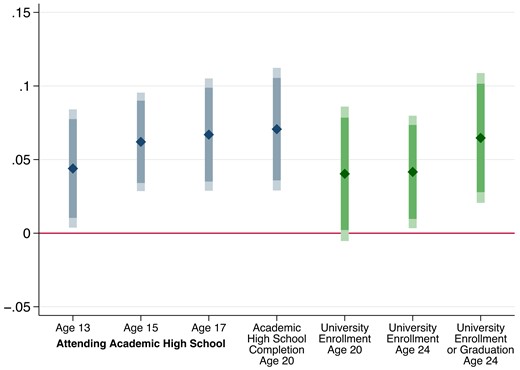
Main results—treatment effects on educational outcomes Notes: This figure shows the treatment effect of the PATHS intervention on attending academic high school at ages 13, 15, and 17 as well as academic high school completion at age 20, university enrolment at ages 20 and 24, and university enrolment or graduation at age 24. All outcomes are indicator variables and the specifications are estimated using linear probability models using controls for baseline child and household characteristics. Child controls include the age and gender of the child, having Swiss citizenship, measures for anxiety and depressivity, ADHD, non-aggressive externalizing problem behaviour, non-aggressive conduct disorder, opposition and defiance, prosociality, four measures of aggressive behaviour, and four measures of overall behaviour. Household controls include household income, mother's and father's education level, age of the mother, indicator variables for the mother's having a Swiss citizenship and being born in Switzerland, and indicator variables for a single-parent household, a household that received financial aid, and a household that experienced financial problems. The outcomes attending academic high school at ages 13, 15, and 17 are based on administrative data. The outcomes of academic high school completion and university enrolment at age 20, university enrolment at age 24, and university enrolment or graduation are self-reported. All models include strata fixed effects for the level of randomization. Each point estimate is shown with the respective 90% and 95% confidence intervals calculated based on standard errors clustered at the school level.
Overall, we observe large and economically significant effects. In the average class in our sample, five out of twenty-eight children attend university at age 20. The size of the treatment effect implies that one additional child—six instead of five—will attend university due to the intervention. We discuss our effect sizes and how they compare to other childhood interventions in Section 9.
6.2 Sensitivity analysis—imbalanced treatment and control groups
One potentially important concern for the interpretation of our results comes from the imbalance in fathers’ education between the treatment and control groups. To assess how much this initial imbalance affects our estimates, we estimate treatment effects with and without controls for the initial imbalance in Table 5. Panel A reports results without any control variables except the randomization strata. Panel B reports results with controls for parental education to account for the imbalance between the treatment and control groups at the baseline. Panel C reports results from the model that additionally include the full set of baseline control variables.
Treatment effects of PATHS on educational outcomes in different specifications
| (1) | (2) | (3) | |
|---|---|---|---|
| Initial tracking into | Academic high | University enrolment | |
| academic high school | school completion | or graduation | |
| Panel A: no controls | |||
| PATHS treatment | 0.006 | 0.023 | 0.023 |
| (0.018) | (0.030) | (0.025) | |
| Observations | 1,589 | 1,185 | 1,158 |
| R2 | 0.072 | 0.107 | 0.075 |
| Control group mean dependent variable | 0.163 | 0.269 | 0.222 |
| Child age | 13 | 20 | 24 |
| Panel wave | 5 | 8 | 9 |
| Panel B: parental education controls | |||
| PATHS treatment | 0.023* | 0.051** | 0.039** |
| (0.013) | (0.021) | (0.020) | |
| Observations | 1,589 | 1,185 | 1,158 |
| R2 | 0.224 | 0.265 | 0.188 |
| Control group mean dependent variable | 0.163 | 0.269 | 0.222 |
| Child age | 13 | 20 | 24 |
| Panel wave | 5 | 8 | 9 |
| Panel C: full controls | |||
| PATHS treatment | 0.044** | 0.071*** | 0.065*** |
| (0.020) | (0.021) | (0.022) | |
| Observations | 1,011 | 837 | 815 |
| R2 | 0.303 | 0.364 | 0.249 |
| Control group mean dependent variable | 0.199 | 0.308 | 0.252 |
| Child age | 13 | 20 | 24 |
| Panel wave | 5 | 8 | 9 |
Notes: This table shows the treatment effect of the PATHS intervention on initial tracking into academic high school at age 13, academic high school completion at age 20, and university enrolment or graduation at age 24. All outcomes are indicator variables and the specifications are estimated using linear probability models. In Panel A, we do not include any controls for baseline characteristics. In Panel B, we include controls for mother's and father's education level. In Panel C, we include controls for baseline child and household characteristics. Child controls include the age and gender of the child, having Swiss citizenship, measures for anxiety and depressivity, ADHD, non-aggressive externalizing problem behaviour, non-aggressive conduct disorder, opposition and defiance, prosociality, four measures of aggressive behaviour, and four measures of overall behaviour. Household controls include household income, mother's and father's education level, age of the mother, indicator variables for the mother's having a Swiss citizenship and being born in Switzerland, and indicator variables for a single-parent household, a household that received financial aid, and a household that experienced financial problems. The outcome initial tracking into academic high school is based on administrative data. The outcomes academic high school completion and university enrolment or graduation are self-reported. All models include strata fixed effects for the level of randomization. Robust standard errors clustered at the school level are in parentheses. ***p < 0.01, **p < 0.05, *p < 0.1.
Panel A of Table 5 shows that, despite having less-educated parents, children who attend the PATHS programme seem to do slightly better than children in the control group. For example, treated children are 2.3 percentage points more likely to have completed academic high school at age 20. While the point estimates are positive for all outcomes, none of the estimates in Panel A are statistically significant at conventional levels. Panel B accounts for the imbalance in parental education at the baseline by including control variables for parental education. By only adding controls for parental education, we find positive and statistically significant treatment effects for all educational outcomes. Panel C of Table 5 replicates the analysis in Table 4 and confirms that the results are robust to including this large set of additional control variables. Despite the lower number of observations due to missing values in our control variables, point estimates in the model with controls for parental education (Panel B) and the full set of controls (Panel C) are not statistically different from each other.15
Taken together, Table 5 highlights that our results depend on whether we control for parental education. In a randomized control trial (RCT) with perfect randomization, we would not expect estimates to change when including controls. However, in our case, it is essential to account for the initial imbalance to obtain unbiased estimates. This imbalance—having fathers with less education in the treatment group—leads to downward bias and makes it harder for us to identify positive treatment effects.16 We conduct a series of sensitivity analyses to support this intuition.
To understand the consequences of the imbalance, we conduct a permutation exercise that first creates a balanced estimation sample from the full sample and then estimates treatment effects using the model without controls (Table 5, Panel A). To obtain a balanced estimation sample, we exclude classes with highly imbalanced shares of fathers who completed academic high school. Because the treatment group has a lower share of fathers who completed academic high school, we sequentially drop classes from the treatment (control) group with the lowest (highest) share of parents who completed academic high school. We start with the full sample and then symmetrically trim the sample by gradually dropping the same number of classes from both the treatment and control groups. We start by eliminating the class in the treatment group with the lowest share of parents who completed academic high school and the class in the control group with the highest share. By dropping imbalanced classes with unusually high or low levels of fathers’ education, we can investigate how treatment effects evolve in an increasingly balanced sample.
Figure 3 shows the impact of the sample restriction procedure on the imbalance in fathers’ education. The x-axis shows the number of classes we drop. The y-axis shows the “balancing coefficient”—the correlation between treatment status and having a father who completed academic high school. We begin with the entire sample and then gradually exclude classes. Figure 3 shows that the gradual exclusion of classes restores balance between the treatment and the control groups. The exclusion of fourteen out of 129 classes results in an imbalance that is no longer statistically significant at conventional levels, although the point estimates remain sizeable (−4.14 percentage points). When excluding twenty-four classes, the difference between the treatment and the control groups is closest to zero. We will use the subsample that minimizes the imbalance as our benchmark model and mark corresponding estimates with a blue diamond. This subsample consists of 1,329 observations corresponding to 80% of the sample.
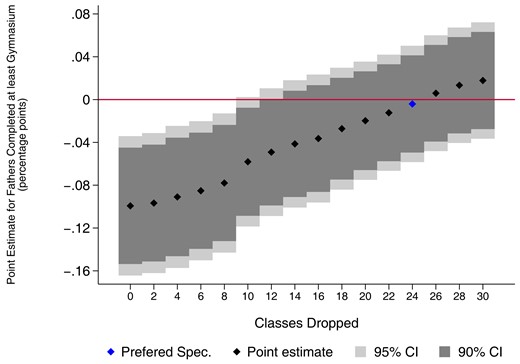
Balance between control and treatment groups after dropping imbalanced classes Notes: This figure shows the relation of shrinking the estimation sample by excluding classes with highly imbalanced shares of fathers with completed academic high school and the imbalance in fathers’ education between the treatment and control groups. The x-axis shows the number of classes that are dropped. Because of the trimming mechanism, we always drop two classes simultaneously. These are the current classes with the lowest share of fathers who completed academic high school in the treatment group and the current class with the highest share of fathers who completed academic high school in the control group. We consider classes with at least six students. The y-axis shows the point estimate when regressing the treatment indicator PATHS on the baseline characteristic father completed at least a Gymnasium degree. The blue diamond shows the specification in which the imbalance is closest to zero. All models include strata fixed effects for the level of randomization. Robust standard errors are clustered at the school level.
Figure 4 shows how treatment effects evolve depending on the number of classes dropped. Panel (a) shows treatment effects on academic high school completion, and Panel (b) shows treatment effects on university enrolment or graduation at age 24. Treatment effects are estimated using the model without controls (Table 5, Panel A). The figure highlights that removing imbalanced classes increases the treatment effects. Once the sample is sufficiently balanced, the effect becomes statistically significant. In our benchmark model that minimizes the imbalance, we observe a highly significant treatment effect of 7.8 percentage points (p-value = 0.012). This treatment effect is not distinguishable from the treatment effect we observe in the full sample model that includes controls (Table 5, Panel C). Results in Panel (b) show that treatment effects evolve very similarly when we examine university enrolment or graduation at age 24 as an outcome.17
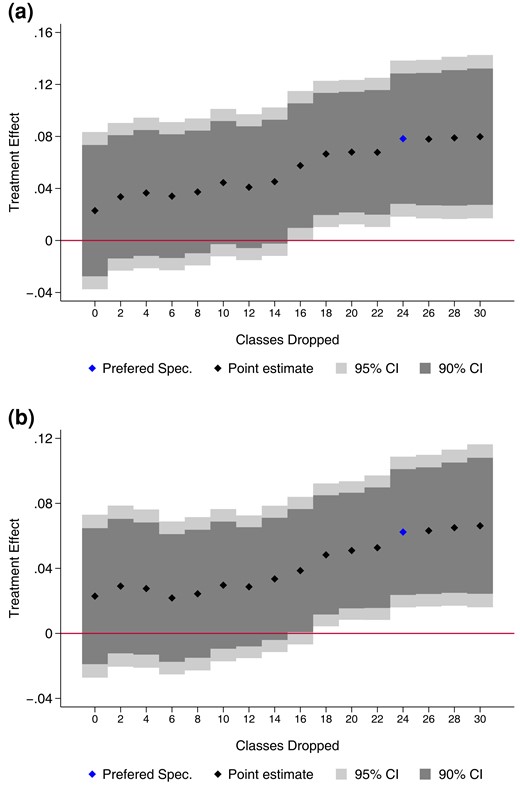
Treatment effect without controls—different sample restrictions. Panel (a): academic high school completion. Panel (b): university enrolment or graduation Notes: This figure shows a sensitivity analysis where we sequentially drop imbalanced classes and then estimate treatment effects. This figure shows the relation of shrinking the estimation sample by excluding classes with highly imbalanced shares of fathers who completed academic high school and estimated treatment effects on the outcomes academic high school completion at age 20 in Panel (a) and university enrolment or graduation at age 24 in Panel (b). The x-axis shows the number of classes that are dropped. Because of the trimming mechanism, we always drop two classes simultaneously. These are the current classes with the lowest share of fathers who completed academic high school in the treatment group and the current class with the highest share of fathers who completed academic high school in the control group. We only consider classes with at least six students. The y-axis shows the point estimate when regressing the treatment indicator PATHS on the outcomes academic high school completion and university enrolment or graduation. The blue diamond shows the specification in which the imbalance of fathers with at least a Gymnasium degree between the treatment and control groups is closest to zero. All models include strata fixed effects for the level of randomization. Robust standard errors are clustered at the school level.
Table 6 shows treatment effects on education outcomes for the restricted sample (twenty-four classes excluded) using the specification without controls (Panel A) and the specification with controls for parental education (Panel B). Table 6 provides the same conclusion as Figure 4 and highlights two important findings. First, the treatment effect of PATHS in the model without control variables is consistently positive and significant for all education outcomes. Second, the results in the restricted sample without controls are remarkably similar to the estimates in the full sample that account for the initial imbalance by controlling for fathers’ education level. This similarity confirms that, as expected in an RCT, adding controls has no impact on the estimates once the sample is balanced. Additionally, it confirms that the model with no controls in the entire sample underestimates the treatment effect of PATHS and that controlling for parental education is a necessity that corrects for this bias.
PATHS treatment effect in the restricted estimation sample
| (1) | (2) | (3) | (4) | (5) | (6) | |
|---|---|---|---|---|---|---|
| Academic high | University | |||||
| Attending academic high school | school | University | enrolment or | |||
| Age 13 | Age 15 | Age 17 | completion | enrolment | graduation | |
| Panel A: no controls | ||||||
| PATHS treatment | 0.045** | 0.063** | 0.090*** | 0.078** | 0.052** | 0.062*** |
| (0.020) | (0.025) | (0.027) | (0.030) | (0.023) | (0.023) | |
| Observations | 1,264 | 1,224 | 1,028 | 936 | 928 | 904 |
| Control group mean dependent variable | 0.112 | 0.152 | 0.184 | 0.196 | 0.114 | 0.167 |
| Number of classes excluded | 24 | 24 | 24 | 24 | 24 | 24 |
| Child age | 13 | 15 | 17 | 20 | 20 | 24 |
| Panel wave | 5 | 6 | 7 | 8 | 8 | 9 |
| Panel B: parental education controls | ||||||
| PATHS treatment | 0.039** | 0.055*** | 0.085*** | 0.083*** | 0.055*** | 0.061*** |
| (0.016) | (0.018) | (0.018) | (0.021) | (0.020) | (0.017) | |
| Observations | 1,264 | 1,224 | 1,028 | 936 | 928 | 904 |
| Control group mean dependent variable | 0.112 | 0.152 | 0.184 | 0.196 | 0.114 | 0.167 |
| Number of classes excluded | 24 | 24 | 24 | 24 | 24 | 24 |
| Child age | 13 | 15 | 17 | 20 | 20 | 24 |
| Panel wave | 5 | 6 | 7 | 8 | 8 | 9 |
Notes: This table shows the treatment effect of the PATHS intervention on attending academic high school at age 13, 15, and 17 as well as academic high school completion at age 20, university enrolment at age 20, and university enrolment or graduation at age 24. All outcomes are indicator variables and the specifications are estimated using linear probability models in the restricted sample in which we drop 24 classes to correct for the imbalance in fathers’ education level between the treatment and control groups. In Panel A, we do not include any controls for baseline characteristics. In Panel B, we include controls for mothers’ and fathers’ education level. The outcomes attending academic high school at ages 13, 15, and 17 are based on administrative data. The outcomes academic high school completion, university enrolment, and university enrolment or graduation are self-reported. All models include strata fixed effects for the level of randomization. Robust standard errors clustered at the school level are in parentheses. ***p < 0.01, **p < 0.05, *p < 0.1.
6.3 Additional robustness tests
This section provides an additional set of robustness tests for our results. First, we test whether our conclusions remain the same if we compute p-values based on randomization inference. Second, we estimate specifications using an alternative treatment group definition. Third, we test whether selective attrition drives our results. Fourth, we discuss possible concerns of experimenter demand effects.
Randomization inference: In the main analysis, we cluster standard errors at the school level, resulting in fifty-six clusters. As a robustness test, we compute p-values based on randomization inference using 10,000 random permutations following Young (2019). With this procedure, we account for possible bias in standard errors due to a small number of clusters. Table 4 shows that p-values based on randomization inference lead to the same overall conclusions.
Alternative treatment group definitions: Our baseline analysis compares individuals exposed to PATHS (treatment) to individuals who were not exposed to PATHS (control). However, some individuals in the treatment and control groups were also exposed to the Triple P programme. In Supplementary Table D1, Panel B, we show estimates comparing individuals who were assigned to the Triple P programme versus individuals who were not exposed to Triple P. This table shows that the Triple P intervention has no significant effect on educational outcomes. The lack of effects for Triple P is consistent with Eisner et al. (2012b), who show that the intervention had no short-term effects on either parenting practices or child problem behaviour.
An alternative evaluation strategy is to drop all students that received the Triple P treatment and compare only the pure PATHS with the pure control group. In Supplementary Table A8, we show that, although we lose about half of our observations, results remain very similar.
Alternative treatment group definitions—full 2 × 2 design: Supplementary Table D1 provides additional evidence on the robustness of our results by comparing all treatment arms of the original experiment. Panels A and B confirm that PATHS, in contrast to Triple P, is effective. Panel C in Supplementary Table D1 reports estimates for a model that includes an interaction effect between the two interventions, PATHS and Triple P. The PATHS treatment effect in Panel C is similar to Panel A and confirms that children exposed to PATHS are more likely to complete academic high school. As in Panel B, children exposed to the Triple P programme are not significantly affected. The interaction effect between both interventions (PATHS * Triple P) never reaches statistical significance in any of the columns (1)–(3). These results suggest that there is no additional benefit from exposure to both programmes.
Selective attrition: We observe initial tracking from administrative data for 95% of the initial sample. We observe university enrolment/graduation for 69% of the initial sample. To test for selective attrition, we estimate the effect of attending the PATHS programme on the probability of observing an individual in our estimation sample at five different points in time: at ages 13, 15, 17, 20, and 24.18 More specifically, we regress an indicator showing whether we observe the individual in our sample at a given time on a PATHS treatment indicator. Supplementary Table A6, Panel A, shows that the treatment does not affect the probability of being observed in the sample at different points in time. The PATHS coefficients are small and not statistically significant in all specifications. Selective attrition does not appear to drive our results.19
Demand effects: As in any social experiment, our results raise the question of whether knowledge of treatment or experimenter demand effects could drive treatment effects. Two reasons speak against this. First, tracking in Switzerland is determined by two objective student performance measures: (1) grades in core subjects in the last grade of primary school and (2) standardized externally evaluated admission test scores. Therefore, tracking is not a choice variable, and it is not determined by subjective teacher recommendations. Second, those teachers involved in the programme in Grade 2 have no direct or indirect influence on the tracking decision that takes place four years later. At the end of Grade 3, after the intervention is completed, children are reassigned to new teachers uninvolved in the intervention. It is therefore not plausible that these new teachers—who did not implement the programme—manipulated treated students’ grades four years after the end of the programme to push them into academic high school. Third, the competitive tracking system and the fact that the treatment effect persists over time reject the interpretation that demand effects drive our results. If the intervention motivated teachers to inflate treated students’ grades and pushed unqualified students into academic high school, they would not have survived in this competitive track. During the first two probation years, students initially tracked into academic high school who fail to meet performance standards are moved to the lower track. At the same time, a substantial number of students from the lower track move up into the academic high school at different times. If initial treatment effects had been driven by teacher-inflated grades, these students would not have survived the competitive environment of academic high schools. The fact that students move substantially between tracks in combination with the lasting treatment effect for academic high school completion rejects the idea that demand effects or knowledge of the treatment status could be driving our main results.
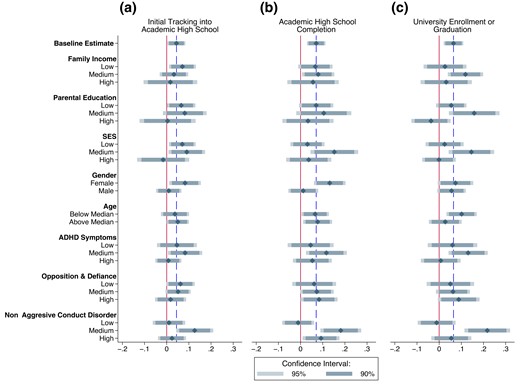
Heterogeneous treatment effects Notes: This figure shows heterogeneous treatment effects for (a) initial tracking into academic high school at age 13, (b) academic high school completion at age 20, and (c) university enrolment or graduation at age 24. The dashed line indicates the baseline treatment effects. We estimate treatment effects by family income, parental education, SES, gender, age, as well as on baseline child SBQ measures for ADHD symptoms (disruptiveness and impulsiveness), opposition and defiance, and non-aggressive conduct disorder. For family income, ADHD symptoms, opposition and defiance, and non-aggressive conduct disorder, the groups low, middle, and high are defined by the respective tertiles of the sample distribution. For parental education, low is defined as both parents not having an academic high school degree, middle is defined as one parent having an academic high school degree, and high is defined as both parents having an academic high school degree. Low SES includes families with incomes in the bottom two quintiles of the sample distribution, with a non-working father, and with both parents not having an academic high school degree or families with income in the lowest quintile of the sample distribution. Middle SES includes families with incomes in the second to fourth quintile of the sample distribution, with a working parent, and with at least one parent that has an academic high school degree or families with incomes in the third quintile of the sample distribution, with a non-working parent, and with both parents not having an academic high school degree. High SES includes families with incomes in the second to fifth quintile of the sample distribution, with a working parent, and with both parents having an academic high school degree or families with incomes in the top quintile of the sample distribution. Estimates are based on models in Table 4 that include the full set of controls. All models include strata fixed effects for the level of randomization. Each point estimate is shown with the respective 90% and 95% confidence intervals calculated based on standard errors clustered at the school level.
6.4 Heterogeneous treatment effects
Figure 5 investigates potential heterogeneous treatment effects for the impact of PATHS. Panel (a) displays the effects on initial tracking at age 13, Panel (b) shows the effects for academic high school completion, and Panel (c) illustrates the effect on university enrolment or graduation at age 24. We estimate heterogeneous effects by family income, parental education, socio-economic status (SES), and the child's gender and age. We also investigate heterogeneity in treatment effects by the main socio-emotional skills targeted by PATHS including ADHD symptoms, opposition and defiance, and non-aggressive conduct disorder. To estimate heterogeneous effects, we augment equation (1) with interaction terms between the treatment variable and indicators for different subgroups. All subgroups are defined based on pre-treatment characteristics. Figure 5 shows the estimation results with the respective subgroup shown on the y-axis. Overall, the analysis remains suggestive and mainly shows that we lack the statistical power to detect systematic differences between subgroups.
7. MECHANISMS
In this section, we study four possible mechanisms for the effect of the PATHS programme on educational trajectories. First, we analyse whether PATHS affected the two elements that determine the tracking outcome: primary school grades and academic high school admission test scores. Second, we study whether PATHS affected children's socio-emotional development—the main target of the intervention. Third, as some of the PATHS activities involve parent–child interactions, we test whether the intervention affected parenting practices. Fourth, we investigate whether PATHS affected school-related behaviour like classroom disruption and homework completion.20
7.1 Effects on grades and admission test scores
Primary school grades are given on a scale of 1–6 and are based on tests and the subjective assessments of the primary school teacher. The standardized high school admission test is graded on that same 1–6 scale and covers mathematics, reading comprehension, and writing. The test is evaluated by an external high school teacher who typically does not know the child. Students’ tracking outcomes are determined by their average primary school grades and their admission test scores. Both performance measures have equal weight, and students with a minimum of 4.5 out of 6 are admitted to academic high school.21
We estimate the effect of PATHS on grades and admission test scores using the specification with the full set of controls. To simplify the interpretation of the results, we standardized both outcome variables to have means of zero and standard deviations of one. Figure 6 provides suggestive evidence that the PATHS programme increases children's grades. Due to the lower sample size for this outcome, effects are less precisely estimated. Figure 6 suggests that PATHS increases grades by 20–25% of a standard deviation.22 Figure 6 also shows the treatment effect on the admission test scores. Point estimates on test scores are close to zero. While this coefficient is imprecisely estimated and not statistically significant, we cannot fully rule out that the treatment had some positive impact on the standardized admission test.

Treatment effects on grades and admission test scores Notes: This figure shows the treatment effect of the PATHS intervention on children's standardized grades and children's test scores on the centralized admission test for academic high school. Specifications are estimated using OLS using controls for baseline child and household characteristics. Child controls include the age and gender of the child, having Swiss citizenship, measures for anxiety and depressivity, ADHD, non-aggressive externalizing problem behaviour, non-aggressive conduct disorder, opposition and defiance, prosociality, four measures of aggressive behaviour, and four measures of overall behaviour. Household controls include household income, mother's and father's education level, age of the mother, indicator variables for the mother's having Swiss citizenship and being born in Switzerland, and indicator variables for a single-parent household, a household that received financial aid, and a household that experienced financial problems. All models include strata fixed effects for the level of randomization. The regressions use inverse probability (IP) weighting, with weights constructed by regressing an indicator for whether we observe any grade or test score and then taking the square of the inverse prediction. In Model 1, we use the full set of controls except child SBQ when estimating the weights; in Model 2, we use the full set of controls when estimating the weights. Estimates for admission test scores are based on the score obtained from the first time taking the test. Grades in primary school correspond to the teacher-given grades obtained before taking the admission test. Each point estimate is shown with the respective 90% and 95% confidence intervals calculated based on standard errors clustered at the school level.
Taken together, our results suggest that the intervention raises grades but has only a limited impact on admission test scores. On the one hand, test scores mainly capture dimensions of children's cognitive skills. On the other hand, grades are likely to also reflect differences in classroom behaviour, aptitude, and engagement.23 One plausible interpretation for the effects is that treated children display better classroom behaviour that is rewarded with higher grades by the teacher. Our results suggest that long-term intervention effects are more likely to operate through changes in socio-emotional skills rather than cognitive skills.
7.2 Effects on socio-emotional skills
We investigate changes in children's socio-emotional development as possible mechanisms. We measure this development with the SBQ, which teachers and parents’ answer. This questionnaire includes the following six domains: (1) ADHD symptoms (disruptiveness and impulsiveness), (2) opposition and defiance, (3) non-aggressive conduct disorder, (4) anxiety and depressivity, (5) aggression, and (6) prosociality. Each of these domains is measured with up to ten subitems that ask about the prevalence of a specific behaviour.24 For every survey wave, we combine all available responses from the primary caregiver and the teacher. We do this by computing the sum of answers to each subitem domain, then take the average and standardize for the primary caregiver and teacher, then compute the average of teacher and primary caregiver reports and standardize again to obtain measures with a mean of zero and a standard deviation of one.
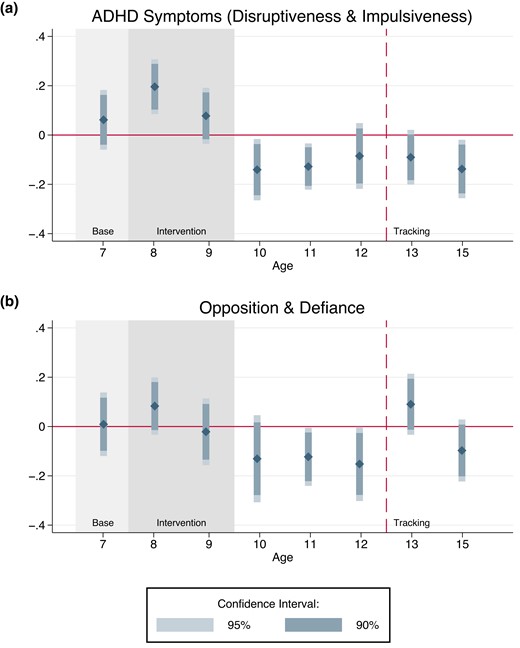
Dynamic treatment effects on socio-emotional skills I Notes: This figure shows the treatment effect of the PATHS intervention on children's socio-emotional skills from ages 7 through 15. The dependent variable in Panel (a) is ADHD symptoms (disruptiveness and impulsiveness). The dependent variable in Panel (b) is opposition and defiance. All dependent variables are indices standardized to mean zero and a standard deviation of one. All models include controls for baseline child and household characteristics. Child controls include the age and gender of the child, having Swiss citizenship, measures for anxiety and depressivity, ADHD, non-aggressive externalizing problem behaviour, non-aggressive conduct disorder, opposition and defiance, prosociality, four measures of aggressive behaviour, and four measures of overall behaviour. Household controls include household income, mother's and father's education level, age of the mother, indicator variables for the mother's having Swiss citizenship and being born in Switzerland, and indicator variables for a single-parent household, a household that received financial aid, and a household that experienced financial problems. To provide evidence on balance across the treatment and the control groups, we do not include individual controls in the estimation of the treatment effect at age 7. For each SBQ measure, we combine measures from teacher and parent reports by taking the average of the two standardized indices and standardizing the resulting index again. For measures at ages 8, 10, 12, 13, and 15, we rely solely on teacher reports, as there are no parent surveys at these times. Details on the SBQ items and construct reliability are provided in Supplementary Appendix B. Shaded areas indicate the baseline and the intervention periods. The dashed vertical line shows the time when tracking into secondary schools takes place. All models include strata fixed effects for the level of randomization. Each point estimate is shown with the respective 90% and 95% confidence intervals calculated based on standard errors clustered at the school level.
Figure 7 shows the PATHS treatment effect on ADHD symptoms and opposition and defiance. Panel (a) of Figure 7 shows the evolution of the PATHS treatment effect on ADHD symptoms (disruptiveness and impulsiveness) over time. PATHS causes children to become more impulsive and disruptive during the intervention period and persistently less impulsive and disruptive after the intervention is completed.25
Seeing more behavioural problems during the intervention is, at first sight, surprising. This effect goes against the aim of the intervention. One explanation is that the intervention made teachers and parents more aware of what appropriate child behaviour should look like. This possible increased awareness may have made them more critical in the short run. Consistent with this interpretation, the PATHS developers provide anecdotal evidence showing that teachers raise their expectations about children's appropriate behaviour during the intervention.
After the intervention, starting from age ten, we see that PATHS reduces ADHD symptoms by making children less disruptive and impulsive. At age ten, children were also reassigned to new classes and new teachers who were not involved in the intervention. From this age, our measures therefore likely reflect child behaviour and development more objectively. The treatment effect persists until primary school completion, when children are twelve years old, and remains visible at ages 13 and 15.26
Panel (b) of Figure 7 shows the PATHS treatment effect on opposition and defiance. Opposition and defiance capture behaviours like telling lies, cheating, or ignoring teachers’ instructions. The overall picture is similar to the treatment effect for ADHD symptoms. PATHS increases opposition and defiance during the intervention and decreases those behaviours after the intervention is completed. The treatment effects fade out after children transition to secondary school.
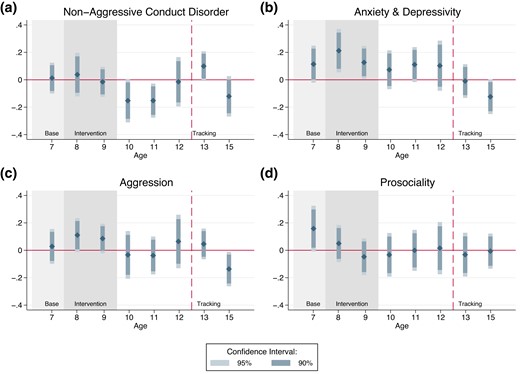
Dynamic treatment effects on socio-emotional skills II Notes: This figure shows the treatment effect of the PATHS intervention on children's socio-emotional skills from ages 7 through 15. The dependent variables are non-aggressive conduct disorder (Panel a), anxiety and depressivity (Panel b), aggression (Panel c), and prosociality (Panel d). All dependent variables are indices standardized to mean zero and a standard deviation of one. All models include controls for baseline child and household characteristics. Child controls include the age and gender of the child, having Swiss citizenship, measures for anxiety and depressivity, ADHD, non-aggressive externalizing problem behaviour, non-aggressive conduct disorder, opposition and defiance, prosociality, four measures of aggressive behaviour, and four measures of overall behaviour. Household controls include household income, mother's and father's education level, age of the mother, indicator variables for the mother's having Swiss citizenship and being born in Switzerland, and indicator variables for a single-parent household, a household that received financial aid, and a household that experienced financial problems. To provide evidence on balance across the treatment and the control groups, we do not include individual controls in the estimation of the treatment effect at age 7. For each SBQ measure, we combine measures from teacher and parent reports by taking the average of the two standardized indices and standardizing the resulting index again. For measures at ages 8 (anxiety and depressivity), 10, 12, 13, and 15, we rely solely on teacher reports, as there are no parent surveys at these times. Details on the SBQ items and construct reliability are provided in Supplementary Appendix B. Shaded areas indicate the baseline and the intervention periods. The dashed vertical line shows the time when tracking into secondary schools takes place. All models include strata fixed effects for the level of randomization. Each point estimate is shown with the respective 90% and 95% confidence intervals calculated based on standard errors clustered at the school level.
Figure 8 shows the effects of PATHS on non-aggressive conduct behaviour (Panel a), anxiety and depressivity (Panel b), aggression (Panel c), and prosociality (Panel d). PATHS reduces children's non-aggressive conduct disorders such as lying, stealing, or destroying other children's belongings after the intervention. This effect remains visible until age 11 and fades out afterward. Anxiety, aggression, and prosociality do not appear to be systematically affected by the intervention.
7.3 Effects on parenting practices
We investigate changes in parent–child interactions and parenting practices.27 We analyse parenting practices using the APQ, which captures the following five domains: (1) corporal punishment, (2) parental control and supervision, (3) inconsistent discipline, (4) parental involvement, and (5) positive parenting. Each domain is measured with up to ten questions answered by the primary caregiver on a 5-point Likert scale ranging from “never” to “always”.28 To facilitate comparisons, we standardize each subdomain to have a mean of zero and a standard deviation of one.
Figure 9 shows the evolution of the PATHS treatment effect on parenting practices over time. Taken together, our analysis suggests that the intervention had no systematic impact on parenting practices. Our analysis is, however, limited by the type of parenting practices we observe in the data. It remains possible that parents, who we directly and indirectly targeted by several activities of the PATHS programme, changed their behaviour in domains that we do not observe in the data. However, we believe these changes are likely minor in our setting.
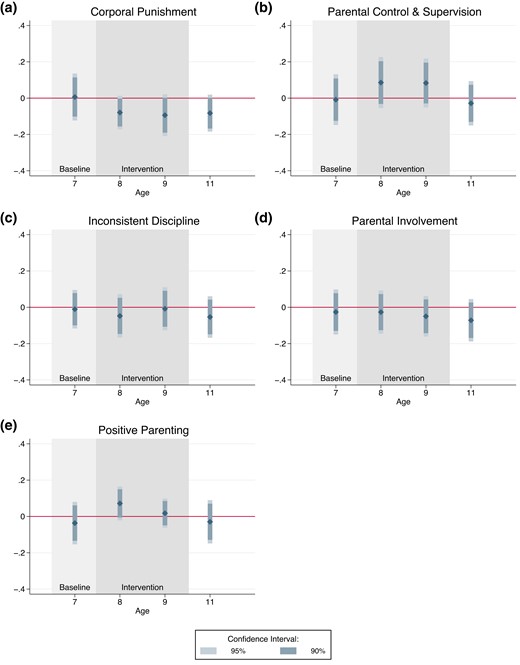
Dynamic treatment effects on parenting practices Notes: This figure shows the treatment effect of the PATHS intervention on parenting practices from ages 7 through 11. The dependent variables are corporal punishment (Panel a), parental control and supervision (Panel b), inconsistent discipline (Panel c), parental involvement (Panel d), and positive parenting (Panel e). All dependent variables are indices standardized to mean zero and a standard deviation of one. All models include controls for baseline child and household characteristics. Child controls include the age and gender of the child, having Swiss citizenship, measures for anxiety and depressivity, ADHD, non-aggressive externalizing problem behaviour, non-aggressive conduct disorder, opposition and defiance, prosociality, four measures of aggressive behaviour, and four measures of overall behaviour. Household controls include household income, mother's and father's education level, age of the mother, indicator variables for the mother's having Swiss citizenship and being born in Switzerland, and indicator variables for a single-parent household, a household that received financial aid, and a household that experienced financial problems. To provide evidence on balance across the treatment and the control groups, we do not include individual controls in the estimation of the treatment effect at age 7. Shaded areas indicate the baseline and the intervention periods. The dashed vertical line shows the time when tracking into secondary schools takes place. All models include strata fixed effects for the level of randomization. Each point estimate is shown with the respective 90% and 95% confidence intervals calculated based on standard errors clustered at the school level.
7.4 Effect on behaviour in class
In this section, we look at possible intervention effects on school-related behaviour. We have measures on school-related behaviour for four different domains: (1) disturbing lessons, (2) being busy with other things during classes, (3) displaying impertinent school behaviour, and (4) neglecting homework. We observe these outcomes starting from Grade 4, after children are reassigned to new classes and evaluated by a new teacher. Each domain is measured through a 5-point Likert scale ranging from “never” to “very often”. To facilitate comparisons, we standardize each subdomain to have a mean of zero and a standard deviation of one.
Figure 10 shows results for school-related behaviour. PATHS reduces children's likelihood of disturbing lessons by 13% of a standard deviation at age 10. The effect persists throughout secondary education. We see a similar pattern for children's ability to focus. Treatment effects are largest immediately after the intervention at age 10 with an effect equivalent to a reduction of about 20% of a standard deviation. We find no significant treatment effects for impertinent conduct at school or neglecting homework.

Dynamic treatment effects on behaviour in class Notes: This figure shows the treatment effect of the PATHS intervention on children's behaviour at school from ages 10 through 15. The dependent variables are disturbing the lesson (Panel a), being busy with other things in class (Panel b), displaying impertinent conduct at school (Panel c), and neglecting homework (Panel d). All dependent variables are indices standardized to mean zero and a standard deviation of one. All models include controls for baseline child and household characteristics. Child controls include the age and gender of the child, having Swiss citizenship, measures for anxiety and depressivity, ADHD, non-aggressive externalizing problem behaviour, non-aggressive conduct disorder, opposition and defiance, prosociality, four measures of aggressive behaviour, and four measures of overall behaviour. Household controls include household income, mother's and father's education level, age of the mother, indicator variables for the mother's having Swiss citizenship and being born in Switzerland, and indicator variables for a single-parent household, a household that received financial aid, and a household that experienced financial problems. Measures are taken from teacher reports. Shaded areas indicate the baseline and the intervention periods. The dashed vertical line shows the time when tracking into secondary schools takes place. All models include strata fixed effects for the level of randomization. Each point estimate is shown with the respective 90% and 95% confidence intervals calculated based on standard errors clustered at the school level.
7.5 Multiple hypothesis testing
We estimate treatment effects for a substantial number of outcomes. This implies that some statistically significant effects might simply represent chance findings. We address this concern by: (1) testing which estimates remain significant after grouping outcomes, (2) correcting for multiple hypothesis testing, and (3) creating an overall index for children's socio-emotional and cognitive development measured post-treatment.
Heckman et al. (2010a) point out that there is some arbitrariness in defining the blocks of hypotheses to be jointly tested in a multiple hypothesis testing procedure. We apply a simple and conservative criterion for our analysis: drawing on the fact that PATHS mainly targets children's socio-emotional, behavioural, and cognitive development, we include all child outcomes analysed as mechanisms and our latest educational outcome.
Socio-emotional skills and classroom behaviour are measured at multiple points in time. We can substantially reduce the number of hypotheses tested by creating a post-intervention index for a given skill. We can then test whether the intervention affected average post-intervention measures of a skill domain. To aggregate a given domain, we first standardize each period-specific measure. We then calculate the mean over all post-treatment periods and standardize again. This results in ten distinct socio-emotional and two cognitive skills measures.
Table 7 shows treatment effects for these ten socio-emotional skill measures plus university enrolment or graduation at age 24, grades, and admission test scores. Results highlight that the post-treatment indexes for ADHD symptoms (column 4), opposition and defiance (column 5), non-aggressive conduct disorder (column 6), disturbing lessons (column 10), and being busy with other things (column 11) are significantly affected by the intervention. In other words, children exposed to the PATHS programme significantly improve their post-treatment behaviour in these realms.
Multiple hypothesis testing I
| (11) | |||||||||||||
|---|---|---|---|---|---|---|---|---|---|---|---|---|---|
| (1) | (2) | Busy | |||||||||||
| University | Standardized | (3) | with | (12) | |||||||||
| enrolment | grades in | Standardized | (5) | (7) | (10) | other | Impertinent | (13) | |||||
| or | primary | admission | (4) | Opposition and | (6) | Anxiety/ | (8) | (9) | Disturbs | things | conduct at | Neglects | |
| graduation | school | test scores | ADHD | defiance | NACD | depressivity | Aggression | Prosociality | lessons | in class | school | homework | |
| PATHS treatment | 0.0647*** | 0.161 | −0.00495 | −0.154*** | −0.148*** | −0.136** | 0.0541 | −0.0390 | −0.0168 | −0.172*** | −0.161*** | −0.0954 | −0.0205 |
| Original p-value | 0.005 | 0.262 | 0.964 | 0.001 | 0.005 | 0.034 | 0.333 | 0.556 | 0.778 | 0.002 | 0.003 | 0.118 | 0.658 |
| Bonferroni–Holm corrected p-value | 0.048 | 1.000 | 1.000 | 0.012 | 0.049 | 0.268 | 1.000 | 1.000 | 1.000 | 0.025 | 0.029 | 0.827 | 1.000 |
| Bonferroni corrected p-value | 0.062 | 1.000 | 1.000 | 0.012 | 0.071 | 0.436 | 1.000 | 1.000 | 1.000 | 0.027 | 0.035 | 1.000 | 1.000 |
| Observations | 815 | 364 | 375 | 1,035 | 1,035 | 1,035 | 1,035 | 1,035 | 1,035 | 1,034 | 1,034 | 1,034 | 1,034 |
| R2 | 0.249 | 0.626 | 0.658 | 0.502 | 0.358 | 0.376 | 0.244 | 0.400 | 0.368 | 0.387 | 0.379 | 0.239 | 0.297 |
| Control group mean dependent variable | 0.252 | 0.01 | 0.074 | 0.03 | 0.041 | −0.003 | −0.082 | −0.034 | 0.016 | 0.024 | 0.06 | −0.005 | −0.022 |
| IP-weighting | No | Yes | Yes | No | No | No | No | No | No | No | No | No | No |
Notes: This table shows the treatment effect of the PATHS intervention on cognitive and socio-emotional outcomes. University enrolment or graduation refers to age 24 and is an indicator variable. Standardized grade corresponds to the teacher-given, primary school grades obtained before taking the academic high school admission test. Estimates for admission test scores are based on the score obtained from the first time taking the test. Admission to academic high school is possible after Grades 6, 8, and 9. The second and third regression are based on inverse probability weighting, with weights constructed by regressing an indicator for whether we observe any grade or test score on the full set of controls and then taking the square of the inverse predictions. Columns (4)–(9) show the treatment effect for socio-emotional outcomes and columns (10)–(13) for classroom behaviour. The outcomes in columns (4)–(12) are averaged over survey waves and then standardized across the sample. We include Bonferroni and Bonferroni–Holm p-values to perform multiple hypotheses testing. All models are estimated using controls for baseline child and household characteristics. Child controls include the age and gender of the child, having Swiss citizenship, measures for anxiety and depressivity, ADHD, non-aggressive externalizing problem behaviour, non-aggressive conduct disorder, opposition and defiance, prosociality, four measures of aggressive behaviour, and four measures of overall behaviour. Household controls include household income, mother's and father's education level, age of the mother, indicator variables for the mother's having Swiss citizenship and being born in Switzerland, and indicator variables for a single-parent household, a household that received financial aid, and a household that experienced financial problems. All models include strata fixed effects for the level of randomization. Robust standard errors clustered at the school level are in parentheses. ***p < 0.01, **p < 0.05, *p < 0.1.
Given that some of these significant effects may still represent chance findings, we next apply a Bonferroni correction. Table 7 reports the Bonferroni (Abdi, 2007) and Bonferroni–Holm (Holm, 1979; Jones et al., 2019) corrected p-values for the thirteen socio-emotional and cognitive measures we investigate as candidate mechanisms. The positive treatment effect for university enrolment or graduation at age 24 remains significant as well as reductions in ADHD symptoms, opposition and defiance, and improvements in two measures of classroom behaviour. The marginally significant treatment effect for non-aggressive conduct disorder does not survive the correction.
Finally, instead of considering thirteen different post-treatment outcomes, we construct one overall index for children's socio-emotional and cognitive development. This index is obtained by combining the thirteen post-intervention measures shown in Table 7 in the following way: first, we negate the sign on all “negative outcomes”, that is, ADHD symptoms, opposition and defiance, non-aggressive conduct disorder, anxiety and depressivity, aggression, disturbs lessons, busy with other things in class, impertinent conduct at school, and neglects homework to align their interpretation with the other positive socio-emotional outcomes. Second, we average across these thirteen standardized measures. Third, we standardize the resulting super-index to obtain a measure capturing productive child development.29 Table 8 shows that the PATHS treatment significantly increases the post-intervention child development super-index (p-value = 0.008). Taken together, our results remain robust with respect to multiple hypothesis testing.
Multiple hypothesis testing II
| (1) | |
|---|---|
| Overall socio-emotional and | |
| cognitive outcomes | |
| PATHS treatment | 0.134*** |
| (0.049) | |
| p-value | 0.008 |
| Observations | 1,043 |
| R2 | 0.454 |
| Control group mean dependent variable | 0.004 |
| (1) | |
|---|---|
| Overall socio-emotional and | |
| cognitive outcomes | |
| PATHS treatment | 0.134*** |
| (0.049) | |
| p-value | 0.008 |
| Observations | 1,043 |
| R2 | 0.454 |
| Control group mean dependent variable | 0.004 |
Notes: The outcome variable is an index created by standardizing the variable university enrolment or graduation, then taking the mean over all 13 outcomes in Table 7 and then standardizing across the sample. Before taking the mean, we first reverse the sign on all “negative outcomes”, that is, ADHD, opposition and defiance, non-aggressive conduct disorder, anxiety and depressivity, aggression, disturbs lessons, busy with other things in class, impertinent conduct at school, and neglects homework. In doing so, we flip the interpretation from good to bad. We control for baseline child and household characteristics. Child controls include the age and gender of the child, having Swiss citizenship, measures for anxiety and depressivity, ADHD, non-aggressive externalizing problem behaviour, non-aggressive conduct disorder, opposition and defiance, prosociality, four measures of aggressive behaviour, and four measures of overall behaviour. Household controls include household income, mother's and father's education level, age of the mother, and indicator variables for the mother's having Swiss citizenship and being born in Switzerland, indicator variables for a single-parent household, a household that received financial aid, and a household that experienced financial problems. The outcome initial tracking into academic high school is based on administrative data. The model includes strata fixed effects for the level of randomization. Robust standard errors clustered at the school level are in parentheses. ***p < 0.01, **p < 0.05, *p < 0.1.
8. MEDIATION ANALYSIS
We perform a mediation analysis in the spirit of Heckman and Pinto (2015) and Gelbach (2016) to quantify the proportion of the treatment effect mediated by our proposed mechanisms and to separate the contribution of each single mechanism to the estimated treatment effect.
The results of the mediation analysis should be interpreted with caution. Imai et al. (2010) show that to be able to interpret this type of analysis causally, one needs to make strong assumptions about the source of variation of the mediators. As we lack exogenous variation in specific channels and have to rely on a single source of exogenous variation (one randomization), this analysis can only provide suggestive evidence on the importance of different mediators in explaining treatment effects.
We perform the mediation analysis for the following education outcomes: attendance of academic high school at ages 13, 15, and 17, academic high school completion, university enrolment at age 20, and university enrolment or graduation at age 24. As possible mediators, we focus on socio-emotional skills, parenting practices, and classroom behaviour. The set of mediators includes all variables analysed as potential mechanisms in Section 7 except grades and test scores because these variables are only available for a subsample of students that sit for the standardized academic high school admission test. We aggregate all candidate mechanisms into three domains: (1) socio-emotional skills, (2) parenting practices, and (3) classroom behaviour. Given the longitudinal nature of our data, we only consider measures obtained after the intervention and before the educational outcome is measured. In cases in which we have multiple observations for the same mediator, we construct a summary index using the covariance weighting procedure discussed in Anderson (2008). We assume that the PATHS treatment has both direct and indirect effects on education outcomes. The indirect effects run through treatment effects of the intervention on socio-emotional skills, parenting practices, and classroom behaviour. The results of the mediation analysis will give us an estimate of the importance of these indirect effects.
Panel (a) of Figure 11 shows the results of the mediation analysis. Each horizontal bar represents a specific outcome of interest.30 Coloured areas within the bars illustrate the contribution of each mediator to the overall treatment effect. The grey area stands for the unexplained share of the treatment effect. The mediation analysis highlights that our candidate mechanisms explain about 20–39% of the treatment effect. Among the mechanisms we study, socio-emotional skills appear as the most important mediator of the PATHS treatment effect. For example, socio-emotional skills explain about 25% of the PATHS treatment effect on university attendance at age 20 and about 39% for university enrolment or graduation at age 24. The contribution of parenting practices and classroom behaviour are smaller and less stable across different outcomes, suggesting that these are less important mechanisms.
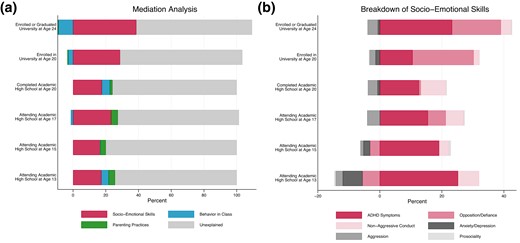
Mediation analysis Notes: This figure shows the results of our mediation analysis. Panel (a) shows the decomposition of the overall treatment effect. In Panel (a), we include socio-emotional skills, parenting practices, and behaviour in class as mediators. Panel (b) shows the decomposition of socio-emotional skills. We decompose the treatment effect obtained from the unconditional outcome equation
Given their important mediating role, in Panel (b) of Figure 11, we investigate the contribution of each socio-emotional skill. The main mediator is reduction of ADHD symptoms. The relative importance of its mediating role is similar across outcomes and does not depend on the children's age. Non-aggressive conduct disorders and opposition and defiance are also relevant mediators, but quantitatively less important. Their mediating role is also less stable over time. The remaining socio-emotional skills seem to have a negligible role as mediators (prosociality) or have a negative load as mediators (anxiety and aggression).
Taken together, the mediation analysis described in this section suggests that the PATHS treatment effect on educational outcomes is driven by treatment-induced improvements in children's socio-emotional skills, in particular, by reductions in ADHD symptoms—impulsiveness and disruptiveness.
9. COMPARISON OF COSTS, BENEFITS, AND PREVIOUS EVALUATIONS
In this section, we contextualize the main results of this study. We start with the discussion of other RCTs that evaluated the PATHS programme. We then compare the size of the treatment effects and the cost of PATHS to other (iconic) childhood intervention studies.
9.1 Previous evaluations of PATHS
This is not the first evaluation of the PATHS programme. Over the past two decades, PATHS has become increasingly popular and has been used in at least thirty-six countries. Supplementary Table A1 provides an overview of all studies that provide causal evidence on PATHS effectiveness. Crean and Johnson (2013) examine the effect of PATHS on U.S. elementary school students’ aggressive behaviour and find lower levels of aggressive behaviour for treated students. The effect persists over two years after the intervention. Greenberg et al. (1995) show that PATHS increases vocabulary and emotional intelligence of second and third grade children in the U.S. Schonfeld et al. (2015) find similar results and show that PATHS improves reading and math proficiency in primary school. This effect, however, disappears two years after the intervention. Kam et al. (2004) evaluate PATHS in a sample of children with special needs living in the U.S. They find positive effects on externalizing and internalizing behaviour and reduced self-reported depressivity three years after the intervention. Riggs et al. (2006) show that PATHS fosters inhibitory control and leads to less disruptive behaviour. While many of the results of previous evaluations are consistent with our evidence on underlying mechanisms, we find no evidence that the intervention reduced physical aggression in our setting.
Supplementary Table A1 highlights that previous evaluations of PATHS focus on short-term behavioural changes in primary school and were not designed to provide evidence of long-run effectiveness. In contrast to these studies, we follow students over a substantially longer time horizon and do not limit the analysis to survey-based behavioural measures. By looking at how the intervention affects school careers as well as university enrolment and graduation, we provide unique evidence on the long-term effectiveness of one increasingly popular SEL programme. Our study is the first to establish a causal link between the PATHS programme and participation in higher education.
9.2 Other intervention studies and comparison of effect sizes and costs
In this section, we benchmark our intervention to similar interventions affecting educational outcomes and targeting child development. Figure 12 summarizes related intervention studies and our contribution to this literature. Panel (a) shows childhood intervention programmes with long-term evaluations: Campbell et al. (2002) evaluate the Abecedarian preschool programme, one of the oldest early childhood interventions, and show that the intervention improved IQ, achievement, and college enrolment. Heckman et al. (2010a) and Schweinhart (1993) evaluate the Perry Preschool Program, which aimed to foster the development of disadvantaged children, and show that programme participants obtained more schooling, had higher earnings, and committed fewer crimes.31 Gertler et al. (2014) analyse long-term effects of the Jamaican Study that contained an intervention aimed at improving mother–child interactions through home visits. They find increases of 25% in earnings twenty years after the intervention. Algan et al. (2022) use data from the Montreal Longitudinal Experimental Study, which aimed to improve socio-emotional skills in boys with after-school training sessions. This intervention increased self-control and trust during adolescence and increased educational achievements in early adulthood.
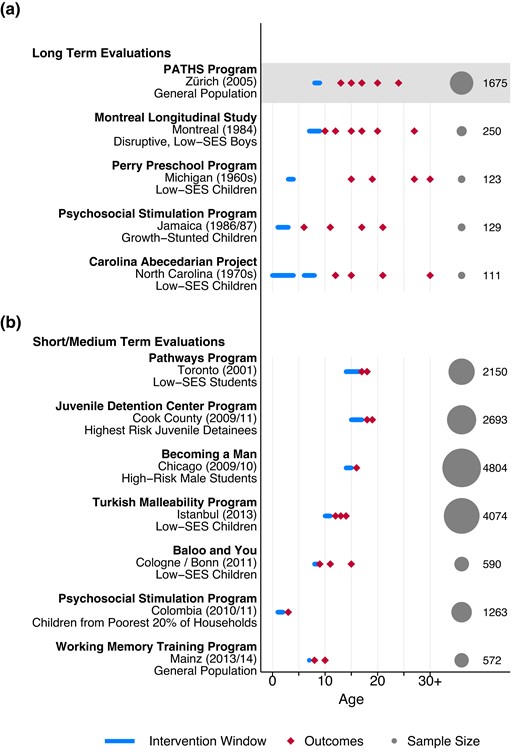
Related intervention studies and contribution to the literature Notes: This figure provides an overview of intervention studies in the related literature. Panel (a) shows intervention programmes with long-term evaluations. Panel (b) shows programmes with short- and medium-term evaluations of interventions targeting socio-emotional skills. Horizontal bars indicate the intervention duration. Red diamonds indicate when post-treatment measures are observed. Sample size refers to the number of students effectively randomized into treatment or control status. Information on the Montreal Longitudinal Study is taken from Algan et al. (2022). Information on the Perry Preschool Program is reported in Heckman et al. (2010a, 2010b). Information on the Jamaican Psychosocial Stimulation Program is taken from Gertler et al. (2014). Information on the Carolina Abecedarian Project is reported in Campbell et al. (2014), Information for the Juvenile Detention Center intervention and the BAM programme is reported in Heller et al. (2017). Information for the Pathways programme is reported in Oreopoulos et al. (2017). The Turkish Malleability Program refers to the RCTs analysed in Alan and Ertac (2018) and Alan et al. (2019). Sample size and invention periods for the Baloo and You programme are taken from Kosse et al. (2020) and Falk et al. (2020). Information for the Working Memory Training Program is reported in Berger et al. (2020).
Panel (b) in Figure 12 summarizes interventions with relatively short follow-ups. These interventions explicitly targeted socio-emotional skills in children. Compared to these studies, we study treatment effects over a longer time horizon.
Alan et al. (2019) show that an intervention targeting grit increases students’ perseverance and subsequent math test scores two years after the intervention. Alan and Ertac (2018) show that an intervention targeting patience improves self-control and the ability to imagine future selves. These effects lead to more patient intertemporal choices and persist over a three-year period. Cappelen et al. (2020) show that early childhood education affects children's social preferences for fairness and the importance children place on efficiency relative to fairness. Oreopoulos et al. (2017) evaluate a mentoring and tutoring programme and find that the programme increases high school completion by 35% and postsecondary enrolment by more than 60%. Kosse et al. (2020) study a mentoring programme for primary school children and show that the programme persistently increases prosociality. Falk et al. (2020) follow these children over time and show that the programme also increases the probability of being assigned to the academic high school track. Heller et al. (2017) evaluate the “Becoming a Man” (BAM) intervention in Chicago and find that the programme increases high school completion rates and reduces delinquent behaviour.
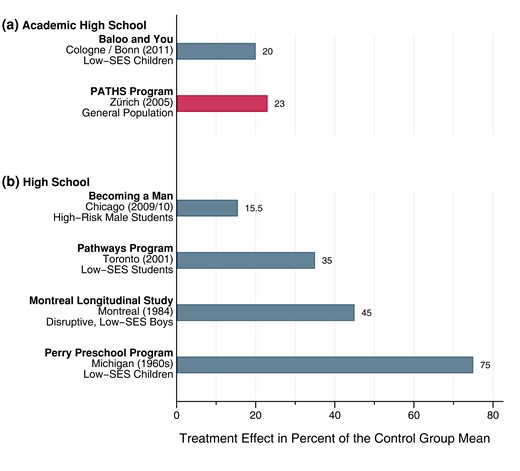
Effect size comparison to other interventions Notes: This figure shows treatment effect sizes for (academic) high school tracking or completion of different interventions in the related literature. The figure distinguishes between academic high school in Germany and Switzerland (Panel a) and high school completion in the U.S. and Canada (Panel b). The effect size for the Baloo and You programme is reported in Falk et al. (2020). The effect size of the Perry Preschool Program is reported in Heckman et al. (2010a). The intervention effect size of the Montreal Longitudinal Study is reported in Algan et al. (2022). The effect size for the BAM intervention represents the midpoint of the range of 12–19% as provided in Heller et al. (2017). The effect size of the Pathways programme is reported in Oreopoulos et al. (2017).
Comparison of effect sizes: Figure 13 illustrates differences in effect sizes across studies. In our setting, PATHS increases children's probability of completing academic high school by 23%. This effect size is comparable to effects of other interventions. The Montreal Longitudinal Study social skills training programme increases the probability of completing high school by 45% (Boisjoli et al., 2007; Algan et al., 2022). The BAM intervention forecasts treatment effects of 12–19% on high school completion (Heller et al., 2017). The Pathways mentoring and tutoring programme increases high school completion by 35% (Oreopoulos et al., 2017). The Working Memory Training programme increases the probability of getting tracked into academic high school by 16% (Berger et al., 2020). The Baloo and You mentoring programme increases the probability of getting tracked into academic high school by 20% (Falk et al., 2020). While Baloo and You and PATHS differ in their content, both interventions are similarly long (as measured in contact hours), target similarly aged children, and have almost identical treatment effects.
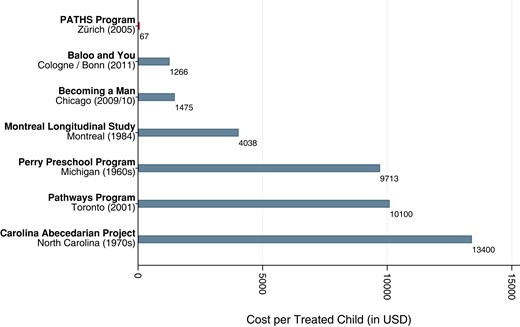
Cost comparison with other interventions Notes: This figure shows the cost per treated child of different interventions in the related literature. Cost estimates for the BAM, the Montreal Longitudinal Study, and the Carolina Abecedarian Projects intervention are taken from Heller et al. (2017), Algan et al. (2022), and Campbell et al. (2014), respectively. Costs of the Perry Preschool Program are taken from the Web Appendix of Heckman et al. (2010b). Cost estimates of the Baloo and You intervention in Germany are based on Péron and Baldauf (2015). Costs of the Pathways programme are reported in Oreopoulos et al. (2017).
The effect of PATHS is substantially smaller than effects of U.S. preschool programmes. The PATHS effect is about one-third of the effect size of the Perry Preschool Program on high school completion (Barnett, 1995; Heckman et al., 2010a) and about one-sixth of the effect of the Abecedarian programme on college attendance (Campbell et al., 2002). These studies might find larger effects because they are more time- and resource-intensive and target disadvantaged populations.
Comparison of costs: We complement our effect size comparison with a comparison of costs. This comparison is difficult because information on costs is sometimes missing and sometimes, like in the case of teacher salaries, very context dependent. Therefore, the following analysis should be interpreted with caution.
Figure 14 shows the costs of interventions for which this information is available. The total intervention cost per child refers to all costs over the intervention period, excluding evaluation costs. These costs are in nominal USD. The implementation of PATHS in Zurich cost USD 1,540 per class and USD 67 per child. The main cost of implementing PATHS stems from the teachers’ training and the material for PATHS activities, for example, teaching folders, posters, books, and feeling cards. The Baloo and You intervention costs USD 1,266 per child (Péron and Baldauf, 2015). The BAM intervention costs USD 1,475 per child (Heller et al., 2017). The socio-emotional skills and parenting training implemented as part of the Montreal Longitudinal Study costs USD 4,038 per child (Algan et al., 2022). The Pathways mentoring and tutoring programme costs USD 10,100 per child (Oreopoulos et al., 2017). In light of their substantial treatment effects, all these interventions seem cost-effective. However, PATHS stands out as remarkably low-cost.
PATHS is also substantially less expensive than early childhood education programmes like the Perry Preschool Program or the Abecedarian project. The Perry Preschool Program costs USD 10,000 per child (Web Appendix of Heckman et al., 2010b). The Abecedarian programme costs USD 13,400 per child (Campbell et al., 2014). These striking cost differences reflect that the Perry Preschool Program and the Abecedarian programme are high-intensity interventions targeted at particularly disadvantaged populations.
10. THE VOLTAGE EFFECT—SCALABILITY OF THE PATHS INTERVENTION
In this section, we discuss the scalability of the PATHS programme, following List's (2022) five-step discussion guideline that addresses key concerns for scaling.
False positives: A general concern regarding scalability is that an effect may disappear once a programme is rolled out because it was a false positive—a chance finding. This concern also applies to our study because we examine multiple outcomes, including education outcomes over time and mechanisms like changes in socio-emotional skills. However, the broad range of analysed outcomes makes it difficult to attribute our findings solely to chance. Additionally, we pre-registered (AEARCTR-0003496) our intention to analyse academic high school attendance, grades, and socio-emotional skills when applying for data access. Nevertheless, to address this concern, we conducted multiple hypothesis testing in Section 7.5. Our results remain robust with respect to multiple hypothesis testing, indicating that false positives do not pose a threat to the scalability of the PATHS intervention.
Audience representativeness: Scalability is also challenged if the initial population that is exposed to the intervention differs from the population that receives the intervention when the programme is scaled up. Our intervention sample consists of fifty-six Swiss primary schools in Zurich. These schools were randomly selected and mandated to participate in the field experiment and data collection. This sampling procedure suggests that our sample is representative of all schools and students in Zurich. As there was no selection into the evaluation sample at the student, teacher, or school level, we believe that concerns about audience representativeness are minimal.
At a broader level, it is reasonable to ask how representative the student population in Zurich is for Switzerland or Europe. Table 1 highlights that our sample is quite diverse. A significant percentage of mothers (57.7%) were not born in Switzerland, and 38.5% come from another European country. Treatment effects are visible for both native and foreign children. This evidence mitigates concerns regarding audience representativeness.
One additional potential concern is that the tracking-based education system in Switzerland is distinct, and we may not expect similar intervention effects in other countries. However, Figure 15, Panel (a), illustrates that other European countries have similar school tracking systems. Several countries including Austria, Germany, and the Netherlands use tracking systems akin to the Swiss one. Hence, we believe that our results are applicable to various settings outside Switzerland. Moreover, in addition to treatment effects for tracking, we find significant reductions in ADHD symptoms—even before tracking occurred. These results indicate that the intervention has positive effects independent of school tracking.
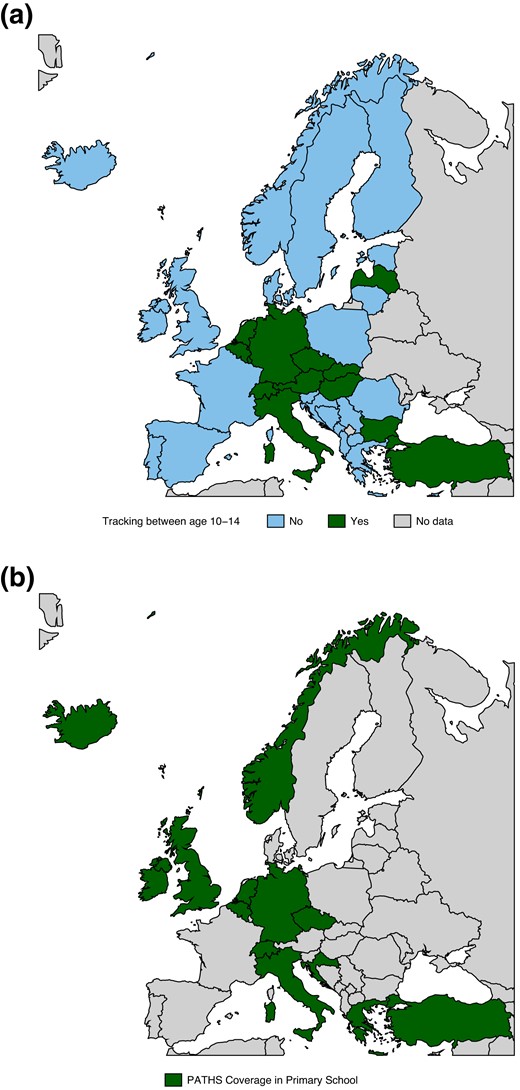
Tracking systems in European countries and PATHS prevalence. Panel (a): early school-based tracking. Panel (b): PATHS usage in European primary education Notes: This figure provides a stylized overview of tracking systems in Europe and PATHS usage in European primary education. Panel (a) highlights differences in tracking age from primary to secondary education. Green indicates all countries in which students are tracked into different schools to follow distinct educational pathways or specific types of education between the ages of 10 and 14. Blue indicates countries for which this is not the case. Information about tracking systems stems from the European Commission (2019, 2022). Panel (b) highlights the European countries in which at least one primary school implemented the PATHS programme. Coverage is based on the following studies: Humphrey et al. (2016), Malti et al. (2011), Goossens et al. (2012), Morganti and Signorelli (2016), and Novak et al. (2017). Moreover, we used information given in a report by the Oregon Addiction and Mental Health Services and Washington Division of Behavioral Health and Recovery (2012).
Unscalable ingredients: Some interventions include elements that cannot easily be replicated. The primary ingredient for the PATHS intervention is teacher training and the introduction of a new school subject. According to the coordinators of the Swiss programme, PATHS has been successfully scaled up. In recent years, the PATHS programme has been rolled out in Switzerland. To date, around 40,000 children in Switzerland have participated in the programme since the initial experiment that we evaluate. Therefore, we believe that PATHS does not include unscalable components.
Have similar programmes been scaled in other settings? According to the 2018 European Union Report on SEL by Cefai et al. (2018), most education systems do not have a dedicated subject devoted to socio-emotional skill development. According to Cefai et al. (2018), Ireland and Malta are the only countries in Europe with a country-wide distinct SEL subject. In many other European countries, SEL is not a distinct subject but rather is included in other subjects such as citizenship, health and physical education, prevention of violence and bullying, moral/religious education, and art and crafts (OECD, 2015; Torrente et al., 2015). In Finland, for example, “Growth as a Person” is a cross-curricular theme dedicated to social and emotional education and applied in all subjects.
In which settings has the PATHS programme been implemented? Panel (b) in Figure 15 illustrates that the PATHS programme has been implemented in primary schools in various countries. In sum, given that the PATHS intervention was adapted from the U.S. context and is currently widely used worldwide, we do not believe that it contains unscalable components.
Cost traps: As discussed in Section 9.2, the PATHS programme is relatively cost-effective. While scaling a programme can sometimes result in unforeseen costs that diminish the attractiveness of the intervention, our framework suggests that this risk is minor. In fact, according to the developers, implementation costs for the PATHS intervention decreased after the initial experiment. Following the initial costs of adopting the material to the Swiss context, costs have remained relatively stable over the past decade. Thus, we do not believe that cost traps represent a threat to the scalability of the PATHS programme.
Negative spillovers: Negative spillovers introduced by the rollout of interventions can also hinder scalability. Our findings raise questions about whether we would observe similar tracking effects if every child in Switzerland participated in the programme. These general equilibrium effects are ex ante unclear and depend on whether academic high schools would admit more students if the programme made all students more qualified. While academic high schools do not have explicit capacity constraints or quotas, there is a strong belief in Switzerland that these schools should remain selective.
To determine whether we would observe the same treatment effects on tracking if the entire population were treated, we can examine the year-to-year variation in the number of students admitted to academic high school.32 Figure 16 shows the year-to-year percentage change in the number of admitted students at the school level, revealing substantial variation in student admissions. The average year-to-year deviation in the school-level number of admitted students is 20 percentage points. Considering that we find treatment effects of 20–25% on the control group mean of 20%, it is feasible that academic high schools could admit all the additional students “pushed” by the intervention. Therefore, it is unlikely that large parts of the treatment effects would be absorbed by the general equilibrium effects of a nationwide rollout.
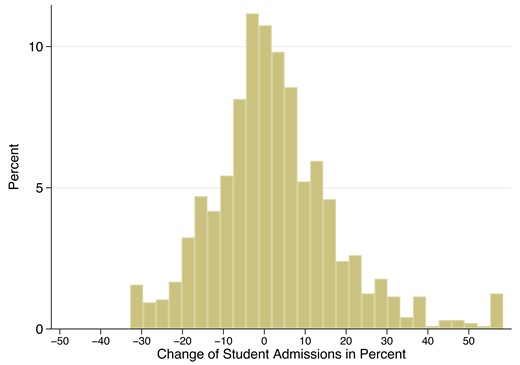
Year-to-year changes in academic high school admissions Notes: This figure shows the variation in yearly changes of school-level academic high school admissions for public schools in Switzerland between 2013 and 2020. The yearly change is calculated through the following formula: (number of students in year t − number of students in year t − 1)/(number of students in year t − 1) * 100. Values smaller than the 1st percentile and larger than the 99th percentile are trimmed to the 1st and 99th percentiles. Data are provided by the Swiss Statistical office (LABB, 2022).
While the ultimate general equilibrium effects for tracking remain somewhat ambiguous, the reduction in ADHD symptoms, improvements in classroom behaviour, and enhancement of other socio-emotional skills represent important treatment effects. These changes benefit students, parents, and teachers, regardless of whether they lead students to a more prestigious secondary school track.33
11. CONCLUSION
This paper provides experimental evidence that fostering socio-emotional skills in primary school children has persistent positive effects on educational careers. We provide evidence on the PATHS programme, a teacher-run intervention that lasts for up to two years in primary school. The intervention increases the probability of completing academic high school and enroling or graduating from university seventeen years after the intervention.
Our results on underlying mechanisms suggest that the PATHS treatment effect is mainly driven by changes in some of the socio-emotional skills targeted by the intervention. Treated children become less impulsive, less disruptive, and display less opposition to teachers and parents. In class, treated children become less likely to disturb lessons and more likely to focus on the teaching content. Although we find suggestive evidence that treated children have better grades, we find no evidence that standardized test scores are affected by the intervention. Long-term effects thus seem more likely to operate through changes in socio-emotional skills rather than cognitive skills.
Taken together, the results of this study raise an interesting and policy-relevant question. Would it be possible to teach children socio-emotional skills with a subject that is explicitly dedicated to it, similar to the way math and reading are taught? While it has been shown that teachers have lasting impacts on behaviour (Chetty et al., 2011; Jackson, 2018), there is no school subject explicitly designed to foster socio-emotional skills. The results of this study suggest that primary schools are a promising place to institutionalize socio-emotional skills training.
Acknowledgments
We thank the editor Katrine V. Løken and four anonymous referees for their guidance and suggestions. We also thank Caroline Chuard, Jan Feld, Mark T. Greenberg, Jonathan Guryan, James Heckman, Rahel Jünger, Nicolás Salamanca, and Ursina Schaede for helpful discussions and comments. Matthew Bonci, Maximilian Mähr, Albert Thieme, and Jeffrey Yusof provided outstanding research assistance. We gratefully acknowledge financial support from the Swiss National Science Foundation (Grants 405240-69025, 100013_116829, 100014_132124, 100014_149979, 100014_149979, 10FI14_170409, 10FI14_198052), the Jacobs Foundation (Grants 2010-888, 2013-1081-1), the Jacobs Center for Productive Youth Development, the Swiss Federal Office of Public Health (Grants 2.001391, 8.000665), the Canton of Zurich's Department of Education, the Swiss Federal Commission on Migration (Grants 03-901 (IMES), E-05-1076), the Julius Baer Foundation, and the Visana Foundation.
Manuel Eisner and Denis Ribeaud designed the z-proso RCT study, organized all data collection, and provided feedback on the manuscript. Giuseppe Sorrenti and Ulf Zölitz analysed the data, collected additional data, and prepared the manuscript. The author order of Sorrenti and Zölitz has been randomized following Ray
Supplementary Data
Supplementary data are available at Review of Economic Studies online.
Data Availability Statement
The data and code underlying this research are available on Zenodo at https://doi.org/10.5281/zenodo.10797136
REFERENCES
Footnotes
See Eisner et al. (2012a), Malti et al. (2012b), and Averdijk et al. (2016) for a more detailed description of the implementation.
Ability tracking into secondary school represents a key educational transition in Switzerland. Over 62% of Organisation for Economic Co-operation and Development (OECD) countries use a similar school-based tracking system (OECD, 2004). Academic high school (Gymnasium) is the highest secondary school track in Switzerland. Enrolment in university requires a degree from an academic high school. Tracking is not a choice outcome of parents or children and is not determined by subjective teacher recommendations. Tracking is determined by (1) grades in core subjects in the last grade of primary school and (2) standardized externally evaluated admission test scores.
Section 9.2 summarizes related intervention studies.
With 1,675 individuals, we have more statistical power than the Abecedarian programme (n = 111), the Perry Preschool Program (n = 123), the Jamaican Study (n = 129), or the Montreal Longitudinal Study (n = 250), which are underpowered.
Appendix Table A1 provides an overview of previous PATHS evaluations.
Appendix Figures C1–C4 show teaching material examples related to core activities shown in Table C1.
In most cases, the primary caregiver is the child's biological parent. Throughout the paper, we use the terms primary caregiver and parents interchangeably.
Children in the lower track attend one of three secondary high schools called Sekundarschule level A, B, and C. These schools prepare students for vocational education and apprenticeship trainings. Level A leads to white-collar jobs, and levels B and C lead to blue-collar jobs. Students in all three lower tracks attend school for three years and are typically fifteen or sixteen years old upon completion.
Appendix Table A2 shows that students’ school changes between Grade 1 and 2 are unrelated to their treatment status.
The z-proso study aims to track individuals even after they moved out of the canton or leave the country, and it has a remarkably low attrition rate. At age 24, we observe self-reported education outcomes for almost 70% of the original sample (n = 1,675).
The proportion of students in academic high school increases over time due to students’ switching to Gymnasium from lower tracks during different stages of secondary school.
Over 70% of schools assigned to the treatment group implemented PATHS for two years. In Appendix Section E, we test for dosage effects of the intervention. Although this analysis does not allow for a causal interpretation of the results, we find some suggestive evidence that children benefit more if they are exposed to the treatment for a longer time. In Appendix Section F, we investigate whether the treatment effect creates a potential mismatch between students and high schools. We find no evidence that marginal students who got pushed into academic high school by the treatment perform relatively worse in the more challenging school track. Also, grade retention seems unaffected by the intervention. We create an indicator variable for grade retention equal to one if the student's actual grade is lower than the age-based expected grade. According to the results in Table A3, there is no evidence that the PATHS intervention has any impact on grade retention.
As we test multiple hypotheses by looking at different educational outcomes over time, we also estimate treatment effects using: (1) an aggregate index for the educational success of children through ages 13, 15, 17, 20, and 24 as a dependent variable and (2) a pooled regression. For the construction of this education index, we follow Anderson (2008). Table A4 shows that our overall conclusions on PATHS effectiveness on children's educational outcomes are the same.
Table A5 in the Appendix also investigates whether the treatment affects labour market outcomes at age 24—the latest available data wave. When examining the labour market outcomes at age 24, we do not observe any significant treatment effects on working full-time or part-time. However, we observe a negative effect on net wages, which is likely explained by the impact of the intervention on participation in higher education. At age 24, it seems to be too early to quantify the intervention impacts on earnings. Given the content of the PATHS intervention, we have also estimated treatment effects for crime-related outcomes. Appendix Tables G1 and G2 show that we find no evidence of effects of PATHS on administrative and self-reported crime outcomes.
We test whether treated children are more likely to have non-missing control variables in Panel B of Table A6. We regress an indicator taking the value of one if no control variables are missing on the treatment status. The analysis shows that the treatment and control groups do not differ in their probability of having missing control variables.
Table A7 shows that father's education, along with family income, represents the main determinant of children's likelihood of attending and completing academic high school, as well as their probability of enrolling in or graduating from university. The coefficient for father's completion of academic high school consistently shows a positive, sizeable, and statistically significant effect. Furthermore, the point estimate for father's education is notably larger than that for maternal education. The adjusted R2 highlights the importance of father's education in shaping children's educational outcomes. When controlling for variables such as maternal education, demographics, and other family characteristics, such as family income, the adjusted R2 increases only marginally compared to the R2 in the bivariate regression that includes only father's completion of academic high school as an explanatory variable.
A potential additional concern regarding our main analysis, based on the full sample, is that there might be other unobserved variables related to fathers’ education that could also be unbalanced. The results from our permutation exercise suggest that there is limited scope for bias arising from such unobservables. After creating a balanced sample with respect to fathers’ education, we can expect the unobservable characteristics related to fathers’ education to be balanced within this subsample.
Data are missing at ages 13, 15, and 17 when individuals move out of the canton of Zurich and refuse to participate in the survey. Outcomes for academic high school completion and university enrolment or graduation are based on self-reported information and are only available for those individuals participating in survey waves 8 and 9.
Although we do not find any evidence of selective attrition, we also replicate our main results following Wooldridge’s (2007) inverse probability weighting in Appendix Table A9. We first model attrition for each outcome variable as a function of the initial assignment to a specific treatment condition and the full set of control variables used in the baseline analysis. Then, we predict individual attrition probabilities. In the estimation, we then weight each observation with the inverse of this probability to account for the probability of being observed in a specific administrative register or survey wave of the data collection. Appendix Table A9 shows that all main results remain similar when using inverse probability weighting.
Appendix Figure A2 and Table A10 complement the analysis of possible mechanisms by providing a descriptive overview of the specific activities conducted as part of the PATHS programme. We look at the coverage of activities related to six key modules: problems-solving, self-control, feelings, rules, self-esteem, and friendship. Figure A2 shows significant variation in the extent to which these different modules were covered. While the coverage of each module is likely endogenous, we nonetheless provide a descriptive analysis of how treatment effects may differ based on module coverage. Table A10 presents estimates of the interaction effect between the treatment and indicators that determine whether the coverage of different modules was above or below the median. The evidence remains suggestive but indicates somewhat larger treatment effects for classes that allocated more time to the modules focused on self-control and self-esteem.
Participation in the academic high school admission test is voluntary and there is some suggestive evidence that the treatment increases children's probability of taking the test (see Table A11 in the Appendix). To account for the fact that we only observe a subsample of children, we reweight our observations in Figure 6 using inverse probability weighting.
Grades are likely determined on a curve within schools and might therefore not be comparable across schools. Given that all students within a school have the same treatment status, any within-school curving would lead to an underestimation of treatment effects on (uncurved) grades.
Borghans et al. (2016) study the predictive power of socio-emotional skills for grades and achievement test scores and show that grades are more influenced by students’ personality traits and socio-emotional skills than achievement tests.
Appendix Table B2 provides an overview of the items used in the SBQ that constitute the six different SBQ domains. Answers are recorded on a 5-point Likert scale ranging from 1 “never” to 5 “very often”.
Appendix Figure A3 shows that splitting the analysis based on who—teachers or parents—reports on skills does not meaningfully alter our conclusion and that treatment effects do not seem to systematically differ based on who reports on socio-emotional skills. Although we observe parental responses only in two waves, they report similar changes in socio-emotional skills as teachers.
Figure A4 in the Appendix reports separate effects for disruptiveness (Panel a) and impulsiveness (Panel b). The figure shows that the overall picture is similar for both traits, but perhaps more pronounced for disruptiveness.
Parenting styles and practices may shape child preferences and behaviour with effects on children's education performance and choices (Doepke and Zilibotti, 2017; Doepke et al., 2019).
Appendix Table B4 provides an overview on the survey items used to measure parenting practices. Items remain the same across surveys conducted in different years.
Note that the underlying assumptions and the interpretation of this super-index are not trivial. The index rests on the strong assumption that standardized measures for ADHD symptoms and non-aggressive conduct behaviour can be aggregated in a linear additive fashion.
The note of Figure 11 explains the technical details underlying the mediation analysis.
Heckman and Karapakula (2019a, 2019b) follow up on these results and highlight positive long-term effects on cognitive skills, employment, health, and reduced crime, as well as positive intergenerational spillovers.
For this exercise, we use the administrative data from the Swiss Statistical office (LABB, 2022).
Regarding externalities, it is important to note that the PATHS intervention replaced the subject “Humans and Environment” (Mensch und Umwelt). This substitution could potentially have unintended consequences, such as treated children developing different political preferences due to a lack of knowledge of some aspects of the Swiss society. We test for this type of externality using survey data on political preferences reported on a left-right spectrum. Appendix Table A12 shows that there is no treatment effect of the intervention on political preferences. Replacing the subject “Humans and Environment” did not lead to unintended consequences for voting behaviour.
Author notes
The editor in charge of this paper was Katrine Løken.
