


Abstract
The purpose of this study was to investigate the effectiveness of fluoroscopy-guided manual lymph drainage (MLD) versus that of traditional and placebo MLD, when added to decongestive lymphatic therapy (DLT) for the treatment of breast cancer–related lymphedema (BCRL) (EFforT-BCRL trial), on the suprafascial accumulation of lymphatic fluid and skin elasticity.
In this multicenter, 3-arm, double-blind, randomized controlled trial (EFforT-BCRL trial), 194 participants (mean age = 61 [SD = 10] years) with unilateral BCRL were recruited. All participants received standardized DLT (education, skin care, compression therapy, exercises) and were randomized to fluoroscopy-guided, traditional, or placebo MLD. Participants received 60 min/d of treatment during the 3-week intensive phase and 18 sessions of 30 minutes during the 6-month maintenance phase. During this phase, participants were instructed to wear a compression garment, to perform exercises, and to perform a self-MLD procedure once daily. This study comprises secondary analyses of the EFforT-BCRL trial. Outcomes were the amount of fluid accumulation in the suprafascial tissues (local tissue water, extracellular fluid, and thickness of the skin and subcutaneous tissue) and skin elasticity at the level of the arm and trunk. Measurements were performed at baseline; after intensive treatment; after 1, 3, and 6 months of maintenance treatment; and after 6 months of follow-up.
At the level of the arm, there was a significant improvement over time in the 3 groups for most of the outcomes. At the level of the trunk, no remarkable improvement was noted within the individual groups. No significant interaction effects (between-group differences) were present. Only skin elasticity at the level of the arm, evaluated through palpation, showed a significant interaction effect.
All 3 groups showed similar improvements in response to DLT regardless of the type of MLD that was added. The effect of the addition of MLD to other components of DLT for reducing local tissue water and extracellular fluid or skin thickness and for improving skin elasticity and fibrosis in participants with chronic BCRL was limited.
Although MLD has been applied all over the world for many years, evidence regarding its added value in reducing arm volume in patients with BCRL is lacking. These results show that adding MLD to other components of DLT has limited value in reducing local tissue water and extracellular fluid or skin thickness and in improving skin elasticity and fibrosis in patients with chronic BCRL. To date, there is no clinical indication to continue including time-consuming MLD in physical therapist sessions for patients with chronic BCRL.
Introduction
Worldwide, breast cancer is diagnosed in 2.3 million women each year and is therefore the most common cancer in women.1 Improved treatment strategies have resulted in increased survival rates.2 Consequently, more and more survivors are confronted with the impact of treatment-related problems, including breast cancer–related lymphedema (BCRL). More than 16% of these patients develop BCRL.3 According to the recommendations of the International Society of Lymphology, lymphedema needs to be treated with decongestive lymphatic therapy (DLT) consisting of a 2-phase treatment.4 During the intensive phase, lymphedema is maximally reduced. This phase consists of skin care, manual lymph drainage (MLD), multilayer bandaging, and exercise therapy (under compression). The second or maintenance phase aims to conserve and optimize the results obtained in the first phase. It consists of skin care and education regarding self-management, a compression sleeve, exercises, and MLD. Although it has been applied all over the world for many years (since 1930), a meta-analysis/Cochrane systematic review including 6 randomized controlled trials (RCTs) could not demonstrate an added value of MLD (further called “traditional MLD” throughout this paper) beside the other components of DLT in reducing arm volume.5,6 Four additional RCTs that have been published were also unable to demonstrate an added effect of traditional MLD in reducing lymphedema volume in patients with BCRL.7–10
A decade ago, it was shown that near-infrared fluorescence imaging or lymphofluoroscopy can be used to map the regions with dermal rerouting and the superficial remaining collecting vessels. This way, MLD can be tailored to the individual patient, possibly improving its effect. In addition, by altering the MLD techniques by performing a resorption technique with the thumb instead of the whole hand and by gliding with the hand over the skin instead of using pumping techniques to stimulate the lymphatic transport, the resorption and transport through the lymph collectors and regions with dermal rerouting are improved.11 Applying the combination of these adapted maneuvers on the patient-specific lymphatic system is hypothesized to be an optimized method of MLD to improve the clinical situation of the patient and is called “fluoroscopy-guided MLD” throughout the paper.
Recently, primary analyses of the EFforT-BCRL trial showed that neither fluoroscopy-guided MLD nor traditional MLD had an additional effect on arm/hand volume reduction, reduction in local tissue water at the level of the shoulder/trunk, improvement in amount of lymphedema-related problems in functioning, or overall quality of life compared with placebo MLD, and in addition to other components of DLT.12 Consequently, these findings are in line with previous systematic reviews reporting that the added effects of traditional MLD on volume reduction were limited to 75 mL5 and 7%6 (P > .05).
Previous studies merely focused on change in lymphedema volume as an outcome measure to investigate the merit of MLD. Although worldwide considered as the gold standard in evaluating lymphedema, volume measures are not capable of distinguishing between total limb volume and suprafascial lymph volume or of describing the tissue composition of affected limbs.13 Volume measures represent an indirect measurement of the entire limb by taking into account both the supra- and subfascial tissues (including muscle tissue, bones, fat). To date, plenty of methods are available that objectively quantify the accumulation of fluid in only the suprafascial tissues in a direct manner: the amount of local tissue water can be measured in a reliable way14 using a MoistureMeterD Compact device (Delfin Technologies, Kuopio, Finland), which can represent the percentage of water content at any particular site of the body. Another direct indicator of the accumulation of tissue water is the amount of extracellular fluid in the limb by means of bioimpedance measurements such as bioimpedance spectroscopy (Impedimed Limited, Pinkenba, Queensland, Australia). This method has been shown to be capable of monitoring changes in the extracellular fluid with greater sensitivity than indirect measurements such as circumference measurements.15–17 Additionally, because thickening of the cutis and subcutis is associated with the development of lymphedema, the accumulation of fluid in terms of thickness of the skin and subcutaneous tissue can be evaluated through palpation by performing a pinch test and comparing the skin fold thickness with that of the nonaffected side.18 More objectively, the thickness of the cutis and subcutis can be directly measured using ultrasonography.19
Additionally, besides direct quantifications of fluid accumulation in the suprafascial tissues, it is of utmost importance to also evaluate the impact of lymphedema on skin characteristics such as skin elasticity and fibrosis. As the edema progresses, the skin and subcutaneous tissue gradually harden and become fibrosclerotic because of the high protein concentration and repeated infections and inflammatory responses.20 This can hinder limb movements or induce subjective problems such as feelings of hardness and heaviness of the skin.20 In clinical practice, skin elasticity and presence of fibrosis can be subjectively evaluated by means of palpation. Alternatively, the SkinFibroMeter (Delfin Technologies) is a portable device that can be used to objectively measure skin elasticity or skin stiffness (which in turn reflects the presence and severity of skin fibrosis) in terms of short-term resistance of the skin to an external force applied by the instrument.21
Because little is known about the possible merit of MLD on outcome parameters other than change in arm volume, further research is highly warranted. Therefore, the aim of the present trial was to investigate the effectiveness of a hypothesized optimized MLD method (ie, fluoroscopy-guided MLD) versus traditional MLD and placebo MLD, added to DLT, for the treatment of BCRL on the accumulation of fluid in only the suprafascial tissues (in terms of the changes in amount of local tissue water, extracellular fluid, and thickness of the skin and subcutaneous tissue) as well as on skin elasticity and fibrosis (in terms of change in skin elasticity).
Methods
Study Design and Setting
The EFforT-BCRL trial is a multicenter, double-blind RCT. The design of the RCT is described in detail elsewhere.22 Briefly, participants received an intensive treatment during 3 weeks, followed by a maintenance treatment for 6 months. Additional follow-up of another 6 months was established. All participants received a standardized DLT treatment consisting of education, skin care, compression therapy, and exercises. Only MLD differed among the 3 equally allocated groups: the intervention group received fluoroscopy-guided MLD, the first control group received traditional MLD, and the second control group received placebo MLD. Participants were assessed before the start of the trial, after 3 weeks of intensive treatment; after 1, 3, and 6 months of maintenance treatment; and after 6 months of follow-up. Primary outcomes of this trial related to the arm volume and accumulation of lymph at the level of the trunk, and a set of secondary outcomes related to quality of life were presented elsewhere.12
Participants were recruited in 5 hospitals in Belgium: the University Hospitals of Leuven (UH Leuven), Antwerp University Hospital (UH Antwerp), Saint-Pierre University Hospital in Brussels (UH Saint-Pierre), Ghent University Hospital (Ghent UH), and General Hospital of Groeninge (GH Groeninge) in Kortrijk.
This trial had been approved by the Ethical Committees of all participating centers (CME reference number S58689, EudraCT Number 2015–004822-33). The trial has been registered in clinicaltrials.gov (NCT02609724). The paper used the recommended Consolidated Standards of Reporting Trials (CONSORT) guideline to report on the following items.23
Participants
Participants were recruited between February 2016 and September 2019. Eligibility criteria for the EFforT-BCRL trial were as follows: patients with unilateral lymphedema of the arm and/or hand developed after treatment for breast cancer; chronic lymphedema stages I to IIb (duration of >3 months); at least 5% difference between both arms (= excessive volume) adjusted for limb dominance and/or between both hands; and no active metastases at the time of inclusion. Patients were excluded when 1 of the following criteria was present: aged <18 years; edema of the upper limb from a cause other than breast cancer treatment; inability to participate during the entire study period; mental or physical inability to participate in the study; allergy to indocyanine green, iodine, or sodium iodide; increased activity of the thyroid gland or benign tumors of the thyroid gland; lymph node transplantation or lymphovenous shunt in the past; and bilateral axillary lymph node dissection.
Only individuals who signed the informed consent document prior to the start of the study were included.
Intervention
All participants received a standard DLT consisting of skin care, compression therapy (multilayer bandaging followed by a compression sleeve and hand glove), exercises under compression, and education regarding self-management.4 The only treatment modality that differed among the 3 groups was the application of MLD. During the maintenance treatment phase, patients wore their compression garment during daytime (sleeve and glove) and performed their exercises under compression twice per day at home. Patients were instructed to perform daily self-MLD, except on the days when treatment was provided by the therapist. For all details regarding the treatment and the different treatment modalities, we refer to the publication of the trial’s protocol.22
All treatments were provided by 5 different physical therapists: R.V.H., L.B., L.V., and A.-K.H. in UH Leuven; L.V. and T.D.V. in UH Saint-Pierre, GH Groeninge and Ghent University Hospital; and T.D.V. in UH Antwerp. All physical therapists were experts in edema therapy. Per patient, the same therapist provided DLT as well as MLD. To limit any subjective influences of the therapist, a standardized treatment protocol had been developed after consensus with our expert panel. To familiarize the therapists with this protocol and ensure that the treatments given by each therapist were identical, multiple training sessions were performed prior to the start of and during the trial.
Assessments
All participants received a standardized lymphofluoroscopic assessment at baseline (B0), after intensive treatment (P), and after a maintenance phase (P6). The baseline lymphofluoroscopy was used to determine the tailored procedure of MLD (ie, which hand maneuvers at which location11) in the group receiving fluoroscopy-guided MLD. Clinical assessments were performed at baseline (B0); after intensive treatment (P); after 1 (P1), 3 (P3), and 6 (P6) months of maintenance treatment; and after 6 months follow-up (P12). During the intensive and maintenance treatment phases, adherence to the self-management protocol was captured through a diary. For a detailed description regarding the fluoroscopic and different clinical assessments, see the protocol of the EFforT-BCRL trial.22
All lymphofluoroscopic assessments were performed by 3 doctors (S.T., L.V., and C.M.) assisted by physical therapists (N.D., N.G., K.D., and S.V.). Clinical assessments were performed by 4 assessors (T.D.V., L.V., K.D., and S.V.). Participants were evaluated by the same assessor per center. All of them were trained and experienced in performing these assessments.
Outcome Measures
Patient-related data were collected to describe the baseline characteristics of our participant population. Body height and weight; pitting at the level of hand, of ventral and dorsal lower and upper arm, at elbow, shoulder, trunk, and breast (with 0 = no, 1 = doubt, and 2 = clear); and lymphedema stage were obtained through evaluation. Duration of lymphedema was collected though interview. Information related to the age of the patient and the breast cancer and its treatment was searched in the medical file of the participant.
Details of the outcome measures, their measurement methods, and procedures are presented in Table 1. The outcome measures covered in this paper for evaluating the accumulation of fluid in the suprafascial tissues involve the amount of local tissue water in the skin measured by the MoistureMeterD Compact device,14 the amount of extracellular fluid measured using bioimpedance spectroscopy,17,24 the skin thickness (cutis and subcutis) assessed using ultrasound,19 and by using a clinical palpation test (pinch test).
Overview of Measurement Methods and Proceduresa
| Parameter Evaluated | Outcome | Measurement Method | Procedure | |
|---|---|---|---|---|
| Accumulation of fluid in suprafascial tissues | 1 | Local tissue water in arm and trunk (interlimb ratio of PWC) | Measurement of PWC25Material:MoistureMeterD Compact26–28 Reference points: see Fig. 1Method: If skin recently hydrated, it should be dehydrated Sensor placed perpendicular to reference points on skin surface on reference points with pressure indicated by device Highly electromagnetic wave only absorbed by water sent through skin Degree of reflection (ie, PWC) read on display of MoistureMeterD Compact device | Relative excessive local tissue water (interlimb ratio PWC) = PWC on affected side/PWC on healthy sideArm: from reference points 1–3, 5–7 (Fig. 1), mean ratio PWC is calculatedTrunk: from reference points 4, 8, and 9 (Fig. 1), mean ratio PWC is calculatedChange in excessive local tissue water at level of arm/trunk = comparison of mean interlimb ratio PWC of arm/trunk time 1 and mean interlimb ratio PWC of arm/trunk time 2 |
| 2 | Extracellular fluid in upper limb (L-Dex score) | BIS24,25,29Material: ImpediMed L-Dex U400Reference points: One double electrode placed on dorsum of each hand One double electrode placed on dorsum of each footMethod: Patient in lying position with arms and legs spread Measurements generated by low-frequency electrical signal transmitted to patient (3–1000-kHz frequency) Patient’s sex, side at risk, and dominant side are entered into L-Dex software; according to this information, patient-specific instructions concerning attachment of color-coded leads are provided by software program One measurement at each side obtained to calculate 1 L-Dex score | Amount of extracellular fluid represented by L-Dex scoreThis outcome calculated and displayed on BIS device and represents difference in amount of extracellular fluid in affected upper limb and that in unaffected upper limbChange in extracellular fluid at level of upper limb = comparison of L-Dex time 1 and L-Dex time 2 | |
| 3 | Thickness of cutis and subcutis of arm and trunk (interlimb ratio of thickness [in mm] and dichotomous outcome pinch test) | Measurement of thickness of cutis and subcutis19 1. Measurement of thickness of skin and subcutaneous tissue usingultrasound Material: SonoScape S8 portable ultrasound device Reference points: see Fig. 1 Method: Patient seated according to which reference point being evaluated (Fig. 1) High-frequency linear probe (10–5 MHz) used Probe placed perpendicular to skin; reference point in middle of probe Minimal amount of pressure should be given Thicknesses of cutis and subcutis determined in mm Images of every reference point and its indicated thicknesses at both sides are saved using patient-specific code 2. Measurement of skinfold thickness using pinch test Material: None Reference points: see Fig. 1 Method: Patient seated according to which reference point being evaluated (Fig. 1) In this clinical test, ability to lift skin and subcutaneous tissue is measured, and skinfold thickness of affected limb compared with skinfold thickness of nonaffected limb | Analyses for changes in thicknesses of cutis, subcutis, and cutis + subcutis performed as follows:
1. Relative excessive thickness of cutis (interlimb ratio of cutis [in mm]) = thickness of cutis (mm) on affected side/thickness of cutis (mm) on healthy side Arm: from reference points 1–3, 5–7 (Fig. 1), mean ratio thickness of cutis calculated Trunk: from reference points 4, 8, and 9 (Fig. 1), mean ratio thickness of cutis calculated 2. Relative excessive thickness of subcutis (interlimb ratio of cutis [in mm]) = thickness of subcutis (mm) on affected side/thickness of subcutis (mm) on healthy side Arm: from reference points 1–3 5–7 (Fig. 1), mean ratio thickness of cutis calculated Trunk: from reference points 4, 8, and 9 (Fig. 1), mean ratio thickness of subcutis calculated 3. Relative excessive thickness of cutis + subcutis (interlimb ratio of cutis + subcutis [in mm]) = thickness of cutis + subcutis (mm) on affected side/thickness of cutis + subcutis (mm) on healthy side Arm: from reference points 1–3, 5–7 (Fig. 1), mean ratio thickness of cutis + subcutis calculated Trunk: from reference points 4, 8, and 9 (Fig. 1), mean ratio thickness of cutis + subcutis calculated Change in excessive thickness of cutis, subcutis, and cutis + subcutis at level of arm/trunk = comparison of mean interlimb ratio thickness at level of arm/trunk of cutis, subcutis, and cutis + subcutis at time 1 and mean interlimb ratio thickness at level of arm/trunk of cutis, subcutis, and cutis + subcutis at time 2 In total, 9 reference points (Fig. 1) were evaluated and scored (0 or 1) Reference point was scored with 1 in case skinfold thickness on affected side was higher than that of reference point on nonaffected side Final outcome for arm score was (cumulative) total score of 6 reference points (1–3, 5–7; range = 0–6) outcome for trunk score was (cumulative) total score of 3 reference points (4, 8, and 9; range = 0–3) Change in increased skinfold thickness at level of arm/trunk = comparison of pinch test arm/trunk score at time 1 and pinch test arm/trunk score at time 2 | |
| Skin elasticity | 4 | Elasticity of skin and subcutaneous tissue of arm and trunk (interlimb ratio of Newton value and dichotomous outcome palpation test) | 1. Measurement of induration (elasticity) of skin and subcutaneous tissue21 Material: SkinFibroMeter Device consists of 1-mm-long indenter and records resistance to 50-g pressure using its reference plate and related built-in force sensors Reference points: see Fig. 1 Method: First, gray button pressed to activate device; if display shows “ready,” measurement can start Sensor placed perpendicular on 1 of 9 indicated reference points marked on skin; to obtain maximal skin contact, light vertical pressure applied; device immediately gives feedback about pressure and velocity Each measurement repeated 5 times at each reference point Skin and subcutis resist deformation and induration, and induration force in newtons determined by calculating average resistance of 5 measurements Lower value indicates less resistance or softer tissue 2. Evaluation of hardness (fibrosis) of skin through palpation Material: none Reference points: see Fig. 1 Method: Patient seated according to which reference point being evaluated (see Fig. 1) In this clinical test, presence of skin fibrosis at different reference points evaluated through palpation (and scored as “yes” or “no”) | 1. Relative difference in skin elasticity (induration force interlimb ratio) = skin elasticity on affected side/skin elasticity on healthy side Arm: For reference points 1–3, 5–7 (Fig. 1) mean induration ratio calculated Trunk: For reference points 4, 8, and 9 (Fig. 1), mean induration ratio calculated Change in difference in skin elasticity at level of arm/trunk = comparison of mean interlimb arm/trunk ratio induration force at time 1 and mean interlimb arm/trunk ratio induration force at time 2.2. In total, 9 reference points (Fig. 1) evaluated and scored (0 or 1) Reference point scored with 1 in case fibrosis of skin present Final outcome for arm score was (cumulative) total score of 6 reference points (1–3, 5–7; range = 0–6) Final outcome for trunk score was (cumulative) total score of 3 reference points (4, 8, and 9; range = 0–3) Change in fibrosis at level of arm/trunk = comparison of fibrosis in arm/trunk score at time 1 and fibrosis in arm/trunk score at time 2 |
aBIS = bioimpedance spectroscopy; PWC = % water content.
Skin elasticity was evaluated through palpation and was also measured using the SkinFibroMeter.21 Measurements occurred at 9 reference points along the upper limb and trunk (Tab. 1; Fig. 1).
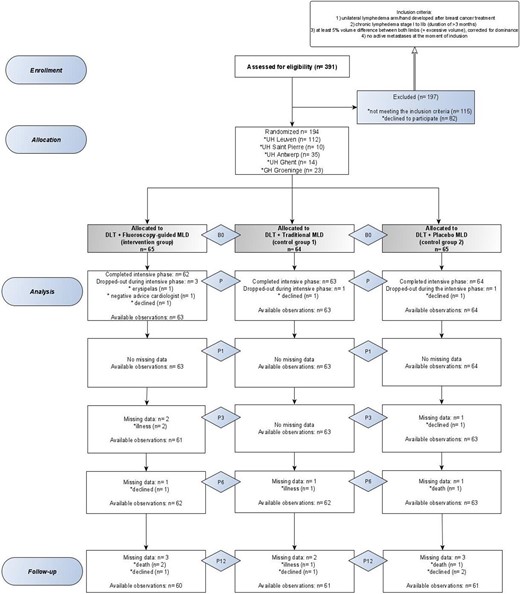
Flow chart of the EFforT-BCRL trial according to CONSORT 2010 flow diagram guidelines.30 B0 = baseline assessment; MLD = manual lymph drainage; P = after intensive assessment; P1 = 1 month after intensive assessment; P3 = 3 months after intensive assessment; P6 = 6 months after intensive assessment (= end of maintenance phase); P12 = 12 months after intensive phase (= after 6 months of follow-up).
The application of compression therapy (ie, bandaging during the intensive treatment phase and wearing a compression sleeve and glove during the maintenance treatment phase) only at the level of the arm and hand might induce fluid accumulation at the level of the shoulder and trunk. Therefore, because we are interested in the clinical merit of MLD in (eg) fluid retention due to its stimulating effect on lymphatic fluid, we investigated the additional effect of MLD on the different outcome parameters at the level of the arm and trunk separately.
Consequently, with the exception of the change in extracellular fluid (represented by an L-Dex score for the entire upper limb; an L-Dex score represents the difference in the amount of extracellular fluid in an at-risk limb vs an unaffected limb), the analyses for all other outcomes were performed for the arm (including 6 reference points at the hand and lower and upper arms) and trunk (including 3 reference points at the shoulder, trunk, and breast) separately.
Hypotheses
Patients receiving fluoroscopy-guided MLD in addition to DLT will have a significantly greater reduction in the amount of local tissue water, a significantly greater reduction in the amount of extracellular fluid, a significantly greater reduction in skin thickness (cutis and subcutis), and a significantly greater improvement in skin elasticity than patients receiving traditional MLD or placebo MLD at P and P1, P3, P6, and P12.
Sample Size Calculation
A sample size calculation had been performed for the primary outcome measures of the EFforT-BCRL trial: on the basis of an alpha of .0125 and a power of 80%, the required sample size for the study was 201 participants or 67 participants per group (taking into account potential dropouts) to detect a difference of 15% in the reduction of lymphedema volume at the level of the arm or hand or at the level of the shoulder or trunk (primary outcomes) between the 3 groups.22 On the basis of a previous longitudinal study with breast cancer patients,31 a dropout rate of 5% was estimated (or 9 patients). However, no sample size calculation occurred for the outcome parameters analyzed in the present study, because the these are secondary outcome measures of the EFforT-BCRL trial.
Randomization and Allocation Sequence Generation
All participants were allocated to 1 of the 3 groups. The random allocation sequence was computer generated. Randomization was performed by using 6-size permuted blocks based on type of MLD. The allocation to the groups was concealed and performed by an independent physical therapist (A.D.G.). The sequence of randomization was determined by the participant’s identification number, which they received after inclusion in the study.
Masking
All participants were masked for the allocation to 1 of the 3 MLD groups. Furthermore, all assessments were performed by investigators who were masked for the allocation of the patients to the treatment groups. The therapists were masked for participants’ data but were aware of the treatments provided to the 3 different groups.
Statistical Methodology
Baseline participant characteristics were reported descriptively.
Analyses for change in amount of local tissue water by means of percentage of water content interlimb arm/trunk ratios, change in thickness of the skin and subcutaneous tissue by means of ultrasound interlimb arm/trunk ratios, and change in skin elasticity by means of the induration force interlimb arm/trunk ratios were performed on log-transformed ratios and not on (excess) percentages (reflected by the untransformed ratios). Analyses for change in amount of extracellular fluid by means of L-Dex scores and change in skin thickness and skin elasticity by means of palpation arm/trunk outcome scores were performed on raw outcomes without performing a log transformation.
For all secondary outcome analyses, a multivariate linear model for longitudinal measures was used to compare the evolution of the log-transformed ratios or the raw outcomes between the 3 groups. An unstructured covariance matrix was used for the 6 × 6 covariance matrix of the repeated measures over time (B0, P, P1, P3, P6, and P12), except for the change in thickness of the skin and subcutaneous tissue measured by ultrasound, for which a 4 × 4 covariance matrix of repeated measures was used (B0, P, P6, and P12). Because of a right-skewed distribution of the model residuals, the outcome representing skin elasticity by means of palpation was log transformed after adding a constant value.
Changes versus baseline were calculated at each time point and compared between the 3 groups. P values for the overall interaction (group × time) effect are presented. Given that a likelihood procedure was used, participants with incomplete outcome information were also included in the analysis. Results for the edema/normal log-transformed ratios were back transformed to the original scale (ratio) with a 95% CI. The alpha level was set at 5%. No corrections for multiple testing were considered for the secondary outcomes; hence, a single significant P value should be interpreted with caution.
All analyses have been performed using IBM SPSS Statistics software, version 27 for Windows (IBM SPSS, Chicago, IL, USA).
Role of the Funding Source
The funding source had no role in study design, data collection, data analysis, data interpretation, or writing of the report.
Results
Flow of Participants and Participant Characteristics
The flow of participants during the trial is presented in Figure 2. Of the 391 screened patients, 194 were included after giving written consent. The mean age was 61 (SD = 10) years, and the mean absolute and relative excessive arm volumes at baseline were 521.5 mL and 24.66%, respectively (Tab. 2).
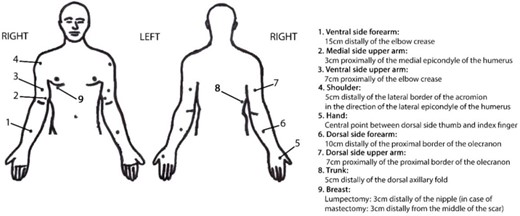
Reference points. Those included in the arm scores were 1, 2, 3, 5, 6, and 7; those included in the trunk scores were 4, 8, and 9. For reference points 1 to 3, the 2 measurement positions were as follows: first, the sitting position with the forearm partly supported on the table; and second, the elbow slightly flexed, supination of the forearm, and the arm slightly abducted. For reference points 4 to 7, the 3 measurement positions were as follows: first, the sitting position with the forearm partly supported on the table; second, pronation of the forearm; and third, the fingers slightly abducted. For reference point 8, the measurement position was the standing position, with the arms relaxed beside the body. For reference point 9, the measurement position was the supine position.
Characteristics of the Included Participantsa
| Variable | Fluoroscopy-Guided MLD Group (n = 65) | Traditional MLD Group (n = 64) | Placebo MLD Group (n = 65) | Total (N = 194) |
|---|---|---|---|---|
| Body mass index, kg/m2b | 27.6 (5.3) | 28.8 (5.6) | 27.8 (6.1) | 28.1 (5.7) |
| Age at baseline measurement, yb | 60.3 (10.8) | 61.8 (9.5) | 61.1 (9.0) | 61.1 (9.8) |
| Duration of lymphedema, moc | 29 (49) | 28 (73) | 16 (50) | 24 (58) |
| Absolute excessive lymphedema arm volume, mLc | 456.7 (390.5) | 441.8 (464.4) | 430.0 (510.8) | 441.0 (442.3) |
| Relative excessive lymphedema arm volume, %c | 22.8 (24.2) | 21.9 (20.5) | 21.0 (18.9) | 21.7 (19.9) |
| Total pitting score,d out of 18, at baselinec | 5 (4) | 5 (5) | 4 (6) | 5 (5) |
| Patient enrollmente | ||||
| UH of Leuven | 39 (60) | 36 (56.3) | 37 (56.9) | 112 (57.7) |
| UH of Antwerp | 9 (13.8) | 10 (15.6) | 16 (24.6) | 35 (18) |
| UH of Saint Pierre Brussels | 6 (9.2) | 2 (3.1) | 2 (3.1) | 10 (5.2) |
| GH of Groeninge Kortrijk | 7 (10.8) | 7 (10.9) | 7 (10.8) | 23 (11.9) |
| Ghent University Hospital (or Ghent UH) | 4 (6.2) | 9 (14.1) | 3 (4.6) | 14 (7.2) |
| Sexe | ||||
| Men | 0 (0.0) | 1 (1.6) | 0 (0.0) | 1 (0.5) |
| Women | 65 (100.0) | 63 (98.4) | 65 (100.0) | 193 (99.5) |
| Edema on dominant sidee | ||||
| No | 34 (52.3) | 43 (67.2) | 32 (49.2) | 109 (56.2) |
| Yes | 31 (47.7) | 21 (32.8) | 33 (50.8) | 85 (43.8) |
| Reason for inclusione | ||||
| Arm lymphedema | 61 (93.9) | 62 (96.9) | 61 (93.9) | 184 (94.9) |
| Hand lymphedema | 4 (6.2) | 2 (3.1) | 4 (6.2) | 10 (5.2) |
| Lymphedema stagee | ||||
| I | 10 (15.4) | 10 (15.6) | 12 (18.5) | 32 (16.5) |
| IIa | 34 (52.3) | 40 (62.5) | 35 (53.8) | 109 (56.2) |
| IIb | 21 (32.3) | 14 (21.9) | 18 (27.7) | 53 (27.3) |
| Type of surgerye | ||||
| Mastectomy | 36 (55.4) | 40 (62.5) | 39 (60) | 115 (59.3) |
| Breast-conserving surgery | 29 (44.6) | 24 (37.5) | 26 (40) | 79 (40.7) |
| No. of positive lymph nodese | ||||
| 0 | 12 (18.5) | 19 (29.7) | 17 (26.2) | 48 (24.7) |
| 1–3 | 35 (53.8) | 24 (37.5) | 28 (43.1) | 87 (44.8) |
| 4–10 | 13 (20.0) | 11 (17.2) | 14 (21.5) | 38 (19.6) |
| >10 | 5 (7.7) | 9 (14.1) | 6 (9.2) | 20 (10.3) |
| pTe | ||||
| 1 | 20 (30.7) | 20 (31.3) | 17 (26.2) | 58 (29.9) |
| 2 | 32 (49.2) | 29 (45.3) | 43 (66.2) | 104 (53.6) |
| 3 | 6 (9.2) | 9 (14.1) | 3 (4.6) | 18 (9.3 |
| 4 | 7 (10.8) | 6 (9.3) | 2 (3.1) | 14 (7.2) |
| pNe | ||||
| 0 | 12 (18.5) | 16 (25) | 15 (23.1) | 45 (23.2) |
| 1 | 36 (55.4) | 32 (50) | 34 (52.3) | 99 (51.5) |
| 2 | 11 (16.9) | 8 (12.5) | 7 (10.8) | 26 (13.4) |
| 3 | 6 (9.2) | 8 (12.5) | 9 (13.8) | 23 (11.9) |
| cMe | ||||
| 0 | 64 (98.5) | 64 (100.0) | 63 (96.9) | 191 (98.5) |
| 1 | 1 (1.5) | 0 (0.0) | 2 (3.1) | 3 (1.5) |
| Radiotherapye | 63 (96.9) | 63 (98.4) | 63 (96.9) | 189 (97.4) |
| Chemotherapye | 57 (83.1) | 52 (81.2) | 61 (93.8) | 167 (86.1) |
| Hormonal therapye | 51 (78.5) | 53 (82.8) | 48 (73.8) | 152 (78.4) |
| Targeted therapye | 13 (20.0) | 12 (18.8) | 14 (21.5) | 39 (20.1) |
cM = clinical metastasis; GH = General Hospital; MLD = manual lymph drainage; pN = pathologic nodal stage; pT = pathologic tumor stage; UH = University Hospitals.
Data are reported as mean (SD).
Data are reported as median (interquartile range).
Calculated as a total score resulting from 9 individual pitting test scores (with 0 = no, 1 = doubt, and 2 = clear) on the edematous limb and trunk.14
Data are reported as number.
During the intensive treatment phase, patients received, on average, 13 (SD = 1) of the 14 treatment sessions (lasting 60 minutes) that were initially planned. The maintenance treatment phase lasted 6 months, with patients receiving, on average, 17 (SD = 1) treatment sessions (lasting 30 minutes) of the 18 that were initially planned.
Outcomes
Tables 3 to 5 and Supplementary Appendices 1–3 display the results regarding the investigated outcome measures.
| Parameter Evaluated | Description | Time Point | Mean Estimate (95% CI) for Following Group: | P for Overall Interaction (Group × Time) | P for Comparison of Changes Between Groups | ||||
|---|---|---|---|---|---|---|---|---|---|
| Fluoroscopy-Guided MLD | Traditional MLD | Placebo MLD | |||||||
| Fluoroscopy-Guided MLD vs Traditional MLD | Fluoroscopy-Guided MLD vs Placebo MLD | Traditional MLD vs Placebo MLD | |||||||
| Accumulation of fluid in suprafascial tissue | Local tissue water | B0 | 1.418 (1.365–1.473) | 1.354 (1.303–1.406) | 1.406 (1.354–1.459) | .665 | |||
| P | 1.372g (1.326–1.419) | 1.292g (1.247–1.336) | 1.344g (1.300–1.391) | ||||||
| P1 | 1.383 (1.328–1.438) | 1.315 (1.264–1.368) | 1.394 (1.340–1.449) | ||||||
| P3 | 1.363 (1.309–1.420) | 1.288g (1.236–1.342) | 1.358 (1.303–1.415) | ||||||
| P6 | 1.343g (1.290–1.399) | 1.298g (1.246–1.351) | 1.350g (1.297–1.405) | ||||||
| P12 | 1.343g (1.305–1.383) | 1.332 (1.294–1.373) | 1.335g (1.297–1.374) | ||||||
| Thickness of cutis | B0 | 1.29 (1.22–1.36) | 1.27 (1.20–1.34) | 1.32 (1.24–1.35) | .422 | ||||
| P | 1.30 (1.23–1.37) | 1.29 (1.23–1.36) | 1.37 (1.31–1.44) | ||||||
| P6 | 1.27 (1.20–1.34) | 1.30 (1.23–1.38) | 1.27 (1.21–1.35) | ||||||
| P12 | 1.23 (1.16–1.30) | 1.28 (1.20–1.35) | 1.33 (1.25–1.41) | ||||||
| Thickness of subcutis | B0 | 1.62 (1.49–1.76) | 1.52 (1.40–1.65) | 1.52 (1.40–1.65) | .118 | ||||
| P | 1.38h (1.28–1.49) | 1.40g (1.30–1.51) | 1.36g (1.26–1.46) | ||||||
| P6 | 1.38h (1.28–1.49) | 1.46 (1.36–1.58) | 1.30h (1.21–1.40) | ||||||
| P12 | 1.34h (1.23–1.47) | 1.46 (1.34–1.60) | 1.25g (1.25–1.49) | ||||||
| Thickness of cutis + subcutis | B0 | 1.52 (1.42–1.63) | 1.44 (1.34–1.55) | 1.45 (1.35–1.56) | .180 | ||||
| P | 1.36g (1.27–1.27) | 1.38 (1.30–1.47) | 1.36 (1.28–1.45) | ||||||
| P6 | 1.35h (1.27–1.44) | 1.40 (1.31–1.49) | 1.29h (1.21–1.37) | ||||||
| P12 | 1.31h (1.22–1.41) | 1.40 (1.30–1.51) | 1.34g (1.24–1.44) | ||||||
| Thickness of skin and subcutis through palpation | B0 | 4.43 (4.01–4.85) | 4.03 (3.61–4.45) | 4.65 (4.23–5.07) | .889 | ||||
| P | 4.62 (4.23–5.00) | 4.23 (3.84–4.63) | 4.57 (4.18–4.96) | ||||||
| P1 | 4.37 (3.96–4.78) | 4.25 (3.84–4.66) | 4.22 (3.81–4.62) | ||||||
| P3 | 4.25 (3.82–4.68) | 4.19 (3.76–4.62) | 4.22 (3.79–4.64) | ||||||
| P6 | 4.22 (3.77–4.67) | 4.03 (3.58–4.49) | 4.05g (3.60–4.50) | ||||||
| P12 | 4.09 (3.61–4.57) | 3.92 (3.44–4.40) | 4.17 (3.69–4.65) | ||||||
| Skin elasticity | Skin elasticity | B0 | 1.28 (1.19–1.37) | 1.26 (1.17–1.35) | 1.41 (1.31–1.51) | .741 | |||
| P | 1.11h (1.04–1.18) | 1.06h (1.0–1.13) | 1.14h (1.07–1.21) | ||||||
| P1 | 1.15g (1.08–1.23) | 1.07h (1.01–1.14) | 1.18h (1.11–1.26) | ||||||
| P3 | 1.16g (1.10–1.23) | 1.07h (1.01–1.14) | 1.15h (1.08–1.22) | ||||||
| P6 | 1.13g (1.07–1.20) | 1.10g (1.04–1.17) | 1.14h (1.08–1.22) | ||||||
| P12 | 1.19 (1.11–1.27) | 1.07h (1.01–1.14) | 1.15h (1.08–1.23) | ||||||
| Skin elasticity (through palpation) | B0 | 0.49 (0.32–0.67) | 0.26 (0.12–0.41) | 0.24 (0.10–0.40) | .023g | ||||
| P | 0.40 (0.22–0.59) | 0.44 (0.26–0.64) | 0.56g (0.37–0.78) | .128 | .024g | .465 | |||
| P1 | 0.37 (0.21–0.55) | 0.52g (0.35–0.72) | 0.42 (0.26–0.61) | .026g | .073 | .657 | |||
| P3 | 0.17g (0.03–0.32) | 0.45 (0.29–0.64) | 0.50g (0.33–0.69) | .002g | <.001g | .724 | |||
| P6 | 0.15g (0.05–0.25) | 0.23 (0.13–0.35) | 0.28 (0.17–0.40) | .026g | .007g | .621 | |||
| P12 | 0.22g (0.11–0.34) | 0.20 (0.09–0.32) | 0.24 (0.13–0.37) | .160 | .067 | .669 | |||
Represented by percentage of water content interlimb ratios. B0 = baseline; MLD = manual lymph drainage; P = after intensive treatment; P1, P3, P6, and P12 = after 1, 3, 6, and 12 mo of maintenance treatment, respectively.
Cutis, subcutis, and cutis + subcutis, represented by interlimb ratios.
Through palpation, represented by pinch test scores.
Represented by induration force interlimb ratios.
Represented by palpation test scores.
At different time points. Significance of relative changes versus baseline in each treatment group separately. P values for overall interaction effect and comparisons of changes between treatment groups in case of presence of significant interaction effect.
With regard to within-group differences, P < .05 for changes in the estimated mean versus baseline that were statistically significant.
With regard to within-group differences, P < .0001 for changes in the estimated mean versus baseline that were statistically significant. B0 = baseline; MLD = manual lymph drainage; P = after intensive treatment; P1, P3, P6, and P12 = after 1, 3, 6, and 12 months of maintenance treatment, respectively.
| Parameter Evaluated | Description | Time Point | Mean Estimate (95% CI) for Following Group: | P for Overall Interaction (Group × Time) | P for Comparison of Changes Between Groups | ||||
|---|---|---|---|---|---|---|---|---|---|
| Fluoroscopy-Guided MLD | Traditional MLD | Placebo MLD | |||||||
| Fluoroscopy-Guided MLD vs Traditional MLD | Fluoroscopy-Guided MLD vs Placebo MLD | Traditional MLD vs Placebo MLD | |||||||
| Accumulation of fluid in suprafascial tissue | Local tissue water | B0 | 1.418 (1.365–1.473) | 1.354 (1.303–1.406) | 1.406 (1.354–1.459) | .665 | |||
| P | 1.372g (1.326–1.419) | 1.292g (1.247–1.336) | 1.344g (1.300–1.391) | ||||||
| P1 | 1.383 (1.328–1.438) | 1.315 (1.264–1.368) | 1.394 (1.340–1.449) | ||||||
| P3 | 1.363 (1.309–1.420) | 1.288g (1.236–1.342) | 1.358 (1.303–1.415) | ||||||
| P6 | 1.343g (1.290–1.399) | 1.298g (1.246–1.351) | 1.350g (1.297–1.405) | ||||||
| P12 | 1.343g (1.305–1.383) | 1.332 (1.294–1.373) | 1.335g (1.297–1.374) | ||||||
| Thickness of cutis | B0 | 1.29 (1.22–1.36) | 1.27 (1.20–1.34) | 1.32 (1.24–1.35) | .422 | ||||
| P | 1.30 (1.23–1.37) | 1.29 (1.23–1.36) | 1.37 (1.31–1.44) | ||||||
| P6 | 1.27 (1.20–1.34) | 1.30 (1.23–1.38) | 1.27 (1.21–1.35) | ||||||
| P12 | 1.23 (1.16–1.30) | 1.28 (1.20–1.35) | 1.33 (1.25–1.41) | ||||||
| Thickness of subcutis | B0 | 1.62 (1.49–1.76) | 1.52 (1.40–1.65) | 1.52 (1.40–1.65) | .118 | ||||
| P | 1.38h (1.28–1.49) | 1.40g (1.30–1.51) | 1.36g (1.26–1.46) | ||||||
| P6 | 1.38h (1.28–1.49) | 1.46 (1.36–1.58) | 1.30h (1.21–1.40) | ||||||
| P12 | 1.34h (1.23–1.47) | 1.46 (1.34–1.60) | 1.25g (1.25–1.49) | ||||||
| Thickness of cutis + subcutis | B0 | 1.52 (1.42–1.63) | 1.44 (1.34–1.55) | 1.45 (1.35–1.56) | .180 | ||||
| P | 1.36g (1.27–1.27) | 1.38 (1.30–1.47) | 1.36 (1.28–1.45) | ||||||
| P6 | 1.35h (1.27–1.44) | 1.40 (1.31–1.49) | 1.29h (1.21–1.37) | ||||||
| P12 | 1.31h (1.22–1.41) | 1.40 (1.30–1.51) | 1.34g (1.24–1.44) | ||||||
| Thickness of skin and subcutis through palpation | B0 | 4.43 (4.01–4.85) | 4.03 (3.61–4.45) | 4.65 (4.23–5.07) | .889 | ||||
| P | 4.62 (4.23–5.00) | 4.23 (3.84–4.63) | 4.57 (4.18–4.96) | ||||||
| P1 | 4.37 (3.96–4.78) | 4.25 (3.84–4.66) | 4.22 (3.81–4.62) | ||||||
| P3 | 4.25 (3.82–4.68) | 4.19 (3.76–4.62) | 4.22 (3.79–4.64) | ||||||
| P6 | 4.22 (3.77–4.67) | 4.03 (3.58–4.49) | 4.05g (3.60–4.50) | ||||||
| P12 | 4.09 (3.61–4.57) | 3.92 (3.44–4.40) | 4.17 (3.69–4.65) | ||||||
| Skin elasticity | Skin elasticity | B0 | 1.28 (1.19–1.37) | 1.26 (1.17–1.35) | 1.41 (1.31–1.51) | .741 | |||
| P | 1.11h (1.04–1.18) | 1.06h (1.0–1.13) | 1.14h (1.07–1.21) | ||||||
| P1 | 1.15g (1.08–1.23) | 1.07h (1.01–1.14) | 1.18h (1.11–1.26) | ||||||
| P3 | 1.16g (1.10–1.23) | 1.07h (1.01–1.14) | 1.15h (1.08–1.22) | ||||||
| P6 | 1.13g (1.07–1.20) | 1.10g (1.04–1.17) | 1.14h (1.08–1.22) | ||||||
| P12 | 1.19 (1.11–1.27) | 1.07h (1.01–1.14) | 1.15h (1.08–1.23) | ||||||
| Skin elasticity (through palpation) | B0 | 0.49 (0.32–0.67) | 0.26 (0.12–0.41) | 0.24 (0.10–0.40) | .023g | ||||
| P | 0.40 (0.22–0.59) | 0.44 (0.26–0.64) | 0.56g (0.37–0.78) | .128 | .024g | .465 | |||
| P1 | 0.37 (0.21–0.55) | 0.52g (0.35–0.72) | 0.42 (0.26–0.61) | .026g | .073 | .657 | |||
| P3 | 0.17g (0.03–0.32) | 0.45 (0.29–0.64) | 0.50g (0.33–0.69) | .002g | <.001g | .724 | |||
| P6 | 0.15g (0.05–0.25) | 0.23 (0.13–0.35) | 0.28 (0.17–0.40) | .026g | .007g | .621 | |||
| P12 | 0.22g (0.11–0.34) | 0.20 (0.09–0.32) | 0.24 (0.13–0.37) | .160 | .067 | .669 | |||
Represented by percentage of water content interlimb ratios. B0 = baseline; MLD = manual lymph drainage; P = after intensive treatment; P1, P3, P6, and P12 = after 1, 3, 6, and 12 mo of maintenance treatment, respectively.
Cutis, subcutis, and cutis + subcutis, represented by interlimb ratios.
Through palpation, represented by pinch test scores.
Represented by induration force interlimb ratios.
Represented by palpation test scores.
At different time points. Significance of relative changes versus baseline in each treatment group separately. P values for overall interaction effect and comparisons of changes between treatment groups in case of presence of significant interaction effect.
With regard to within-group differences, P < .05 for changes in the estimated mean versus baseline that were statistically significant.
With regard to within-group differences, P < .0001 for changes in the estimated mean versus baseline that were statistically significant. B0 = baseline; MLD = manual lymph drainage; P = after intensive treatment; P1, P3, P6, and P12 = after 1, 3, 6, and 12 months of maintenance treatment, respectively.
| Parameter Evaluated | Description | Time Point | Mean Estimate (95% CI) for Following Group: | P for Overall Interaction (Group × Time) | ||
|---|---|---|---|---|---|---|
| Fluoroscopy-Guided MLD | Traditional MLD | Placebo MLD | ||||
| Accumulation of fluid in suprafascial tissues | Local tissue water | B0 | 1.09 (1.05–1.12) | 1.08 (1.05–1.11) | 1.12 (1.08–1.20) | .798 |
| P | 1.11 (1.08–1.142) | 1.09 (1.06–1.12) | 1.12 (1.09–1.15) | |||
| P1 | 1.14g (1.11–1.18) | 1.09 (1.06–1.129) | 1.12 (1.09–1.16) | |||
| P3 | 1.10 (1.07–1.13) | 1.07 (1.04–1.10) | 1.10 (1.08–1.13) | |||
| P6 | 1.09 (1.06–1.12) | 1.07 (1.04–1.09) | 1.09 (1.07–1.12) | |||
| P12 | 1.10 (1.07–1.13) | 1.08 (1.03–1.10) | 1.10 (1.07–1.13) | |||
| Thickness of cutis | B0 | 1.11 (1.06–1.17) | 1.09 (1.03–1.14) | 1.11 (1.06–1.17) | .743 | |
| P | 1.08 (1.02–1.15) | 1.09 (1.03–1.15) | 1.10 (1.04–1.16) | |||
| P6 | 1.12 (1.04–1.20) | 1.07 (0.99–1.15) | 1.12 (1.04–1.20) | |||
| P12 | 1.04g (0.98–1.10) | 1.08 (1.02–1.15) | 1.11 (1.04–1.17) | |||
| Thickness of subcutis | B0 | 1.05 (0.99–1.12) | 1.01 (0.94–1.07) | 1.06 (0.99–1.13) | .252 | |
| P | 1.10 (1.03–1.16) | 1.01 (0.95–1.07) | 1.02 (0.96–1.08) | |||
| P6 | 1.10 (1.02–1.19) | 1.05 (0.96–1.13) | 1.02 (0.94–1.10) | |||
| P12 | 1.01 (0.95–1.07) | 1.03 (0.98–1.09) | 1.05 (0.99–1.11) | |||
| Thickness of cutis + subcutis | B0 | 0.78 (0.72–0.85) | 0.79 (0.73–0.87) | 0.83 (0.76–0.90) | .283 | |
| P | 0.82 (0.76–0.89) | 0.81 (0.75–0.89) | 0.83 (0.76–0.90) | |||
| P6 | 0.78 (0.71–0.86) | 0.80 (0.73–0.87) | 0.85 (0.78–0.93) | |||
| P12 | 0.75 (0.69–0.81) | 0.82 (0.75–0.89) | 0.85 (0.78–0.92) | |||
| Thickness of skin and subcutis through palpation | B0 | 1.17 (0.92–1.42) | 1.02 (0.76–1.27) | 1.31 (1.06–6.34) | .248 | |
| P | 1.39 (1.12–1.65) | 1.30 (1.03–1.56) | 1.40 (1.14–1.66) | |||
| P1 | 1.28 (1.03–1.53) | 1.17 (0.92–1.42) | 1.08 (0.83–1.33) | |||
| P3 | 1.34 (0.87–1.40) | 1.19 (0.92–1.46) | 1.14 (0.87–1.40) | |||
| P6 | 1.31 (1.05–1.56) | 1.39g (1.33–1.65) | 1.00 (0.74–1.26) | |||
| P12 | 1.15 (0.89–1.56) | 1.14 (0.88–1.41) | 1.06 (0.80–1.32) | |||
| Skin elasticity | B0 | 1.27 (1.16–1.39) | 1.15 (1.05–1.26) | 1.26 (1.15–1.38) | .857 | |
| P | 1.30 (1.18–1.42) | 1.19 (1.08–1.30) | 1.24 (1.14–1.36) | |||
| P1 | 1.23 (1.13–1.33) | 1.20 (1.11–1.30) | 1.23 (1.14–1.34) | |||
| P3 | 1.26 (1.16–1.37) | 1.14 (1.04–1.24) | 1.28 (1.17–1.39) | |||
| P6 | 1.33 (1.22–1.45) | 1.15 (1.05–1.25) | 1.28 (1.18–1.39) | |||
| P12 | 1.26 (1.15–1.38) | 1.19 (1.10–1.29) | 1.23 (1.13–1.34) | |||
| Skin elasticity through palpation | B0 | 0.17 (0.09–0.26) | 0.13 (0.05–0.21) | 0.14 (0.06–0.22) | .912 | |
| P | 0.20 (0.10–0.30) | 0.17 (0.08–0.27) | 0.22 (0.12–0.32) | |||
| P1 | 0.21 (0.11–0.31) | 0.16 (0.07–0.25) | 0.22 (0.13–0.32) | |||
| P3 | 0.18 (0.09–0.27) | 0.18 (0.09–0.28) | 0.22 (0.13–0.32) | |||
| P6 | 0.14 (0.06–0.23) | 0.19 (0.10–0.28) | 0.23 (0.14–0.32) | |||
| P12 | 0.11 (0.04–0.18) | 0.13 (0.06–0.20) | 0.11 (0.04–0.18) | |||
Represented by percentage of water content interlimb ratios. B0 = baseline; MLD = manual lymph drainage; P = after intensive treatment; P1, P3, P6, and P12 = after 1, 3, 6, and 12 mo of maintenance treatment, respectively.
Cutis, subcutis, and cutis + subcutis, represented by interlimb ratios.
Through palpation, represented by pinch test scores.
Represented by induration force interlimb ratios.
Represented by palpation test scores.
At different time points as well as P values for overall interaction effect.
With regard to within-group differences, P < .05 for changes in the estimated mean vs baseline that were statistically significant.
| Parameter Evaluated | Description | Time Point | Mean Estimate (95% CI) for Following Group: | P for Overall Interaction (Group × Time) | ||
|---|---|---|---|---|---|---|
| Fluoroscopy-Guided MLD | Traditional MLD | Placebo MLD | ||||
| Accumulation of fluid in suprafascial tissues | Local tissue water | B0 | 1.09 (1.05–1.12) | 1.08 (1.05–1.11) | 1.12 (1.08–1.20) | .798 |
| P | 1.11 (1.08–1.142) | 1.09 (1.06–1.12) | 1.12 (1.09–1.15) | |||
| P1 | 1.14g (1.11–1.18) | 1.09 (1.06–1.129) | 1.12 (1.09–1.16) | |||
| P3 | 1.10 (1.07–1.13) | 1.07 (1.04–1.10) | 1.10 (1.08–1.13) | |||
| P6 | 1.09 (1.06–1.12) | 1.07 (1.04–1.09) | 1.09 (1.07–1.12) | |||
| P12 | 1.10 (1.07–1.13) | 1.08 (1.03–1.10) | 1.10 (1.07–1.13) | |||
| Thickness of cutis | B0 | 1.11 (1.06–1.17) | 1.09 (1.03–1.14) | 1.11 (1.06–1.17) | .743 | |
| P | 1.08 (1.02–1.15) | 1.09 (1.03–1.15) | 1.10 (1.04–1.16) | |||
| P6 | 1.12 (1.04–1.20) | 1.07 (0.99–1.15) | 1.12 (1.04–1.20) | |||
| P12 | 1.04g (0.98–1.10) | 1.08 (1.02–1.15) | 1.11 (1.04–1.17) | |||
| Thickness of subcutis | B0 | 1.05 (0.99–1.12) | 1.01 (0.94–1.07) | 1.06 (0.99–1.13) | .252 | |
| P | 1.10 (1.03–1.16) | 1.01 (0.95–1.07) | 1.02 (0.96–1.08) | |||
| P6 | 1.10 (1.02–1.19) | 1.05 (0.96–1.13) | 1.02 (0.94–1.10) | |||
| P12 | 1.01 (0.95–1.07) | 1.03 (0.98–1.09) | 1.05 (0.99–1.11) | |||
| Thickness of cutis + subcutis | B0 | 0.78 (0.72–0.85) | 0.79 (0.73–0.87) | 0.83 (0.76–0.90) | .283 | |
| P | 0.82 (0.76–0.89) | 0.81 (0.75–0.89) | 0.83 (0.76–0.90) | |||
| P6 | 0.78 (0.71–0.86) | 0.80 (0.73–0.87) | 0.85 (0.78–0.93) | |||
| P12 | 0.75 (0.69–0.81) | 0.82 (0.75–0.89) | 0.85 (0.78–0.92) | |||
| Thickness of skin and subcutis through palpation | B0 | 1.17 (0.92–1.42) | 1.02 (0.76–1.27) | 1.31 (1.06–6.34) | .248 | |
| P | 1.39 (1.12–1.65) | 1.30 (1.03–1.56) | 1.40 (1.14–1.66) | |||
| P1 | 1.28 (1.03–1.53) | 1.17 (0.92–1.42) | 1.08 (0.83–1.33) | |||
| P3 | 1.34 (0.87–1.40) | 1.19 (0.92–1.46) | 1.14 (0.87–1.40) | |||
| P6 | 1.31 (1.05–1.56) | 1.39g (1.33–1.65) | 1.00 (0.74–1.26) | |||
| P12 | 1.15 (0.89–1.56) | 1.14 (0.88–1.41) | 1.06 (0.80–1.32) | |||
| Skin elasticity | B0 | 1.27 (1.16–1.39) | 1.15 (1.05–1.26) | 1.26 (1.15–1.38) | .857 | |
| P | 1.30 (1.18–1.42) | 1.19 (1.08–1.30) | 1.24 (1.14–1.36) | |||
| P1 | 1.23 (1.13–1.33) | 1.20 (1.11–1.30) | 1.23 (1.14–1.34) | |||
| P3 | 1.26 (1.16–1.37) | 1.14 (1.04–1.24) | 1.28 (1.17–1.39) | |||
| P6 | 1.33 (1.22–1.45) | 1.15 (1.05–1.25) | 1.28 (1.18–1.39) | |||
| P12 | 1.26 (1.15–1.38) | 1.19 (1.10–1.29) | 1.23 (1.13–1.34) | |||
| Skin elasticity through palpation | B0 | 0.17 (0.09–0.26) | 0.13 (0.05–0.21) | 0.14 (0.06–0.22) | .912 | |
| P | 0.20 (0.10–0.30) | 0.17 (0.08–0.27) | 0.22 (0.12–0.32) | |||
| P1 | 0.21 (0.11–0.31) | 0.16 (0.07–0.25) | 0.22 (0.13–0.32) | |||
| P3 | 0.18 (0.09–0.27) | 0.18 (0.09–0.28) | 0.22 (0.13–0.32) | |||
| P6 | 0.14 (0.06–0.23) | 0.19 (0.10–0.28) | 0.23 (0.14–0.32) | |||
| P12 | 0.11 (0.04–0.18) | 0.13 (0.06–0.20) | 0.11 (0.04–0.18) | |||
Represented by percentage of water content interlimb ratios. B0 = baseline; MLD = manual lymph drainage; P = after intensive treatment; P1, P3, P6, and P12 = after 1, 3, 6, and 12 mo of maintenance treatment, respectively.
Cutis, subcutis, and cutis + subcutis, represented by interlimb ratios.
Through palpation, represented by pinch test scores.
Represented by induration force interlimb ratios.
Represented by palpation test scores.
At different time points as well as P values for overall interaction effect.
With regard to within-group differences, P < .05 for changes in the estimated mean vs baseline that were statistically significant.
| Time Point | Estimated Mean (95% CI) for Following Group: | ||
|---|---|---|---|
| Fluoroscopy-Guided MLD | Traditional MLD | Placebo MLD | |
| B0 | 33.1 (26.1–40.1) | 32.3 (25.3–39.3) | 34.9 (28–41.8) |
| P | 24.4c (19.1–29.6) | 25.4c (20.2–30.7) | 23.9d (18.7–29.1) |
| P1 | 30.0 (22.2–37.8) | 29.5 (21.6–37.3) | 25.3c (17.6–33.0) |
| P3 | 20.9d (16.6–25.2) | 22.2d (17.8–26.5) | 21.1d (16.8–25.4) |
| P6 | 22.8d (17.1–28.5) | 22.6c (16.8–28.3) | 21.6d (16.0–27.3) |
| P12 | 28.1 (20.0–36.2) | 24.1c (16.0–32.3) | 25.4c (17.3–33.4) |
Represented by L-Dex scores. B0 = baseline; MLD = manual lymph drainage; P = after intensive treatment; P1, P3, P6, and P12 = after 1, 3, 6, and 12 months of maintenance treatment, respectively.
Significance of relative changes vs baseline in each treatment group at different time points. The P value for the overall interaction effect (group × time) was .950. MLD = manual lymph drainage.
With regard to within-group differences, P < .05 for changes in the estimated mean vs baseline that were statistically significant.
With regard to within-group differences, P < .0001 for changes in the estimated mean vs baseline that were statistically significant.
| Time Point | Estimated Mean (95% CI) for Following Group: | ||
|---|---|---|---|
| Fluoroscopy-Guided MLD | Traditional MLD | Placebo MLD | |
| B0 | 33.1 (26.1–40.1) | 32.3 (25.3–39.3) | 34.9 (28–41.8) |
| P | 24.4c (19.1–29.6) | 25.4c (20.2–30.7) | 23.9d (18.7–29.1) |
| P1 | 30.0 (22.2–37.8) | 29.5 (21.6–37.3) | 25.3c (17.6–33.0) |
| P3 | 20.9d (16.6–25.2) | 22.2d (17.8–26.5) | 21.1d (16.8–25.4) |
| P6 | 22.8d (17.1–28.5) | 22.6c (16.8–28.3) | 21.6d (16.0–27.3) |
| P12 | 28.1 (20.0–36.2) | 24.1c (16.0–32.3) | 25.4c (17.3–33.4) |
Represented by L-Dex scores. B0 = baseline; MLD = manual lymph drainage; P = after intensive treatment; P1, P3, P6, and P12 = after 1, 3, 6, and 12 months of maintenance treatment, respectively.
Significance of relative changes vs baseline in each treatment group at different time points. The P value for the overall interaction effect (group × time) was .950. MLD = manual lymph drainage.
With regard to within-group differences, P < .05 for changes in the estimated mean vs baseline that were statistically significant.
With regard to within-group differences, P < .0001 for changes in the estimated mean vs baseline that were statistically significant.
Evaluation of Fluid Accumulation in Suprafascial Tissues at the Level of the Arm
As shown in Table 3, the amount of local tissue water, the thickness of the subcutis, and the thickness of the cutis plus subcutis together significantly improved over time in all 3 groups (within-group differences, P < .05). Only the change in thickness of the cutis did not significantly change over time in any of the groups. When looking at the overall interaction term (groups × time), no significant effects could be detected (P < .05), resulting in no between-group differences.
Evaluation of Fluid Accumulation in Suprafascial Tissues at the Trunk Level
As shown in Table 4, the amount of local tissue water and the thickness of the cutis, subcutis, and cutis plus subcutis evaluated with ultrasonography or by palpation did not improve remarkably over time at the trunk level (within-group differences). Neither were there any significant changes between the groups (between-group differences) regarding these outcome measures because there was no significant interaction effect.
Evaluation of Fluid Accumulation in Suprafascial Tissues at the Entire Upper Limb Level
As shown in Table 5, the amount of extracellular fluid significantly decreased in all 3 groups over time (within-group differences, P < .05). Nevertheless, no statistically significant differences in reduction were present between the 3 groups (P > .05).
Evaluation of Skin Elasticity at the Level of the Arm
As shown in Table 3, skin elasticity measured with the SkinFibroMeter significantly improved over time in all 3 groups (within-group differences, P < .05). No significant interaction effect was present (P < .05). Skin elasticity evaluated through palpation (Tab. 3) showed some variation in the results. All groups showed a significant change over time: an improvement in the fluoroscopy-guided MLD group and a deterioration in the other 2 groups (within-group differences, P < .05). Because a significant interaction effect was present (P = .023), between-group differences could be explored. Statistical differences between the groups (ie, between the fluoroscopy-guided MLD group and the traditional MLD group as well as between the fluoroscopy-guided MLD group and the placebo MLD group) were present but varied depending on the time of measurement. After the intensive treatment phase, there was a significant difference in change between the fluoroscopy-guided MLD group (decrease in skin hardness) and the placebo MLD group (increase in skin hardness). During/after the maintenance treatment phase, a significant difference in change between the fluoroscopy-guided MLD group (decrease in skin hardness) and both the traditional and placebo MLD groups (increase in skin hardness) was noted.
Evaluation of Skin Elasticity at the Trunk Level
Skin elasticity (both evaluated with the SkinFibroMeter as well as through palpation) did not significantly improve over time (within-group differences). Neither was there a significant interaction effect or significant changes between the groups (between-group differences) regarding these outcome measures (P > .05).
Discussion
To our knowledge, this is the first RCT to investigate the merit of an optimized method of MLD (ie, fluoroscopy-guided MLD) compared with traditional MLD and placebo MLD, additional to the other components of DLT, for the treatment of BCRL in terms of change in fluid accumulation in suprafascial tissues as well in change of skin elasticity. In contrast with previous trials,7–10,32–36 the present study investigated the additional effect of MLD on outcome parameters other than change in arm volume, including not only the arm but also the trunk. In the Cochrane systematic review of Ezzo et al, it was indeed recommended that future trials should include volumetric outcomes beyond solely arm volume.6 The Cochrane review included only 1 trial that incorporated skin thickness (objectified with a modified Harpenden Skinfold Caliper) at the trunk, and skin thickness (measured with a 20-MHz ultrasound scanner) at 4 sites on the edematous arm and trunk. The trial showed that MLD according to the Vodder method did not statistically reduce caliper creep on the affected side after 3 weeks of intensive treatment (MLD plus compression sleeve) (P = .06).27
In the present study, hardly any between-group differences were found. At the level of the arm, a significant interaction effect was detected only for skin elasticity evaluated through palpation. However, the results varied depending on the time of measurement. After the intensive treatment phase, there was a significant difference in change between the fluoroscopy-guided MLD group (decrease in skin hardness) and the placebo MLD group (increase in skin hardness). During/after the maintenance treatment phase, a significant difference in change between the fluoroscopy-guided MLD group (decrease in skin hardness) and both the traditional and placebo MLD groups (increase in skin hardness) was noted. Nevertheless, one should be skeptical about the clinical relevance regarding these changes in skin elasticity, because the changes in mean outcome values are minor and based on a subjective therapist-reported palpation test with a relatively insensitive way of scoring this outcome (in terms of presence vs absence of skin fibrosis at each measurement point).
Moreover, this was the only significant interaction at the .05 level, and it would not remain significant after considering a correction for multiple testing. Consequently, significant P values should be interpreted with caution because the effect disappears if a correction for multiple testing is carried out. At the level of the trunk, the different outcomes did not show remarkable improvements within each group over time, nor were there any other significant differences in changes over time between the groups. This is not surprising, because during the treatment sessions compression therapy (ie, bandaging during the intensive treatment phase and wearing a compression sleeve and glove during the maintenance treatment phase) was applied only at the level of the arm. This might have induced some fluid accumulation at the level of the shoulder and trunk. However, because we hypothesized that the application of MLD could diminish this fluid retention because of its stimulating effect on lymphatic fluid, we were interested to investigate the effect of DLT on the different outcome parameters at the level of the arm and trunk separately.
For none of the considered outcomes was there evidence for a clinically relevant difference in evolution between the 3 groups. Consequently, a clinical benefit of MLD in reducing the amount of local tissue water, skin thickness, and skin elasticity at the level of the arm and trunk could not be shown in the present study. Additionally, a clinical benefit of MLD in reducing the amount of extracellular fluid in the entire upper limb could not be found either. As an overall result, none of the predefined hypotheses regarding the outcome measures could be retained. Because other studies have not included outcome measures such as the amount of local tissue water, extracellular fluid, or skin elasticity, we are not able to compare our results.
This study has several strengths. First of all, with 5 study centers participating, patients could be recruited in almost all regions of Flanders. Randomization was concealed, and both patients and assessors were masked for patients’ treatment allocation. Also, treatments were performed by the same experienced therapists in all centers to ensure standardization of the treatment sessions. The risk of performance bias was negligible; a testing demonstrated that more than 75% of the patients did not know what treatment was given or indicated the wrong treatment allocation.12 Second, the dropout rate was low. By educating patients to perform self-MLD during the maintenance treatment phase when no treatment was provided by the therapist, the present study tried to get the most out of the MLD treatment effect. As a result, MLD was applied on a daily basis throughout the entire study period (except for the 2 weekends during the intensive treatment phase). Lastly, in contrast to most trials,8,9 maintenance DLT treatment phase was included in the trial design. Compared with the other most recent RCTs,8–10 the present trial comprises a 6-month follow-up period together with a sufficiently large sample size empowering the trial. As a limitation, it should be mentioned that no corrections for multiple testing were considered for the EFforT-BCRL trial’s secondary outcomes (because we considered 2 primary outcomes and 2 pairwise primary comparisons in our sample size calculation). Hence, single significant P values should be interpreted with caution because the effect disappears if a correction for multiple testing is being carried out.
Clinical Implications and Future Research
The literature emphasized the urgent need for randomized trials investigating the relative contribution of MLD to DLT on other outcome parameters than arm volume.6 This multicenter RCT showed that, in line with the results on the previously investigated outcome measures,12 fluoroscopy-guided MLD is not superior to the traditional MLD (in addition to DLT) for reducing the amount of local tissue water, extracellular fluid, and skin thickness and for improving skin elasticity in patients with chronic BCRL. Moreover, both fluoroscopy-guided and traditional MLD were not superior to a placebo MLD in addition to DLT. This means that, for these investigated clinical outcomes in patients with chronic BCRL, there is no indication for including (time-consuming) MLD in the limited treatment time per session. Alternatively, more time should be spent on other well-investigated and evidence-based treatment options such as compression therapy37–39 and exercise therapy (under compression),39,40 together with a greater emphasis on education and self-management.41
Future analyses should be performed to investigate the role of (fluoroscopy-guided) MLD on lymphatic transport in the long term and should explore the role and long-term clinical benefit of MLD in other types of edema, including that in patients with dynamic (instead of obstructive) lymphatic disorders such as an increased filtration rate. Additionally, more research on the effectiveness of MLD in patients with midline and lower limb lymphedema is greatly needed.
The present findings could not demonstrate an added value of different types of MLD, in addition to the other modalities of DLT, for the treatment of chronic BCRL in terms of reducing the amounts of local tissue water and extracellular fluid, reducing skin thickness, and improving skin elasticity at the level of the arm and trunk. Therefore, a paradigm shift regarding the content (rather than the amount) of the treatment sessions for patients with chronic BCRL is necessary.
Data Availability
Relevant patient-level data, a full dataset, and statistical analyses are available from the corresponding author (tessa.devrieze@kuleuven.be) upon reasonable request.
Author Contributions
Concept/idea/research design: T. De Vrieze, N. Gebruers, I. Nevelsteen, A. De Groef, W.A.A. Tjalma, J.-P. Belgrado, N. Devoogdt
Writing: T. De Vrieze, N. Gebruers, I. Nevelsteen, A. De Groef, W.A.A. Tjalma, J.-P. Belgrado, M. Hanssens, A. Asnong, E. Van der Gucht, N. Devoogdt
Data collection: T. De Vrieze, N. Gebruers, S. Thomis, W.A.A. Tjalma, M. Hanssens, A.-K. Heroes
Data analysis: T. De Vrieze, N. Gebruers, A. De Groef, W.A.A. Tjalma, J.-P. Belgrado, A. Asnong
Project management: T. De Vrieze, N. Gebruers, W.A.A. Tjalma, N. Devoogdt
Fund procurement: N. Gebruers, W.A.A. Tjalma, J.-P. Belgrado, N. Devoogdt
Providing participants: T. De Vrieze, N. Gebruers, S. Thomis, W.A.A. Tjalma, J.-P. Belgrado, C. Monten, L. Dams, A.-K. Heroes, M. Hanssens, N. Devoogdt
Providing facilities/equipment: T. De Vrieze, N. Gebruers, S. Thomis, W.A.A. Tjalma, J.-P. Belgrado, C. Monten, M. Hanssens, N. Devoogdt
Providing institutional liaisons: N. Gebruers, W.A.A. Tjalma, J.-P. Belgrado, L. Vandermeeren, N. Devoogdt
Clerical/secretarial support: W.A.A. Tjalma, L. Dams
Consultation (including review of manuscript before submitting): N. Gebruers, I. Nevelsteen, S. Thomis, W.A.A. Tjalma, J.-P. Belgrado, C. Monten, M. Hanssens, A. Asnong, L. Dams, E. Van der Gucht
Acknowledgments
The authors are very grateful to the different hospitals and research teams collaborating in this study (Roxane Van Hemelrijck, Lien Billiet, An-Kathleen Heroes, and Lore Vos at UH Leuven; Kevin Dusart and Sophie Vankerckhove at UH Saint-Pierre; Rita Hietbrink and Shanah Van den Bosch at UH Ghent; and Ellen Callens and Shanah Van den Bosch in GH Groeninge). The authors also extend very grateful thanks to all the study participants and to Steffen Fieuws (KU Leuven L-BioStat) for his statistical advice. Finally, the authors are grateful to the nurses and medical staff of the multidisciplinary breast centers of the different participating hospitals who helped motivate the patients to participate in our study.
Funding
This study was funded by the Agency for Innovation by Science and Technology (Applied Biomedical Research) (IWT 60519). To arrange such financing, a separate collaboration agreement has been signed by the University Hospitals of Leuven and the beneficiaries.
Ethics Approval
The EFforT-BCRL study has been approved by the Ethical Committee of the University Hospitals of Leuven (main ethical committee) and received positive advice from the ethical committees of all other participating centers (CME S58689, EudraCT No: 2015–004822-33).
Clinical Trial Registration
This study was registered at clinicaltrials.gov (NCT02609724).
Disclosures
The authors completed the ICMJE Form for Disclosure of Potential Conflicts of Interest and reported no conflicts of interest.
The lead author affirms that this manuscript is an honest, accurate, and transparent account of the study being reported; that no important aspects of the study have been omitted; and that any discrepancies from the study as planned (and, if relevant, registered) have been explained.

Comments