


Abstract
Polyploid hybrid rice (Oryza sativa) has great potential for increasing yields. However, hybrid rice depends on male fertility and its regulation, which is less well studied in polyploid rice than in diploid rice. We previously identified an MYB transcription factor, MORE FLORET1 (MOF1), whose mutation causes male sterility in neo-tetraploid rice. MOF1 expression in anthers peaks at anther Stage 7 (S7) and progressively decreases to low levels at S10. However, it remains unclear how the dynamics of MOF1 expression contribute to male fertility. Here, we carefully examined anther development in both diploid and tetraploid mof1 rice mutants, as well as lines ectopically expressing MOF1 in a temporal manner. MOF1 mutations caused delayed degeneration of the tapetum and middle layer of anthers and aberrant pollen wall organization. Ectopic MOF1 expression at later stages of anther development led to retarded cytoplasmic reorganization of tapetal cells. In both cases, pollen grains were aborted and seed production was abolished, indicating that precise control of MOF1 expression is essential for male reproduction. We demonstrated that 5 key tapetal genes, CYP703A3 (CYTOCHROME P450 HYDROXYLASE 703A3), OsABCG26 (O. sativa ATP BINDING CASSETTE G26), PTC1 (PERSISTENT TAPETAL CELL1), PKS2 (POLYKETIDE SYNTHASE 2), and OsABCG15 (O. sativa ATP BINDING CASSETTE G15), exhibit expression patterns opposite to those of MOF1 and are negatively regulated by MOF1. Moreover, DNA affinity purification sequencing (DAP-seq), luciferase activity assays, and electrophoretic mobility shift assays indicated that MOF1 binds directly to the PKS2 promoter for transcriptional repression. Our results provide a mechanistic basis for the regulation of male reproduction by MOF1 in both diploid and tetraploid rice. This study will facilitate the development of polyploid male sterile lines, which are useful for breeding of polyploid hybrid rice.
Introduction
Hybrid rice (Oryza sativa) has made great contributions to food security, and its seed production relies on male sterile lines as the female parents. Cultivated hybrid rice varieties are all diploid, although polyploid rice has shown great potential for improving yield and stress tolerance (Cornellie et al. 2019; Yu et al. 2021). Autotetraploid rice is a useful germplasm with large seeds, high nutrition, and stress tolerance, which is developed from whole genome duplication of diploid rice. However, polyploid rice has not been used for commercial production because of their low fertility. We have developed a series of neo-tetraploid lines, one of which is named Huaduo1 (H1), by repeated selfing and selection from the progenies of autotetraploid hybrids. Neo-tetraploid lines display normal morphological traits, high fertility, and the ability to overcome autotetraploid sterility (Guo et al. 2017; Chen et al. 2019; Ghaleb et al. 2020; Yu et al. 2020). It can be expected that fertile neo-tetraploid rice may serve as valuable germplasm for developing polyploid hybrid rice. Male sterile lines make great contributions to the development of hybrid rice, which requires deep understanding of the molecular basis of male reproductive development in polyploid rice.
In rice, the anther wall consists of 4 layers of parietal cells: epidermis, endothecium, middle layer, and tapetum. As the innermost layer of the anther closely surrounding male sex cells, the tapetum plays crucial roles in pollen development, and therefore tapetal development is under tight genetic control. More than 80 genes have been reported to regulate tapetal development, including CYP703A3 (CYTOCHROME P450 HYDROXYLASE 703A3), CYP704B2 (CYTOCHROME P450 HYDROXYLASE 704B2), PKS2 (POLYKETIDE SYNTHASE 2), PTC1 (PERSISTENT TAPETAL CELL 1), DPW (DEFECTIVE POLLEN WALL), OsTKPR1 (O. sativa TETRAKETIDE α-PYRONE REDUCTASE 1), SAW1 (SWOLLEN ANTHER WALL 1), and OsPDT1 (O. sativa PECTIN DEFECTIVE TAPETUM 1), which are involved in the tapetal biosynthesis of lipids, waxes, keratin, and other substances (Shi et al. 2015; Wang et al. 2020; Yin et al. 2022); OsC6 (O. sativa cDNA CLONE 6), OsABCG3 (O. sativa ATP BINDING CASSETTE G3), OsABCG15 (O. sativa ATP BINDING CASSETTE G15), OsABCG26 (O. sativa ATP BINDING CASSETTE G26), and EPAD1 (EXINE PATTERN DESIGNER 1), which act as transporters for material delivery from the tapetum to pollen mother cells (Zhang et al. 2010; Chang et al. 2016, 2018; Li et al. 2020a); DTC1 (DEFECTIVE TAPETUM CELL DEATH 1), OsMT2b (O. sativa METALLOTHIONEIN 2b), EAT1 (ETERNAL TAPETUM 1), OsHXK1 (O. sativa HEXOKINASE 1), and OsAGO2 (O. sativa ARGONAUTE 2), which are required for tapetal programmed cell death (Ji et al. 2013; Niu et al. 2013; Zhao et al. 2015; Zheng et al. 2019). The spatial and temporal expression patterns of key tapetal genes are important for pollen development. For example, at least 37 tapetal genes are specifically expressed in S7 to S10 anthers (Ji et al. 2013; Chang et al. 2016; Yang et al. 2017; Uzair et al. 2019). Precocious or delayed expression of these genes causes abnormal tapetal degradation and defective pollen wall development, and hence pollen sterility (Fu et al. 2014; An et al. 2020). To our knowledge, the transcription factors that have been reported to regulate tapetal gene expression are all transcriptional activators, including OsMYB80 (O. sativa MYB TRANSCRIPTION FACTOR 80, Han et al. 2021; Xiang et al. 2021; Zhang et al. 2022b), EAT1 (Ji et al. 2013; Niu et al. 2013), TIP2 (TDR INTERACTING PROTEIN 2, Fu et al. 2014), TDR (TAPETUM DEGENERATION RETARDATION, Li et al. 2006; Zhang et al. 2008), Udt1 (UNDEVELOPED TAPETUM 1, Jung et al. 2005), GAmyb (GIBBERELLIN- and ABSCISIC ACID—REGULATED myb, Ko et al. 2021), MADS3 (MADS BOX TRANSCRIPTION FACTOR 3, Hu et al. 2011; Zhang et al. 2015), OsBZR1 (O. sativa BRASSINAZOLE RESISTANT 1, Zhu et al. 2015), PTC1 (Li et al. 2011), OsAGO2 (Zheng et al. 2019), OsMADS8 (O. sativa MADS BOX TRANSCRIPTION FACTOR 8, Chen et al. 2018), AMD1 (ABERRANT MICROSPORE DEVELOPMENT 1, Zhang et al. 2022a; Zou et al. 2022), and OsUGE1 (O. sativa UDP-GLUCOSE EPIMERASE 1, Wang et al. 2023). However, the roles of repressive transcription factors in fine-tuning gene expression in the tapetum are rarely reported in rice of different ploidy.
Previously, we used the neo-tetraploid line, Huaduo1 (H1), as a system to identify the regulators of male fertility in polyploid rice. We demonstrated that loss of MOF1 (MORE FLORET1), which encodes a MYB transcription factor, caused delayed degeneration of the tapetum and middle layer of the anther as well as pollen defects and reduced seed setting (Lu et al. 2020). MOF1 is involved in the regulation of tapetal development and meiosis, and regulates those genes required for sporopollenin biosynthesis, such as CYP703A3 (encodes cytochrome P450 hydroxylase), OsABCG26 and OsABCG15 (encode 2 ATP binding cassette G transporters), PTC1 (encodes PHD-finger transcription factor), and PKS2 (encodes polyketide synthase) (Lu et al. 2020). Mutations of these genes cause complete male sterility, including PKS2, whose mutants show defective exine patterning and aborted pollen grains (Zhu et al. 2017; Zou et al 2018). Interestingly, MORE FLORET1 (MOF1) tended to inhibit gene expression as a transcriptional repressor (Ren et al. 2020; Li et al. 2020b), making it unique among the known tapetal transcription factors. However, it remains unclear whether MOF1 regulates anther development in a diploid background and how MOF1 achieves this at the molecular level in rice lines of different ploidy.
Here, we constructed mof1 mutant lines in diploid background, and generated tapetum-ectopically expressed lines as well. The anther defects, both in the mutants and in the ectopic expression lines, indicate the importance of fine-tuning MOF1 expression for normal anther development. We further identified PKS2, involved in pollen wall formation, as a direct target of MOF1. These results are expected to elucidate the molecular mechanism of the regulation during tapetal development by MOF1 and provide a gene resource for engineering male sterility lines in hybrid rice production.
Results
MOF1 regulates pollen fertility and seed setting
To verify the reproductive roles of MOF1, we generated mof1 mutants in diploid Nipponbare cultivar background (Nip, O. sativa ssp. japonica) by using the CRISPR/Cas9 system. Two homozygous lines with frameshift mutations in the targeted loci were identified (designated Nip-mof1-1 and Nip-mof1-2) (Fig. 1A). All Nip-mof1 mutants exhibited normal vegetative growth (Fig. 1D), while their seed setting rates (14.47% and 14.12%) were significantly lower than in the wild-type (77.76%, Fig. 1, B and E). The pollen fertility of Nip-mof1-1 (57.28%) and Nip-mof1-2 (41.02%) was significantly reduced compared to wild-type plants (90.05%, Fig. 1, C and F).
![Phenotypical analyses of Nip-mof1.A) A schematic diagram of the MOF1 gene. The sequences of CRISPR/Cas9 target sites were given with the protospacer adjacent motifs (PAMs) underlined. The resulting mutations were highlighted in red. The seed setting (B), pollen fertility (C), plant morphology (D), mature panicles (Empty grains were marked) (E) and pollen grains stained with I2/KI (F) of Nip and Nip-mof1 with the indicated genotypes. Bars = 20 cm (D), 1 cm (E) and 50 μm (F). Different lowercase letters indicate significant differences [P < 0.05, 1-way ANOVA, Lsd test]. The error bars indicate the Se with n ≥ 3.](https://oup.silverchair-cdn.com/oup/backfile/Content_public/Journal/plphys/195/3/10.1093_plphys_kiae145/1/m_kiae145f1.jpeg?Expires=1747875928&Signature=DdMtUn44RZiKsrIF6GEUlTHn0Hjf9j4-HzJwYSKUTCG-Hap-hr5YbP~y87pKAqT6CKHEtE9ByUqDxv8Y-rNV5K2v~jQVhyfiii4t~UTwgM5bgVD8sil8IRIOCFGFghAViCAjrc0pOAhzHtzisuU7~bYxWr4pU3FI3In1B024jVKoUqScqI3RvkRgghaM~lvX6JWl3tmtAg-eydVwKoQ19FcvfQUygoifNRKXxRqhtPGsQiAGDIBD~2Drz0JS39ql84e6a7QgE3kPLVdFQPzZP2nODJypxGR7Jx5Y2AFkjHqnOlsHK4JIZ-QKzaHZHxKEbK8LTf7H6vIC4e2cLT6AYg__&Key-Pair-Id=APKAIE5G5CRDK6RD3PGA)
Phenotypical analyses of Nip-mof1.A) A schematic diagram of the MOF1 gene. The sequences of CRISPR/Cas9 target sites were given with the protospacer adjacent motifs (PAMs) underlined. The resulting mutations were highlighted in red. The seed setting (B), pollen fertility (C), plant morphology (D), mature panicles (Empty grains were marked) (E) and pollen grains stained with I2/KI (F) of Nip and Nip-mof1 with the indicated genotypes. Bars = 20 cm (D), 1 cm (E) and 50 μm (F). Different lowercase letters indicate significant differences [P < 0.05, 1-way ANOVA, Lsd test]. The error bars indicate the Se with n ≥ 3.
To verify the linkage between Nip-mof1 mutation and its sterility, the Nip-mof1-2 mutant (as a female parent) was crossed with Nip to develop an F2 population. In the F2 population, the seed setting rates of plants with genotypes MOF1/MOF1 (MM, 81.23%) and MOF1/mof1 (Mm, 74.76%) are both significantly higher than in mof1/mof1 plants (mm, 37.57%) (Fig. 2, A and B). The 3 genotypes MM, Mm, and mm segregated with a 1:2:1 ratio in the F2 population (281 individuals, MM:Mm:mm = 61:151:69, χ2 = 2.02 < χ20.05 = 5.99) and F3 population (554 individuals, MM:Mm:mm = 141:281:132, χ2 = 0.41 < χ20.05 = 5.99) developed from Mm F2 individuals. Moreover, the Mm F2 individuals were backcrossed with Nip, and 27 (Nip × Mm) and 19 (Mm × Nip) BCF1 seeds were obtained. The segregation ratio between MM and Mm is 1:1 for both BCF1 populations, with Nip × Mm (MM:Mm = 13:14, χ2 = 0.04 < χ20.05 = 3.84) and Mm × Nip (MM:Mm = 8:11, χ2 = 0.47 < χ20.05 = 3.84) (Fig. 2C). In addition, a complementation transgenic line named Nip-mof1com was generated by transforming Nip-mof1-1 with a 4,997 bp MOF1 genomic DNA fragment fusing to an mVenus fluorescence tag (Supplementary Fig. S1). Pollen fertility of Nip-mof1com (89.70%) was similar to that of Nip (84.51%) and significantly higher than in Nip-mof1-1 (65.55%) (Fig. 2, D and E). These data indicate that MOF1 is essential for pollen development and seed production not only in tetraploid (Lu et al. 2020) but also in diploid rice.
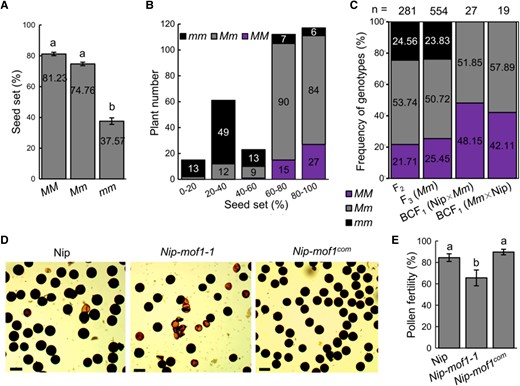
Genetic analysis of Nip-mof1.A) Average seed set of F2 individuals with different MOF1 alleles. B) Frequency distribution of seed set in the F2 population. C) The segregation rates of MOF1 alleles in analyzed F2, F3, and BCF1 populations. MM, plants with wild-type allele of MOF1; Mm, heterozygous mof1 plants; mm, homozygous mof1 plants. D) Pollen fertility of the indicated genotypes measured by I2/KI staining. E) Pollen grains of the indicated genotypes stained with I2/KI. Bars = 50 μm. Different lowercase letters indicate significant differences (P < 0.05, 1-way ANOVA, Lsd test). The error bars indicate the Se with n ≥ 3.
Consistent with previous studies (Ren et al. 2020; Li et al. 2020b), abnormally developed paleas, a quantitative disorder in anthers and lodicules were found in both tetraploid H1-mof1 and diploid Nip-mof1 mutants (Supplementary Figs. S2 to S4). Those abnormal spikelets were randomly distributed in the panicles of H1-mof1, with a frequency of 39.58% to 65.38% (Supplementary Fig. S5). Three types of palea (normal, large, or small) can be observed in H1-mof1 (Supplementary Fig. S2). The number of stamens was significantly increased in spikelets with large palea, but reduced in spikelets with small palea (Supplementary Fig. S6A), and increased in those with increased lodicules as well (Supplementary Fig. S6B). The number of lodicules was also significantly increased to a higher degree in spikelets with large palea than that with normal or small palea (Supplementary Fig. S6A). Regardless of palea types, H1-mof1 showed significant reduction in pollen viability compared to the wild-type (Supplementary Fig. S6, C and D). These results suggest that MOF1 plays independent roles in regulating reproductive development from its roles in regulating floral organ development.
MOF1 regulates degeneration of anther cell layers and pollen exine formation
We then examined reproductive defects of H1-mof1 and Nip-mof1 in detail via semi-thin resin sectioning. At anther Stage 6 (S6 stage), 4-layer cells of the anther wall were normally established in the mutants as in the wild-type, while aborted pollen mother cells (PMCs) with concentrated cytoplasm were observed (Supplementary Fig. S3, A1 to A4). During the S7 to S8b stages, the middle layer of H1 and Nip were degenerated into a thick-lined structure, whereas those in H1-mof1 and Nip-mof1 still kept a completely cellular shape until the S10 stage (Fig. 3, B to E), indicating the delayed degeneration of middle layers. Likewise, the degeneration of the tapetum in H1-mof1 and Nip-mof1 was obviously retarded as well. Tapetal cells in H1 and Nip began to form big vacuoles during S7 to S8b (Fig. 3, B1, C1, B3, and C3) and became thinner during S9 toS10 (Fig. 3, D1, E1, D3, and E3), manifesting characteristics of programmed cell death (PCD). By contrast, no signs of PCD were observed in the S7 to S9 tapetal cells of H1-mof1 and Nip-mof1 (Fig. 3, B2 to D2 and B4 to D4), though the tapetal cells swelled inward during S10 to S11 (Fig. 3, E2 and E4). In S12 anthers, normal pollen grains with full contents were formed in H1 and Nip, but large cavities were evident in H1-mof1 and Nip-mof1 pollen grains (Fig. 3, F1 to F4). These results indicate that MOF1 acts to ensure timely degeneration of both the middle layer and the tapetum.
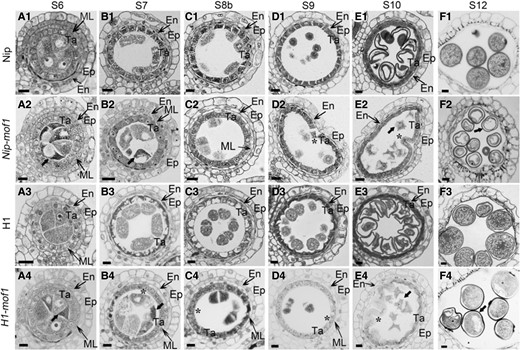
Anther development in mof1 mutants. Anther sectioning analyses of (A1 to F1) Nip, (A2 to F2) Nip-mof1, (A3 to F3) H1, and (A4 to F4) H1-mof1. S6 to S12 indicate anther stages. Black arrows indicate the abnormal male sex cells; *indicate the abnormally degenerated tapetal cells. Bars = 10 μm.
Transmission electron microscopy (TEM) was performed to further reveal the ultrastructure of anthers. In tapetal cells of S7 to S8 H1 anthers, signs of degeneration were obvious, including many small vesicles, large vacuoles, concentrated cytoplasm, and degenerating mitochondria (Fig. 4, A to C). At the same stages, the middle layer was degraded into a thin, dense cytoplasmic remnant without clear organelle structure (Fig. 4D). The endothecium cells with large vacuoles had visible plastids but no other organelles were seen (Fig. 4A). By contrast, tapetal cells of H1-mof1 mutant had few small vesicles, lightly stained cytoplasm, enlarged nuclei, and intact mitochondria (Fig. 4, E to G). The middle layer of the mutant still kept a relatively complete cell structure with large vacuoles and morphologically discernible mitochondria (Fig. 4H). The mutant had thickened endothecium with large vacuoles. The cytoplasmic reorganization of endothecium cells was not seen in the H1-mof1 mutant, which was otherwise obvious in the wild-type at the same stages (Fig. 4E). These results suggest delayed tapetum degeneration, delayed middle layer degeneration, and altered endothecium development in the H1-mof1 mutant.
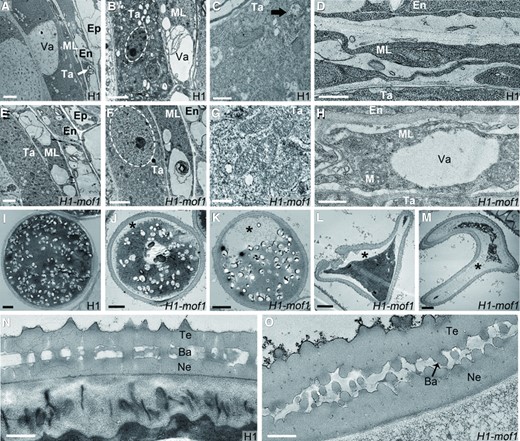
Ultrastructure of meiotic anthers and mature pollen grains in H1-mof1. (A to H) S7 to S8 anthers of H1 (A to D) and H1-mof1 (E to H). (I to M) Mature pollen grains of H1 I) and H1-mof1 (J to M). (N, O) Pollen wall of H1 N) and H1-mof1 (O). (B, F) White circles marked nuclear regions of tapetal cells in H1 (B) and H1-mof1(F). A) White arrows indicate visible plastids. C) Black arrows indicate mitochondria; J to M) * indicate decaying cytoplasm; O) black arrow indicates broken bacula. Bars = 2 μm (A, B, E, F), 5 μm (I to M), and 500 nm (C, D, G, H, N, O).
In the S12 anthers of H1, the mature pollen grains were filled with lipid and starch coated with well-organized pollen wall structure (Fig. 4, I and N). Lipid and starch were normally accumulated in the mature pollen grains of H1-mof1, but decaying cytoplasm was observed in the mutant pollen grains, which were partially empty or shrunken (Fig. 4, J to M). In H1-mof1, the tectum and nexine of the exine, the outer and tough part of pollen wall, were irregularly established, and their bacula were broken (Fig. 4O). Taken together, these results indicate that MOF1 regulates the stability of anther cell layers, which is essential for the exine formation of pollen grains.
MOF1 regulates expression of key tapetal genes
Next, we sought to identify genes targeted by MOF1 that are key for tapetal function. Previously, we identified 13 important tapetal genes via RNA-seq that are regulated by MOF1 (Lu et al. 2020). Of these 13 genes, 5 genes (CYP703A3, OsABCG26, PTC1, PKS2, and OsABCG15) were particularly characterized due to their strong phenotypes and substantial expression changes between the wild-type and mof1 mutant. Upto 35.29%, 90.63%, and 78.57% of cyp703a3, acbg26, and ptc1 CRISPR mutants were completely sterile, respectively (Supplementary Fig. S7A and Table S1). In cyp703a3, acbg26, and ptc1 mutants, the PMCs were abnormally degraded, while the degeneration of the tapetum and middle layer was retarded at S10 (Supplementary Fig. S7B). As a result, the anthers of cyp703a3, acbg26, and ptc1 produced no pollen grains (Supplementary Fig. S7, C and D).
We examined the time-course expression of these 5 genes and MOF1 during anther development. To do so, we collected developing anthers of H1 or the H1-mof1 mutant for real-time quantitative PCR (RT-qPCR). WE-CLSM (whole-mount eosin B-staining confocal laser scanning microscopy) was employed to determine the developmental stages of anther samples harvested (Supplementary Fig. S8). Consistent with previous results (Lu et al. 2020), MOF1 showed high expression in developing anthers at S7 and S8, then decreased drastically at S9, and were nearly shut down at S10 (Fig. 5A). Interestingly, these 5 genes exhibited opposite expression to MOF1 in the wild-type H1 anthers, with the lowest expression at S7, increased expression after S7, and peaked expression at S9 except for OsABCG26, which peaked at S8b (Fig. 5, B to F). Strikingly, all these 5 genes showed significant upregulation in H1-mof1 than in H1 from S8b to S10, with the most prominent increases at S8b and S9 (Fig. 5, B to F). Notably, the expression of PTC1, PKS2, and OsABCG15 in the S8b anthers of H1-mof1 was elevated to levels comparable to their respective peak levels in the S9 anthers of H1 (Fig. 5, D to F), indicating that these 3 genes were precociously activated by MOF1 mutation. These results suggest that MOF1 negatively regulates the expression of key tapetal genes and prevents their precocious activation during anther development.
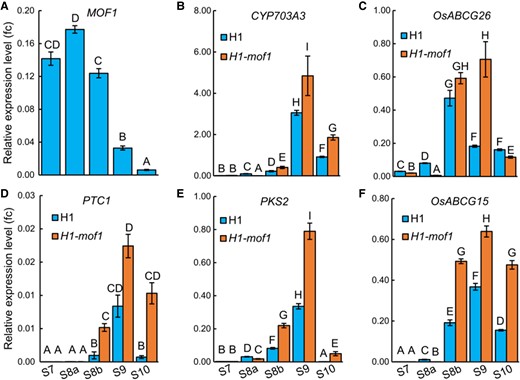
Expression analyses of MOF1 and key tapetal genes in developing anthers of H1 and H1-mof1. Expression levels of MOF1 (A), CYP703A3(B), OsABCG26 (C), PTC1 (D), PKS2 (E), and OsABCG15 (F) were analyzed using RT-qPCR in H1 and H1-mof1 S7 to S10 anthers. The error bars indicate the Sd with n = 3. Different uppercase letters indicate significant differences (P < 0.01, 1-way ANOVA, Lsd test).
Temporal ectopic expression of MOF1in the tapetum disrupts pollen development
To understand the important of the MOF1 expression pattern, transgenic lines of pEAT1::MOF1 were created, in which MOF1 was driven by a tapetum-enriched strong promoter of the EAT1 gene (Niu et al. 2013). EAT1 showed high expression in the anthers of S9 and S10, as reported (Fig. 6A; Niu et al. 2013), making the expression peak of MOF1 being delayed from S7 in the wild-type to S9 in pEAT1::MOF1 (Fig. 6B). RT-qPCR results confirmed MOF1 overexpression in the anthers of multiple independent pEAT1::MOF1 lines (Fig. 6C). The expression levels of MOF1 were negatively associated with seed setting rates in the pEAT1::MOF1 lines, which were only 0.13% to 49.71%, significantly lower than that in the wild-type (86.59%) (Fig. 6D). Although spikelets appeared normal, a large number of pollen grains in white-colored anthers were aborted in all pEAT1::MOF1 lines (Fig. 6, E and F; Supplementary Fig. S9A).
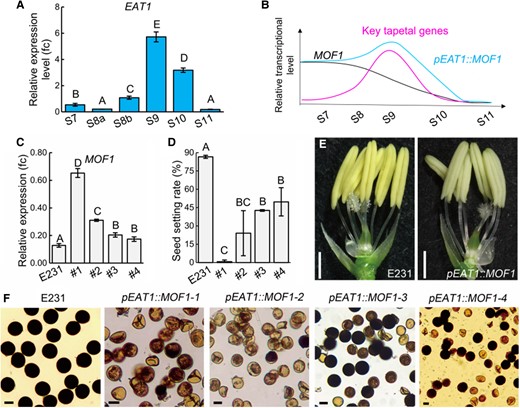
Temporal ectopic expression of MOF1 in the tapetum causes male sterility in rice. A) Expression levels of EAT1 were analyzed using RT-qPCR in H1 S7 to S11 anthers. B) Schematic diagram depicting expression patterns of MOF1, key tapetal genes, and pEAT1::MOF1. C) Expression levels of MOF1 in 4 independent pEAT1::MOF1 lines and the wild-type E231 control. D) Seed setting rates in 4 independent pEAT1::MOF1 lines and wild-type E231 control. E) Spikelets with lemmas and paleas removed (Bars = 0.5 mm). F) Mature pollen grains of the indicated genotypes stained with I2/KI (Bars = 20 μm). The error bars indicate the Sd (A, C) and Se D) with n ≥ 3. Different uppercase letters indicate significant differences (P < 0.01, 1-way ANOVA, Lsd test).
Anther sectioning and WE-CLSM observation were performed to analyze anther development of pEAT1::MOF1 lines in detail. In pEAT1::MOF1 lines, aborted PMCs with concentrated cytoplasm were observed in S6 and S7 anthers (Fig. 7, A and E, O, P). From S7 to S8b, tapetal cells in pEAT1::MOF1 showed delayed and weaker vacuolation and cell destruction than those in the non-transgenic recipient, E231 (Fig. 7, B to D and F to H), suggesting delayed tapetal degeneration in pEAT1::MOF1. Eventually, pEAT1::MOF1 produced aborted pollen grains (Fig. 7, K and N), resembling pks2 mutant phenotypes (Zhu et al. 2017; Zou et al. 2018). This suggests that pollen exine patterning might be defective in pEAT1::MOF1. These results indicate that the programmed reduction of MOF1 transcription level during S8 to S10 is required for normal anther development.
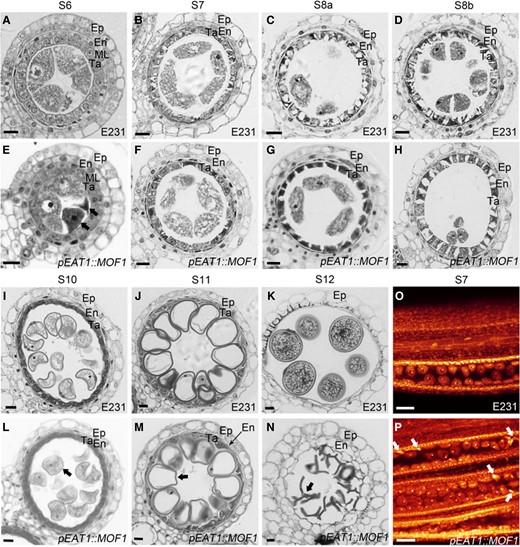
Anther development in pEAT1::MOF1.(A to D, I to K) Anther sectioning of E231 plants (the wild-type control). (E to H, L to N) Anther sectioning of pEAT1::MOF1 plants. Black arrows indicate abnormal male sex cells at the indicated anther stages. Black bars = 10 μm. (O, P) WE-CLSM observation of E231 O) and pEAT1::MOF1P) meiotic anthers. White arrows indicate degenerated male sex cells at the S7 anther. White bars = 40 μm.
MOF1 directly binds to the PKS2 promoter for repression
We examined the expression of CYP703A3, OsABCG26, PTC1, PKS2, and OsABCG15 in the developing anthers of pEAT1::MOF1 plants. WE-CLSM was also employed to determine the developmental stages of the anther samples (Supplementary Fig. S9B). MOF1 was overexpressed in pEAT1::MOF1 at all stages (Fig. 8A). However, no obvious difference was found in terms of CYP703A3 and OsABCG26 expression between E231 and pEAT1::MOF1 (Fig. 8, B and C), while PTC1 was evidently inhibited in the S7 to S8 anthers of pEAT1::MOF1 (Fig. 8D). OsABCG15 was significantly but only slightly reduced in S7 to S8 and S10 anthers (Fig. 8F). Strikingly, PKS2 expression was drastically decreased in S7 to S9 anthers of multiple independent lines of pEAT1::MOF1 compared to in those of the wild-type E231 (Fig. 8E; Supplementary Fig. S10). PKS2 is strongly expressed in the tapetum but not in other cell layers of the anther (Zhu et al. 2017; Zou et al. 2018), despite weak expression in microspores at later stages (Zhu et al. 2017). The EAT1 promoter has tapetum-specific activity (Ono et al. 2018). Taken together, these results suggest that MOF1 ectopic expression caused male sterility by repressing a subset of key tapetal genes, with PKS2 being the most substantially affected, while we do not rule out the possibility of PKS2 being also repressed in the microspores of pEAT1::MOF1.
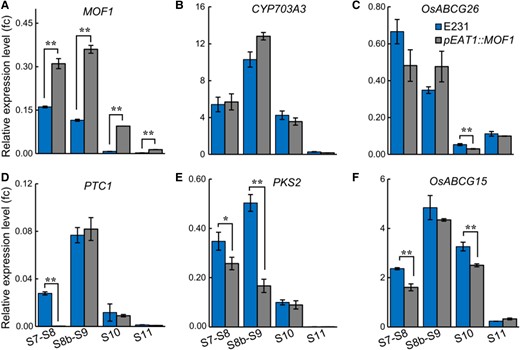
Expression analyses of key tapetal genes in the developing anthers of pEAT1::MOF1. Expression levels of MOF1A), CYP703A3B), OsABCG26C), PTC1D), PKS2E), and OsABCG15F) were analyzed using RT-qPCR in the S7 to S11 anthers of pEAT1::MOF1 and the wild-type E231 control. The error bars indicate the Sd with n = 3. * P < 0.05, ** P < 0.01, Student's t-test.
To identify the core motif recognized by MOF1, we then performed DNA affinity purification sequencing (DAP-seq) analysis. Two candidate motifs were identified from DAP-seq analysis, designated as Motif1 [GGAATRAAR (R = A/G)] and Motif2 [YTARWCCVWMWA (Y = C/T, R = A/G, W = A/T, V = G/A/C, M = A/C)], respectively (Fig. 9A). We found a number of Motif1 and Motif2 in the promoter of PKS2 (Fig. 9B). To test whether PKS2 is the direct target of MOF1, we performed the electrophoretic mobility shift assay (EMSA). The results showed direct binding of the GST-MOF1 recombinant protein to a probe fragment harboring 1 Motif1 and 1 Motif2 from PKS2-① (Fig. 9, B to D). GST-MOF1 caused electrophoretic mobility retardation of the probe, and the unlabeled cold competitor alleviated this retardation in a dosage-dependent manner (Fig. 9C), indicating a direct association of MOF1 with the probe. Furthermore, we split the probe sequence into 2 halves, with the first half (h1 fragment) and the second half (h2 fragment) containing Motif1 and Motif2, respectively (Fig. 9D, right panel). The unlabeled h2 but not h1 cold competitors abolished MOF1 binding with the probe (Fig. 9D, left panel). Once Motif2 was mutated, the unlabeled cold competitors lost the ability to compete with the probe for MOF1 binding (Fig. 9D, left panel). These results indicate that MOF1 directly recognizes and binds to Motif2 in the PKS2 promoter. We then tested the inhibitory effect of MOF1 on the PKS2 promoter with the LUC reporter system. Compared to GFP control, MOF1-GFP significantly repressed proPKS2-①::LUC reporter activity in luciferase imaging assay of Nicotiana benthamiana leaves (Fig. 9E). Taken together, these results indicate that MOF1 represses PKS2 expression by directly targeting Motif2 in the PKS2 promoter.
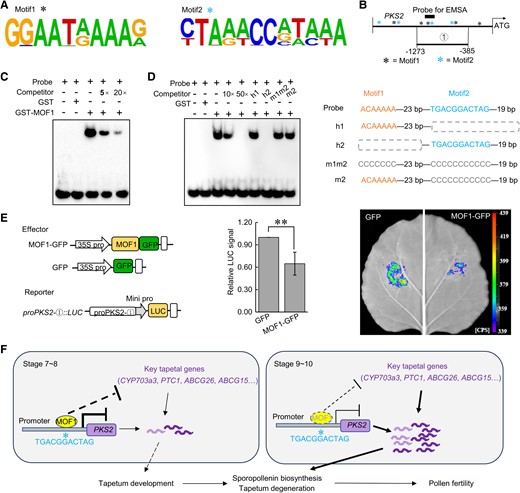
MOF1 directly binds the polyketide synthase2 promoter for transcriptional inhibition. A) Two candidate motifs (Motif1 and Motif2) identified from DAP-seq analysis. B) The schematic diagrams illustrating the distribution of Motif1/Motif2, the fragment used for the luciferase imaging assay and the probe used for the EMSA assay. C, D) EMSA assays for testing the interaction of GST-MOF1 with the PKS2 promoter. Probes and competitors are illustrated on the right. E) The luciferase imaging assay for testing MOF1 regulation of PKS2 promoter activity. The effector and reporter constructs are illustrated on the left. The experiments were done with 5 replicates and the results showed a similar trend. The representative image was shown on the right. LUC activity was measured and the mean ± Sd was plotted with n = 5. ** P < 0.01, Student's t-test. F) A working model depicting MOF1 regulation of pollen fertility in rice.
Discussion
MOF1 acts as a critical regulator for tapetal development in rice
Pollen development contains a series of important events, including tapetal degeneration and pollen exine formation. In this study, we presented findings on the crucial roles of MOF1, a MYB transcription factor, in tapetal degeneration and pollen wall formation. Phenotypic observations indicate that both mutations and ectopic expression of MOF1 result in low pollen fertility (Figs. 1 and 6). Anther sectioning and TEM analysis of MOF1 mutants reveal that loss-of-function mutations of MOF1 cause delayed degeneration of the tapetum and middle layer, and further affect pollen exine formation, which are similar to reproductive abnormalities in the mutants of 3 important tapetal genes (CYP703A3, OsABCG26, and PTC1) (Figs. 3 and 4; Supplementary Fig. S7). CYP703A3 (a cytochrome P450 hydroxylase), OsABCG26 (an ATP binding cassette G transporter), and PTC1 (a PHD-finger transcription factor) are key factors in regulating sporopollenin biosynthesis and pollen exine formation (Li et al. 2011; Yang et al. 2014; Zhao et al. 2015). In addition, mutations of MOF1 lead to up-regulation of most members in the sporopollenin biosynthesis pathway and exine formation pathway (Lu et al. 2020). In this study, we further verified the up-regulation of 5 members in S8 to S10 anthers of MOF1 mutants and identified the direct regulation of PKS2 by MOF1 (Figs. 5 and 9). Therefore, MOF1 plays a critical role in regulating tapetal development and function (sporopollenin biosynthesis and exine formation pathway) of rice.
MOF1 was found to regulate floral organ development (Ren et al. 2020; Li et al. 2020b). Here, we observed a high frequency of similar abnormalities in floral organs in both Nip-mof1 and H1-mof1 (Supplementary Figs. S2 to S4). In this study, temporal ectopic expression of MOF1 in the anthers of later stages caused pollen sterility with no effect on floral organ formation, indicating that MOF1 regulates anther development independently of its regulation of floral organ development (Fig. 6).
MOF1 acts as a transcriptional repressor to prevent the precocious expression of key tapetal genes
In rice, more than 80 important proteins involved in tapetal degeneration and exine formation have been identified, including PKS2, TKPR1, OsABCG26, OsABCG15, CYP703A3, CYP704B2, PTC1, and so on. Most tapetal genes are confined to a specific expression window by precise mechanisms during S7 to S10, which is required for normal tapetal behaviors and functions including timely cell death and exine formation (Ji et al. 2013; Zhao et al. 2015; Yang et al. 2017; Uzair et al. 2019). For example, premature expression of PTC1 in the tapetum causes complete pollen sterility (An et al. 2020). In this study, we present an example showing that the delicate expression pattern of MOF1 is crucial for anther development and function. We further identified the genes negatively regulated by MOF1, of which PKS2 is a direct target and its precocious expression is prevented by MOF1 (Figs. 5E, 8E, 9, Supplementary Fig. S10).
PKS2 encodes a key enzyme (polyketide synthase) catalyzing 16-hydroxyhexadecanoic-CoA into hydroxylated tetraketide α-pyrone, which is important for sporopollenin biosynthesis, Ubisch body patterning, and pollen exine formation (Zou et al. 2018; Yang et al. 2023). The product of PKS2 (hydroxylated tetraketide α-pyrone) is further converted by TKPR1 (a tetraketide α-pyrone reductase) into reduced hydroxylated tetraketide α-pyrone (Xu et al. 2019; Yang et al. 2023). PKS2 mutation causes delayed tapetal degradation, abnormal pollen exine formation, and male sterility (Zhu et al. 2017; Zou et al. 2018), somewhat resembling MOF1 ectopic lines. Interestingly, MOF1 mutation that leads to precocious PKS2 activation also results in tapetal degradation and abnormal pollen exine formation, suggesting that fine-tuning expression of both MOF1 and its target genes is essential for anther functions.
We propose a working model for the mode of action of MOF1 in regulating anther development (Fig. 9F). At early stages (S7 and S8) of anther development, MOF1 is highly expressed and prevents precocious activation of key tapetal genes like PKS2. The down-egulation of MOF1 at later stages (S9 and afterward) derepresses these key tapetal genes to promote programmed tapetal degeneration, sporopollenin biosynthesis, and pollen exine formation, which are essential for pollen fertility in rice.
A path to polyploid male sterile lines by temporal ectopic expression of MOF1
Male sterile lines are key to the development of hybrid rice breeding. Specific perturbation of fertility with no additional adverse effects is desired for breeding. In this study, we generated transgenic lines with MOF1 expression peak being delayed to the later anther stages, leading to the repression of key tapetal genes and, hence, impaired anther functions and male sterility, with no impacts on other traits, which provides an avenue for the creation of polyploid male sterile lines and development of polyploid hybrid rice.
Materials and methods
Plant materials
H1-mof1 was a mutant in neo-tetraploid rice (O. sativa) Huaduo1 (H1) background, which was created in our previous study (Lu et al. 2020). Mutants of cyp703a3, ptc1, and abcg26 were edited in the H1 background using CRISPR/Cas9. Nip-mof1 was generated in the Nipponbare (Nip, ssp. japonica) background using CRISPR/Cas9. The F1, F2, and F3 generations were generated from a cross using Nip-mof1 mutant as the female parent and the Nip as the male parent, and genotyping by specific markers (Supplementary Fig. S2). The BCF1 seedlings were generated from a cross between Nip and Nip-mof1 heterozygous plants from the F2 generation. pEAT1::MOF1 was generated with the EAT1 promoter driving MOF1 CDS in the E231 (Taichung 65, ssp. japonica) background.
Real-time quantitative PCR
RT-qPCR was performed as follows: Each sample was collected in 3 biological replicates and stored at −80 °C for RNA isolation (The collection standard is shown in Supplementary Table S2). The total RNA extraction, RNA reverse transcription, and RT-qPCR were examined as described (Wu et al. 2015). The Ubiquitin gene was used as an internal control and primers for RT-qPCR (Supplementary Table S3) were designed by Primer Premier 5.0 and NCBI Primer-Blast software. The relative expression of candidate genes in RT-qPCR was calculated by the 2−ΔCT method.
Cytological observations
Semi-thin resin sectioning, whole-mount eosin B-staining confocal laser scanning microscopy (WE-CLSM), and meiosis observation of pollen mother cells were performed as described (Lu et al. 2020). WE-CLSM was performed on Leica TCS SP2 under a 532 nm laser with emission range from 545 to 638 nm (intensity 52%, gain 659, scan speed 400 Hz).
Transmission electron microscopy (TEM) was employed to characterize the ultrastructure of the anther wall in H1 and H1-mof1. Meiotic anthers of H1 and H1-mof1 were fixed in 4% (w/v) glutaraldehyde with 2% (w/v) paraformaldehyde (pH 7.0) overnight at 4 °C, washed with 0.1 M phosphate buffer for 15 min (4 times), postfixed in 1% osmic acid (w/v, phosphate buffer) for 2–4 h, washed with 0.1 M phosphate buffer for 15 min (4 times), and dehydrated sequentially in 30%, 50%, 70%, 80%, 90%, 95%, and 100% (twice) ethanol (v/v) for 20 min. Then, the anthers were successively added to 4 penetrants (Acetone: resin = 3:1 for 4 h, 2:1 for 4 h, 1:1 for 8 h, 0:1 for 24 h, v/v). Then, anthers in pure resin were condensed under 70 °C. Ultrathin section and staining were finished by the Instrumental Analysis & Research Center of South China Agricultural University. Finally, samples were observed under a Talos L120C transmission electron microscope.
Plant transformation
CRISPR/Cas9 vectors (Cas9-MOF1, Cas9-CYP703A3, Cas9-OsABCG26, and Cas9-PTC1), targeting MOF1, CYP703A3, PTC1, and OsABCG26, were constructed as described (Ma et al. 2015). The EAT1 promoter (2,102 bp) and MOF1 CDS were PCR amplified from H1, fused together with an overlapping PCR, and combined into pCAMBIA1300 to construct pEAT1::MOF1. A 4,997 bp genomic sequence of MOF1 from upstream 1,313 bp to stop codon (not included) were PCR amplified from H1 and fused with the mVenus fluorescent protein gene in pCAMBIA1300 to construct pMOF1::MOF1-mVenus for genetic complementation. The agrobacterium (Agrobacterium tumefaciens) EHA105 harboring these constructs was transformed to rice calli for generating transgenic lines. Transgenic seedlings were planted at the experimental station (controlled field) of South China Agricultural University, Guangzhou, China.
DNA affinity purification sequencing
The coding sequence of MOF1 was cloned into the pGEX4T-1 vector to generate the GST-MOF1 construct. The expression and purification of GST and GST-MOF1 proteins were performed, as described (Li et al. 2017). We then constructed a DAP-seq library by combining the pull-down of GST (control) or GST-MOF1 recombinant protein and rice genomic library. About 6 GB raw data were obtained from each DAP-seq library via Illumina HiSeq operation instructions. The raw data was gone through quality control, alignment (reference genome, MSU7.0), and peak calling (Bartlett et al. 2017). Finally, motif identification and motif distribution were performed by using HOMER and FIMO tools (Grant et al. 2011).
Luciferase imaging assay
To analyze the transcriptional regulation of the PKS2-① promoter fragment by MOF1, an 889 bp fragment (−1,273 to −385 bp) from the PKS2 promoter was cloned into the pGreenⅡ 0800-LUC vector with a minimal 35S promoter to generate proPKS2-①::LUC. Then, proPKS2-①::LUC was co-transformed with 35S::MOF1-GFP or 35S::GFP into N. benthamiana leaves by agrobacteria infiltration. Luciferase activity was imaged under a luciferase imaging instrument at 48 h post infiltration. The primers used are listed in Supplementary Table S3.
Electrophoretic mobility shift assay
Labeled probes or unlabeled cold competitors with core MOF1 binding sites were generated by annealing synthetic ssDNA oligomers (Supplementary Table S3). The GST-MOF1 recombinant protein was used for EMSA, as described (Li et al. 2017). A charge-coupled device (CCD) camera was used to capture the images.
Accession numbers
Sequence data from this article for the cDNA and genomic DNA can be found in the RGAP database with the accession numbers: MOF1, LOC_Os04g47890; CYP703A3, LOC_Os08g03682; OsABCG26, LOC_Os10g35180; PTC1, LOC_Os09g27620; PKS2, LOC_Os07g22850; and OsABCG15, LOC_Os06g40550.
Acknowledgments
The authors thank Dr Zhixiong Chen, Dr Lan Wang, Ms Shuhong Yu, and other laboratory members for assistance in experiments and development of neo-tetraploid rice lines.
Author contributions
J.Z. and X.L. conceived of and designed the experiments. Z.L., L.Z., X.L., Q.L., J.W., Y.L., and G.L. performed the experiments and analyzed the data. Z.L., J.Z., X.L., S.H., and J.W. wrote the article. X.L. developed the neo-tetraploid rice, Huaduo1. All authors read and approved the final version of the manuscript. All authors have read and agreed to the published version of the manuscript.
Supplementary data
The following materials are available in the online version of this article.
Supplementary Figure S1. Molecular marker information for genotyping MOF1.
Supplementary Figure S2. Phenotypic analysis of spikelets in H1 and H1-mof1.
Supplementary Figure S3. Phenotypic analysis of floral organs in H1 and H1-mof1.
Supplementary Figure S4. Phenotypic analysis of floral organs in Nip-mof1.
Supplementary Figure S5. Distribution of abnormal floral organs in H1-mof1.
Supplementary Figure S6. Relationships among various phenotypes in H1-mof1 spikelets.
Supplementary Figure S7. Phenotypic analyses of cyp703a3, abcg26, and ptc1 mutants.
Supplementary Figure S8. Anther developmental stages with different floral lengths in H1.
Supplementary Figure S9. Spikelet morphology and anther developmental stages with different floral lengths in E231.
Supplementary Figure S10. Expression analysis of PKS2 in developing anthers of additional pEAT1::MOF1 lines.
Supplementary Table S1. Genotype analyses of cyp703a3, abcg26, and ptc1.
Supplementary Table S2. Details of samples collected for RT-qPCR.
Supplementary Table S3. Primers used in this study.
Supplementary Table S4. Details of constructs prepared in this work.
Funding
This work was supported by the National Key R&D Program of China (2023YFD1200802), project funded by China Postdoctoral Science Foundation (2022M721212), the Laboratory of Lingnan Modern Agriculture Project (NT2021001), the grants from the Guangdong Laboratory for Lingnan Modern Agriculture (NG2021005), the Double First-Class Discipline Promotion Project of Guangdong province (2021B10564001), and the Guangdong Provincial Pearl River Talent Plan (2021QN020536).
Data availability
The data underlying this article are available in the article and in its online supplementary material.
Dive Curated Terms
The following phenotypic, genotypic, and functional terms are of significance to the work described in this paper:
References
Author notes
The author responsible for distribution of materials integral to the findings presented in this article in accordance with the policy described in the Instructions for Authors (https://dbpia.nl.go.kr/plphys/pages/General-Instructions) is: Jingyi Zhang ([email protected]).
Conflict of interest statement. The authors declare that they have no competing interests.
