


Abstract
Tuberculosis meningitis (TBM) has high mortality and morbidity. Diagnostic delays can impact TBM outcomes. We aimed to estimate the number of potentially missed opportunities (MOs) to diagnose TBM and determine its impact on 90-day mortality.
This is a retrospective cohort of adult patients with a central nervous system (CNS) TB International Classification of Diseases, Ninth/Tenth Revision (ICD-9/10) diagnosis code (013*, A17*) identified in the Healthcare Cost and Utilization Project, State Inpatient and State Emergency Department (ED) Databases from 8 states. Missed opportunity was defined as composite of ICD-9/10 diagnosis/procedure codes that included CNS signs/symptoms, systemic illness, or non-CNS TB diagnosis during a hospital/ED visit 180 days before the index TBM admission. Demographics, comorbidities, admission characteristics, mortality, and admission costs were compared between those with and without a MO, and 90-day in-hospital mortality, using univariate and multivariable analyses.
Of 893 patients with TBM, median age at diagnosis was 50 years (interquartile range, 37–64), 61.3% were male, and 35.2% had Medicaid as primary payer. Overall, 407 (45.6%) had a prior hospital or ED visit with an MO code. In-hospital 90-day mortality was not different between those with and without an MO, regardless of the MO coded during an ED visit (13.7% vs 15.2%, P = .73) or a hospitalization (28.2% vs 30.9%, P = .74). Independent risk of 90-day in-hospital mortality was associated with older age, hyponatremia (relative risk [RR], 1.62; 95% confidence interval [CI], 1.1–2.4; P = .01), septicemia (RR, 1.6; 95% CI, 1.03–2.45; P = .03), and mechanical ventilation (RR, 3.4; 95% CI, 2.25–5.3; P < .001) during the index admission.
Approximately half the patients coded for TBM had a hospital or ED visit in the previous 6 months meeting the MO definition. We found no association between having an MO for TBM and 90-day in-hospital mortality.
Tuberculosis (TB) remains a global health problem, and elimination (defined as annual incidence of <1 case per 1 million persons) remains a distant goal, particularly after the sharp decrease in case reporting and treatment related to the coronavirus disease 2019 pandemic [1]. Nonetheless, TB incidence in the United States has progressively decreased in the last 10 years from 3.4 cases per 100 000 persons in 2011 to 2.4 per 100 000 persons in 2021, most likely a true reduction in incidence but also potentially due to missed diagnoses [2, 3].
Tuberculosis in the central nervous system (CNS) can manifest as meningitis, tuberculomas, brain abscesses, and spinal infection and continue to have high morbidity and mortality despite appropriate antimicrobial therapy. Although TB meningitis (TBM) represents <1% of all forms of TB in low-prevalence settings [4], more than 50% of cases develop severe neurologic deficits [5]. It is inarguably the most devastating clinical presentation of Mycobacterium tuberculosis, yet diagnostic delays are common due to low clinical suspicion, and current diagnostic tests still have a limited yield [6, 7]. Despite access to treatment, patients with TBM have approximately 5 times higher mortality risk compared to other forms of TB, with reported mortality rates as high as 19.3% in children, but up to >80% in adults with TBM caused by multidrug-resistant TB [8, 9].
Experience in diagnosing patients with TB is associated with the clinician's level of TB knowledge [10]. Hence, the decreasing incidence of TB in low-prevalence settings can lead to gaps in knowledge and awareness of the disease among clinicians, potentially contributing to delays in diagnosis [11]. This is supported by a study by Greenway et al [12], in which hospitals with low TB admission rates (≤3.3/10 000 persons-year) had a significantly higher proportion of missed pulmonary TB diagnoses compared to hospitals with intermediate and high TB admission rates (≥10/10 000 persons-year). Patients with pulmonary TB in hospitals with low TB admission rates also had a higher risk of death, and missed TB diagnoses were more common [11]. Older studies in the United States show that 5.1% of TB cases reported were diagnosed at death, and that older age and TBM were strongly associated with TB identified at death [13]. This phenomena has also been seen in large autopsy studies in other developed countries where up to 18%–67% of TB cases were missed while alive [14–16]. However, patients diagnosed at death often seek medical attention in the emergency department (ED) or are hospitalized before death, providing a missed opportunity (MO) in which this outcome could have been prevented.
Miller et al [17] used healthcare administrative data from California to look at missed opportunities to diagnose pulmonary TB, and they found that 25.7% of patients with pulmonary TB had presented to the ED or were hospitalized with a respiratory-related illness within 90 days before they were diagnosed. However, MOs to diagnose extrapulmonary TB and particularly TBM have not been characterized.
The aims of this study were to estimate the proportion of patients with potentially missed opportunities to diagnose TBM using population-based billing data, determine its impact on 90-day mortality and cost of healthcare utilization, and identify factors associated with increased risk of an MO and 90-day mortality.
METHODS
Patient Population
We created a retrospective cohort of patients coded for tuberculosis of the meninges and central nervous system (CNS) (International Classification of Diseases, Ninth Revision [ICD-9] code 013*, ICD-10 A17*) in any diagnosis position using the Healthcare Cost and Utilization Project (HCUP) State Inpatient Database (SID). The SID are census-level uniformly formatted databases available through the Agency for Healthcare Research and Quality (AHRQ) that consist of all-payer inpatient hospital discharge data within 1 year from all community acute-care hospitals in a participating state. The following states were included from the SID databases: California (2004–2011), New York (2005–2016), Florida (2005–2017), Nebraska (2005–2016), Iowa (2009–2015), Wisconsin (2013–2016), Vermont (2011–2016), and Arkansas (2008–2016). We also used the State Emergency Department Database (SEDD) to identify prior visits with a missed opportunity as defined below. For the SEDD, we included the following states: California (2005–2011), New York (2006–2016), Florida (2005–2017), Nebraska (2005–2010), Iowa (2010–2012), Wisconsin (2013–2016), Vermont (2011–2015), and Arkansas (2013–2014) (Supplementary Table 1). We limited the selection of states and years to those with an available, patient-level, encrypted identifier needed to follow hospitalizations over time for an individual. The states included represent approximately 30% of the total US population, and the databases contain information on primary and secondary diagnoses, procedures, demographics, length of stay, admission and discharge status, hospital charges, and payment sources. Due to the nature of the limited datasets, this study was considered exempt from Institutional Review board evaluation by the Washington University School of Medicine Human Research Protection Office.
To assemble the cohort, we only included patients who resided in the same state as the index TBM hospitalization and those who were not missing the encrypted identifier. We excluded patients diagnosed with TBM within the first year in each state where they were hospitalized, as well as new diagnoses in the last 6 months of the last year available from each state where they were hospitalized. This was to ensure a minimum of 1 year of retrospective data and 180 days of follow up (Supplementary Figure 1).
Definitions
The index visit was the first inpatient hospitalization in which the patient was coded for TBM. An MO was defined as the follows: (1) the patient had a previous ED visit or hospitalization in the 180 days before the index admission; and (2) TBM was not coded at any visit before the index admission; and (3) an ICD-9/10 diagnosis or procedure code for a MO. ICD-9/10 diagnosis or procedures codes included CNS procedures (eg, lumbar puncture), CNS symptoms (eg, altered mental status, headache), systemic illness suggestive of TB disease (eg, fever), a TB-mimic diagnosis (eg, sarcoidosis), or a prior non-CNS TB diagnosis (Supplementary Table 2).
A prior hospitalization that ended on the index admission date and lasted ≤7 days, or if the prior admission ended 1 day before the index admission date, lasted ≤7 days, and resulted in a transfer to the index hospitalization, were not considered an MO to decrease the possibility that a patient could have been tested for TBM and the results were not yet available before discharge. Comorbidities were identified (1) within 1 year before and (2) during the index hospitalization. We used (1) the Elixhauser classification for common comorbidities that have been shown to be good predictors of in-hospital mortality and (2) ICD-9/10 diagnosis and procedure codes to identify patients with solid organ transplantation, hematopoietic stem cell transplantation, and human immunodeficiency virus (HIV) [18]. Hospital facility costs were also analyzed for the index hospitalization using the HCUP cost-to-charge ratios to convert charges in the database to costs [19]. Costs were adjusted to 2019 US dollars using the medical care component of the Consumer Price Index (https://www.bls.gov/cpi/).
Based on the average TB incidence reported in the United States in 2019 (2.7 per 100 000 persons), we classified states as high (California, New York, and Florida) or low TB incidence (Nebraska, Iowa, Wisconsin, Vermont, Arkansas) [20].
Statistical Analysis
We calculated the proportion of patients with potential MO for TBM diagnosis. We performed univariate and multivariable analyses to evaluate the association between underlying conditions and (1) a potential MO for TBM and (2) 90-day all-cause in-hospital mortality. Chi-square and Fisher's exact tests were used for univariate analyses, as appropriate. Variables with P < .2 in univariate analysis or with clinical/biological plausibility were assessed in multivariable models. In the mortality model, MO was included regardless of significance to assess its impact. Multivariable generalized linear models (GLMs) using Poisson distribution and log link with robust standard errors were used to determine the independent association of potential risk factors for MO and for 90-day mortality. Relative risks (RRs) with 95% confidence interval were reported in GLMs. We estimated RRs rather than odds ratios because the outcomes of MO and 90-day mortality were not rare, and therefore the odds ratios did not approximate the RRs. All analyses were performed using SAS version 9.4 statistical software (SAS Institute Inc., Cary, NC).
Patient Consent Statement
Due to the nature of the limited datasets, the design of the work in this study was considered exempt from institutional review board evaluation by the Washington University School of Medicine Human Research Protection Office.
RESULTS
Cohort Characteristics and Potential Missed Opportunities for Diagnosis of Tuberculosis Meningitis
During the study period, we identified 893 patients coded for tuberculosis of the meninges and CNS during a hospitalization. The median age of TBM cases at diagnosis was 50 years (interquartile range [IQR], 37–64), 61.3% were male, and 35.2% had Medicaid listed as the primary payer (Table 1). Cases were more frequent in California (41%), Florida (31.8%), and New York (24.3%), compared to the other states (2.9%). The median length of stay of the index hospitalization for TBM was 16 days (IQR, 9–31), and the median crude facility cost in 2019 for the index hospitalization was US $45 704.49 (IQR, 22 511.7–89 504.58).
Baseline Characteristics of 893 Patients Diagnosed With Tuberculosis Meningitis During an Inpatient Hospitalization
| Characteristic | Frequency N = 893 (%) |
|---|---|
| Male sex | 547 (61.3) |
| Age Groups in Years | |
| 18–30 | 127 (14.2) |
| 30–40 | 147 (16.5) |
| 40–50 | 180 (20.1) |
| 50–60 | 159 (17.8) |
| 60–70 | 141 (15.8) |
| 70–80 | 91 (10.2) |
| >80 | 48 (5.4) |
| Race/Ethnicity | |
| White | 181 (20.3) |
| Black | 207 (23.2) |
| Hispanic | 221 (24.8) |
| Other/Missing | 284 (31.8) |
| Number of Patients by State | |
| California | 366 (41.0) |
| Florida | 284 (31.8) |
| New York | 217 (24.3) |
| Other Statesa | 26 (2.9) |
| Insurance | |
| Medicare | 229 (25.6) |
| Medicaid | 314 (35.2) |
| Private insurance | 231 (25.9) |
| Self-pay/other | 119 (13.3) |
| Median Household Income State Quartile | |
| 0–25th | 312 (34.9) |
| 26–50th | 205 (23.0) |
| 51–75th | 181 (20.3) |
| 76–100th | 159 (17.8) |
| Missing | 36 (4.0) |
| Number of Admissions 6 Months before TBM | |
| 0 | 579 (64.84) |
| 1 | 173 (19.37) |
| ≥2 | 141 (15.79) |
| Missed TBM opportunityb | 407 (45.6) |
| Lumbar puncture | 130 (14.6) |
| Non-CNS tuberculosis | 93 (10.41) |
| Meningitis, not specified | 76 (8.5) |
| Headache | 70 (7.8) |
Abbreviations: CNS, central nervous system; TBM, tuberculosis meningitis.
Nebraska, Iowa, Wisconsin, Vermont, and Arkansas.
Limited to codes present in ≥5% of cases.
Risk of Missed Opportunity During a Prior Hospital and/or Emergency Department Visit
In the 6 months before the TBM diagnosis, 407 (45.6%) patients had a hospital encounter meeting our definition of an MO: 273 (30.6%) during a hospitalization(s) and 134 (15%) only during a treat-and-release ED visit. The median number of prior hospital encounters per patient with an MO was 1, but this varied widely (1–20). Lumbar puncture (14.9%), non-CNS TB (10.41%), unspecified meningitis (8.5%), and headache (7.8%) were the most common MO diagnosis/procedure codes reported (Table 1). Receipt of a lumbar puncture before the index admission was similar between those with or without a prior non-CNS TB diagnosis (32.6% vs 34.1%, respectively; P = .78). The median adjusted cost in dollars (46 228.83 vs 44 989.31, P = .80) and length of stay in days (17 vs 16, P = .76) during the index TBM hospitalization was not different between those with and without a prior visit, respectively, meeting our definition of MO.
In univariate analysis, having an MO versus not having an MO was significantly associated with residing in states with a TB incidence rate above the national average (98.5% vs 95.9%, P = .02) and with CNS comorbidities, including depression (19.1% vs 8.8%, P < .001), paralysis (19.6% vs 9.8%, P < .001), psychosis (9.3% vs 4.9%, P = .01), and other neurological disorders (43.5% vs 28.8%, P < .001). In the MO group, deficiency anemias were also significantly more common compared to the non-MO group (52.8% vs 34.6%, P < .01) (Supplementary Table 3). When limiting to states where HIV status was known (excluding New York and Nebraska), people with HIV (PWH) were not associated with having an MO.
In the multivariable logistic regression analysis, several factors were independently associated with MO for TBM, including depression, paralysis, and deficiency anemias (Table 2).
Multivariable Regression Models of Risk Factors Associated With a Missed Opportunity and 90-Day In-Hospital Mortality in Patients With Tuberculosis Meningitis
| Variablea | Missed Opportunityb | 90-Day Mortalityc | ||
|---|---|---|---|---|
| RR (95% CI) | P Value | RR (95% CI) | P Value | |
| Deficiency anemiasd | 1.38 (1.33–1.69) | .001 | ||
| Depressiond | 1.38 (1.07–1.78) | .013 | ||
| Paralysisd | 1.39 (1.09–1.78) | .009 | ||
| Drug abused | 1.21 (.88–1.65) | .24 | ||
| Lymphomad | 1.33 (.87–2.03) | .19 | ||
| Age 60–70 yearse | 2.01 (1.01–4.01) | .047 | ||
| Age 70–80 yearse | 2.83 (1.39–5.77) | .004 | ||
| Age >80 yearse | 3.80 (1.73–8.31) | <.001 | ||
| Chronic kidney diseased | 1.66 (1.07–2.60) | .025 | ||
| Hyponatremiaf | 1.62 (1.10–2.39) | .014 | ||
| Mechanical ventilationf | 3.45 (2.25–5.29) | <.001 | ||
| Septicemiaf | 1.59 (1.04–2.45) | .034 | ||
| MO during prior ED visit in the past 6 months | 1.11 (.64–1.93) | .71 | ||
| MO during prior hospitalization in the past 6 months | 0.90 (.59–1.37) | .62 | ||
Abbreviations: CI, confidence interval; ED, emergency department; MO, missed opportunity; RR, relative risk.
Models were generated using a stepwise selection approach with entering in all variables with P < .2 in univariate analysis or a priori clinical/biological plausibility. Relative risk, 95% CIs, and P values are shown only for variables that were included in the final models.
Variables considered for the MO model were based on a priori clinical/biological plausibility (age, race, states above the average national TB incidence, primary payer, drug abuse, alcohol abuse, weight loss, chronic kidney disease, chronic pulmonary disease, median hospital admission, people with human immunodeficiency virus).
Variables considered for the 90-day in-hospital mortality model were based on a priori clinical/biological plausibility (age, primary payer, drug abuse, alcohol abuse, weight loss, chronic kidney disease, chronic pulmonary disease, noncentral nervous system tuberculosis, diabetes, liver disease, MO, MO in a treat-and-release emergency department visit).
Comorbidity within the 12 months before the index hospitalization with tuberculosis (TB) meningitis.
Reference age group was age 40–50 years.
Condition coded during the index hospitalization.
Risk of 90-Day In-Hospital Mortality
In the study period, 117 (13.1%) patients with TBM died during hospitalization within 90 days after the TBM diagnosis (Figure 1). In-hospital 90-day mortality was not different between those with and without a prior MO (12% vs 14%, respectively; P = .39). Similarly, mortality in those with an MO coded during an ED visit (13.7% vs 15.2%, P = .73) or a hospitalization (28.2% vs 30.9%, P = .74) was not different compared to those without MO, respectively. In univariate analysis, 90-day hospital mortality was significantly associated with a mean older age (60.1 vs 49.5 years, P < .001), hyponatremia (35% vs 18.7%, P < .001), septicemia (41.9% vs 12.8%, P < .001), clinical sepsis (37.6% vs 9.2%, P < .001), and receipt of mechanical ventilation (50.4% vs 12.4%, P < .001) during the index hospitalization. Multiple comorbidities, including weight loss (33.3% vs 18.8%, P < .001), coagulopathy (26.5% vs 10.1%, P < .001), peripheral vascular disease (12% vs 3.4%, P < .001), hypertension (65% vs 43.4%, P < .001), and congestive heart failure (21.4% vs 6.7%, P < .001) were also associated with increased 90-day hospital mortality risk (Supplementary Table 4). In states where HIV status was known, PWH was not associated with higher 90-day in-hospital-mortality.
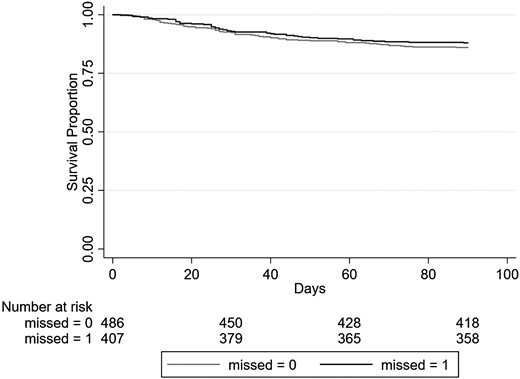
Survival curve for 90-day mortality of patients diagnosed with tuberculosis meningitis during an inpatient hospitalization, stratified by missed opportunity. Missed = 0, refers to not having a missed opportunity; missed = 1, refers to having a missed opportunity.
In the multivariable generalized linear model, several factors were independently associated with 90-day hospital mortality risk, including older age, hyponatremia, receipt of mechanical ventilation, and septicemia during the index TBM admission (Table 2).
DICUSSION
In our study, approximately half of the patients hospitalized with a diagnosis of TBM had an MO during an ED visit or hospital admission in the 6 months before their diagnosis. The overall 90-day in-hospital mortality rate of 13.1% was slightly lower than mortality rates reported in other TBM studies (19.3%–22.9%) [8, 21], but those studies assessed mortality for much longer durations. We did not find an association between having a potential MO for TBM and 90-day in-hospital mortality, regardless of whether the MO was coded during an ED visit or a hospitalization. The higher rates of septicemia and receipt of mechanical ventilation during the index hospitalization in those who died suggests that those patients likely presented at an advanced stage of their TBM disease. Furthermore, because part of the MO definition included those with a non-CNS TB diagnosis code in a prior hospital visit, some of these patients with an MO for TBM could have already been on TB antimicrobials at the time of the TBM diagnosis. This might explain the lower proportion of 90-day mortality in those with a prior MO, albeit this was not statistically significantly compared to those without a MO. Although our MO definition was very inclusive on signs and/or symptoms, diagnostic mimics, and CNS procedures, ICD coding precision can vary significantly and may have impacted our ability to identify an MO [22, 23].
The higher proportion of underlying neurological comorbidities, such as paralysis, depression, or psychosis in those with an MO, could represent misattribution of TBM symptoms to the patient’s underlying comorbidities. Diagnostic overshadowing, the process by which a person with a mental illness receives inadequate or delayed treatment due to misattribution of their physical symptoms to their mental illness, is well described for other conditions [24]. To avoid collinearity between some of the codes used to define an MO and some of the codes from the Elixhauser neurological comorbidity category, we did not include the latter in the multivariable model. Furthermore, receipt of a lumbar puncture, the most common MO procedure code, was not different between those with and without a non-CNS tuberculosis code in a previous visit, weakening the argument that an MO could have truly been an anticipated diagnosis pending mycobacterial cultures with a known long time to positivity [25]. However, the receipt of a lumbar puncture does suggest that there was recognition of possible meningitis, even if not due to TBM, consistent with delayed diagnosis and treatment of TBM [5, 6].
Similar to a large cohort of patients with TBM that were identified using administrative billing data [20], PWH in our study were not at increased risk for mortality. Although in our study only 20.6% of patients were PWH, subanalyses limited to states where HIV status was known (excluding the states of New York and Nebraska, where the HIV status is not provided for privacy reasons), we found no significant increased risk of having a MO or 90-day in-hospital mortality in PWH. In our study, 90-day in-hospital mortality was significantly associated with older age, particularly those aged 60 and older in the multivariable analysis, which is consistent with epidemiological trends in the United States where higher TB mortality is seen in the elderly and those foreign born [26]. Although over- and underdiagnoses are common in the elderly [27], in our study, age was not associated with increased risk of having an MO. To our surprise, we did not find an association between MO and healthcare-adjusted costs or length of stay during the TBM admission. This could be due to late presentation regardless of having an MO. This finding could also be explained by planned direct admissions after diagnostic procedures performed during a prior admission or outpatient visit became positive; something that might led to fewer diagnostic procedures being performed during the index TBM admission in those who had a MO. The finding that fluid and electrolyte abnormalities were associated with increased risk of 90-day hospital mortality in univariate analysis likely reflects disturbances secondary to TBM. Therefore, we explored hyponatremia during the index admission separately, because this is the most common electrolyte abnormality in hospitalized patients and a well known complication of TBM due to cerebral salt wasting or syndrome of inappropriate antidiuretic hormone, described in approximately half the patients with TBM [28, 29]. Hyponatremia was independently associated with 90-day mortality in our study, and it is also a known risk factor associated with in-hospital death in other CNS infections such as cryptococcal meningitis [30].
This is study has several limitations. First, it is a retrospective study using administrative data. However, our analysis was collected from 8 different states, comprising almost 30% of the country, with a wide variety of geographic regions with different TB incidence rates. Although, outpatient data were not available for this cohort, almost all patients with suspected meningitis will be admitted to the hospital for appropriate treatment even when the initial evaluation was done in ambulatory settings. In addition, the SID/SEDD datasets lack laboratory results and medications received. Hence, relevant microbiological information including multidrug resistance or TB therapy that might impact outcomes is lacking. Similarly, the dataset only captures in-hospital mortality within the state where the patient was diagnosed, which possibly underestimates the true 90-day death rate due to potentially missed outcomes on patients transferred out of state because they would have been lost to follow up in the SID datasets. Furthermore, those who died without receiving a diagnosis or those who were diagnosed post mortem may not have been included in the analysis.
CONCLUSIONS
In conclusion, in this large cohort of patients with TBM, 45.6% had a hospital or ED visit in the previous 6 months, and most of them had an MO as defined in this study. In multivariable analysis, we found that 90-day hospital mortality risk was associated with hyponatremia, mechanical ventilation, and septicemia, during the index admission, and older age. However, we did not find an association between having an MO for TBM and 90-day in-hospital mortality. Future large registry studies may help identify factors associated with diagnostic delays in TB meningitis.
Supplementary Data
Supplementary materials are available at Open Forum Infectious Diseases online. Consisting of data provided by the authors to benefit the reader, the posted materials are not copyedited and are the sole responsibility of the authors, so questions or comments should be addressed to the corresponding author.
Acknowledgments
Author contributions. All authors take responsibility for the accuracy of the data presented. CM-C and MAO contributed to study concept and design. NS, CM-C, JB, TCB, and MAO contributed to acquisition, analysis, or interpretation of data. NS, CM-C, and MAO contributed to drafting the manuscript. All investigators had full access to the data and had final responsibility for the decision to submit the manuscript for publication.
Disclaimer. No funding source had any role in the design or conduct of the study, collection, analysis, and interpretation of the data, or writing of the manuscript.
Financial support. Research reported in this publication was supported by the Washington University Institute of Clinical and Translational Sciences grant UL1TR002345 from the National Center for Advancing Translational Sciences of the National Institutes of Health (NIH).
References
Author notes
Potential conflicts of interest. MAO reports grants and personal fees from Pfizer and grants from Merck, outside the submitted work. CM-C reports a Centers for Disease Control and Prevention subaward, a vendor/individual agreement with Wayne State University, and serves as Associate Editor for Open Forum Infectious Diseases, outside the submitted work. CM-C reports research grants from the CDC and INSMED. The rest of the authors declare no conflicts of interest. Conflicts that the editors consider relevant to the content of the manuscript have been disclosed.


Comments