


Abstract
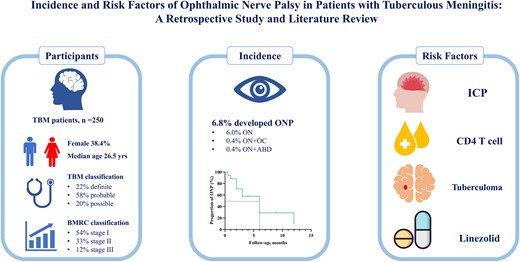
Tuberculous meningitis (TBM) can lead to ophthalmic nerve palsy (ONP), a severe neurological complication. This study aims to evaluates the incidence and risk factors for ONP in TBM patients.
This retrospective study included 250 TBM patients from the Shanghai Public Health Clinical Center (2013-2022). Clinical and imaging data were analyzed, with logistic regression identifying risk factors for ONP.
ONP occurred in 6.8% (17/250) of TBM patients. Those with ONP had higher intracranial pressure (ICP) (257.69 ± 68.12 mmH2O vs 191.65 ± 91.58 mmH2O; P = 0.012), cerebrospinal fluid protein levels, and a higher prevalence of tuberculomas (29.4% vs 10.7%; P = 0.039). Logistic regression identified pre-treatment ICP, CD4 percentage, and tuberculomas as significant risk factors. Linezolid use was a protective factor for ONP recovery.
Six point eight percent (17/250) of patients with TBM developed ONP as a complication. ICP, CD4 counts, and tuberculomas are key predictors. Linezolid shows potential as a therapeutic agent for improving outcomes in TBM patients with neurological complications, warranting further study.
The global health challenge posed by the tuberculosis (TB) epidemic persists as a serious concern. The World Health Organization's (WHO’s) Global TB Report indicates ∼10.6 million new TB cases globally in 2022 [1]. Tuberculous meningitis (TBM) is the most severe form of TB, often presenting significant complications, including epilepsy, movement disorders, and visual impairment [2–4]. Research has demonstrated that nearly 40% of TBM patients suffer from visual impairment, primarily stemming from optic and oculomotor nerve damage caused by inflammation or physical compression [5–8]. Despite the association of ophthalmic nerve palsy (ONP), a leading cause of visual impairment, with high mortality and disability rates in TBM patients, its symptoms are often difficult to detect and assess in a timely manner [5, 6]. Additionally, drug-induced vision problems complicate diagnosis, making it difficult to distinguish between treatment side effects and disease progression. Previously, treatment for TBM focused on reducing mortality, with less attention to long-term complications. However, with advances in medical care and the WHO's 2015 “End TB” strategy, which aims to reduce TB mortality by 95% by 2035, addressing long-term sequelae like ONP has become increasingly important [1–3]. This study aims to evaluate the clinical features, prognosis, and predictors of TBM in patients with ONP, comparing these findings with existing clinical evidence.
METHODS
Study Participants
This retrospective study included patients diagnosed with TBM at Shanghai Public Health Clinical Center from January 2013 to December 2022. Exclusion criteria were incomplete data, poor medication adherence, and other central nervous system infections. The study was approved by the Ethics Committee of Shanghai Public Health Clinical Center.
The data collected for analysis encompassed demographics, vital signs, symptoms, comorbidities, TBM scores, Glasgow Coma Scale (GCS) scores, and laboratory test results. Cerebrospinal fluid (CSF) samples were obtained for cell counts, chloride, glucose, protein levels, and cultures. Imaging modalities comprised chest x-rays/CT scans and brain MRIs. All enrolled patients were regularly followed up during the treatment period and for at least 6 months after the completion of treatment through outpatient visits, hospital readmissions, and telephone follow-ups.
TBM Diagnostic Criteria
Diagnosis of TBM was based on clinical criteria, CSF findings, neuroimaging, and other evidence related to tuberculosis. TBM was classified into 3 categories: “definite,” “probable,” and “possible” [9].
Definite TBM: Diagnosis was confirmed by the presence of Mycobacterium tuberculosis in CSF via methods such as acid-fast bacilli staining, culture, or commercial nucleic acid amplification tests.
Probable TBM: This diagnosis was made if the total score from the diagnostic criteria was ≥10 without neuroimaging or ≥12 with neuroimaging.
Possible TBM: Diagnosis was considered when the total score was between 6 and 9 without neuroimaging or 6 and 11 with neuroimaging.
TBM Grading Standards
The severity of TBM at admission was assessed using the British Medical Research Council (BMRC) grading system, which is based on GCS scores and focal neurological deficits [10]:
Grade I: GCS score of 15 with no focal neurological deficits.
Grade II: GCS score of 15 with focal neurological deficits or GCS score of 11–14.
Grade III: GCS score ≤10.
Ophthalmic Nerve Palsy Diagnostic Criteria
Ophthalmic nerve palsy, including optic nerve (CN II), oculomotor nerve (CN III), trochlear nerve (CN IV), and abducens nerve (CN VI) palsy, was diagnosed by clinical and neurology specialists based on clinical symptoms and signs, physical examination findings, laboratory tests, and imaging studies. This diagnosis excludes neuropathies caused by adverse reactions to antituberculosis medications.
Statistical Analysis
Data were analyzed using SPSS statistical software (IBM, version 25.0). The t test was used for normally distributed continuous variables, the nonparametric test for non–normally distributed variables, and the χ2 test or Fisher exact test for categorical variables. Time to event between different groups was described by Kaplan-Meier curves, and log-rank tests were used. Binary logistic regression was used to correct for risk factors. Factors showing a significant association (P < .1) in the univariate regression analysis were included in the multivariate analysis. All tests were 2-sided, with P < .05 indicating a statistically significant difference.
RESULTS
Demographic Data and Clinical Features
A total of 250 patients were enrolled in the study (Figure 1). Among the patients, 96 (38.4%) were female. Sixteen percent of patients had concurrent extracranial TB. The age of the patients was 26.50 (6.00–47.00) years. Fever was the most common symptom, reported by 74.4% of patients. At the time of onset, 45.2% of patients experienced headaches, and 22.0% presented with seizures. According to the BMRC classification, 136 patients were in Stage I, 83 in Stage II, and 31 in Stage III. Chest CT upon admission revealed miliary TB in 45 (26.6%) patients (Table 1). Based on the Marais scoring system, 56 (22.4%) patients were classified as definite TBM (22 confirmed by CSF culture and 30 by polymerase chain reaction), 145 as probable TBM, and 49 as possible TBM. Among the patients diagnosed with TBM, 17 (6.8%) had ONP. There were no significant differences in demographic characteristics, comorbidities, disease severity, or laboratory findings between patients with ONP and those without (Table 1).
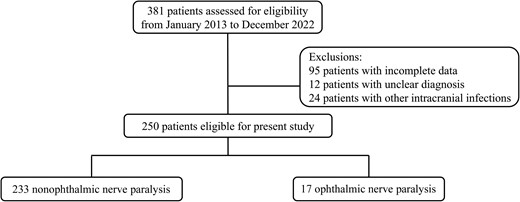
Study flowchart.
Demographic and Clinical Characteristics of Study Participants
| General (n = 250) | ONP (n = 17) | Non-ONP (n = 233) | P Value | |
|---|---|---|---|---|
| Clinical features | ||||
| Age, median (IQR), y | 26.50 (6.00–47.00) | 29.00 (12.00–42.00) | 26.00 (6.00–48.00) | .731 |
| Female, No. (%) | 96 (38.4) | 6 (35.3) | 90 (38.6) | .785 |
| Urban dwelling, No. (%) | 117 (46.8) | 9 (52.9) | 108 (46.4) | .599 |
| BMI, mean ± SD, kg/m2 | 20.53 ± 5.82 | 21.51 ± 5.86 | 20.44 ± 5.83 | .578 |
| Symptoms, No. (%) | ||||
| Cough | 62 (24.8) | 1 (5.9) | 61 (26.2) | .080 |
| Fever | 186 (74.4) | 12 (70.6) | 174 (74.7) | .774 |
| Headache | 113 (45.2) | 13 (76.5) | 100 (42.9) | .007 |
| Nausea and vomit | 83 (33.2) | 6 (35.3) | 77 (33.0) | .849 |
| Altered consciousness | 92 (36.8) | 5 (29.4) | 87 (37.3) | .513 |
| Seizures | 55 (22.0) | 4 (23.5) | 51 (21.9) | .999 |
| Delay of diagnosis, median (IQR), d | 22.00 (13.00–32.00) | 21.00 (8.50–33.00) | 22.00 (13.00–31.50) | .529 |
| Comorbidity, No. (%) | ||||
| HIV positive | 14 (5.6) | 3 (17.6) | 11 (4.7) | .060 |
| Extracranial TB | 40 (16.0) | 2 (11.8) | 38 (16.3) | .999 |
| Miliary TB | 45 (26.6) | 5 (41.7) | 40 (25.5) | .307 |
| Hypertension | 21 (8.4) | 1 (5.9) | 20 (8.6) | .999 |
| Diabetes mellitus | 16 (6.4) | 0 (0) | 16 (6.9) | .610 |
| Hepatitis | 7 (2.8) | 1 (5.9) | 6 (2.6) | .393 |
| Diagnostic category, No. (%) | ||||
| Definite TBM | 56 (22.4) | 4 (23.5) | 52 (22.3) | .719 |
| Probable TBM | 145 (58.0) | 11 (64.7) | 135 (57.9) | |
| Possible TBM | 49 (19.6) | 2 (11.8) | 46 (19.7) | |
| BMRC staging, No. (%) | ||||
| Grade I | 136 (54.4) | 9 (52.9) | 127 (54.5) | .612 |
| Grade II | 83 (33.2) | 7 (41.2) | 76 (32.6) | |
| Grade III | 31 (12.4) | 1 (5.9) | 30 (12.9) | |
| Blood tests | ||||
| HB, mean ± SD, mg/L | 117.65 ± 22.88 | 126.88 ± 17.22 | 117.02 ± 23.11 | .096 |
| WBC, median (IQR), ×109/L | 6.68 (4.82–9.66) | 6.97 (4.80–10.58) | 6.65 (4.82–9.66) | .888 |
| Neutrophils, median (IQR), ×109/L | 4.24 (2.63–6.77) | 5.54 (2.64–7.03) | 4.20 (2.63–6.77) | .669 |
| Lymphocytes, median (IQR), ×109/L | 1.23 (0.70–2.24) | 1.11 (0.87–2.47) | 1.23 (0.68–2.24) | .924 |
| Serum sodium, mean ± SD, mmol/L | 134.63 ± 14.28 | 134.00 ± 5.76 | 134.67 ± 14.70 | .856 |
| Serum chloride, mean ± SD, mmol/L | 99.24 ± 9.61 | 98.87 ± 5.65 | 99.27 ± 9.83 | .873 |
| ESR, median (IQR), mm/h | 14.00 (6.00–36.75) | 21.50 (6.00–74.00) | 13.00 (5.75–36.25) | .263 |
| C-reaction protein, median (IQR), mg/L | 6.11 (2.75–21.05) | 1.35 (0.63–13.86) | 6.11 (3.02–21.20) | .146 |
| Albumin, mean ± SD, g/L | 38.87 ± 10.37 | 39.08 ± 5.35 | 38.85 ± 10.64 | .934 |
| CD4 absolute count, median (IQR) | 377.00 (164.97–654.00) | 463.15 (37.00–650.50) | 372.00 (178.75–656.25) | .372 |
| CD4%, median (IQR) | 36.00 (24.00–43.00) | 27.00 (6.25–38.80) | 36.45 (26.88–44.00) | .014 |
| T-SPOT/QFT positive, No. (%) | 91 (36.4) | 9 (52.9) | 111 (47.6) | .673 |
Abbreviations: BMI, body mass index; BMRC, British Medical Research Council; ESR, erythrocyte sedimentation rate; HB, Hemoglobin; IQR, interquartile range; ONP, ophthalmic nerve palsy; T-SPOT/QFT, T-SPOT.TB or QuantiFERON-TB; TB, tuberculosis; TBM, tuberculous meningitis; WBC, white blood cell count.
CSF and MRI Examination
On admission, patients with ONP had significantly higher ICP compared with those without ONP (257.69 ± 68.12 mmH2O vs 191.65 ± 91.58 mmH2O; P = .012). Elevated CSF protein levels (>600 mg/L) were observed in 62.4% of patients. ONP patients had higher CSF protein levels (1702.00 [963.70–3074.75] mg/L vs 967.45 [513.50–1708.73] mg/L; P = .016) and a greater CSF white blood cell count (116.00 [40.00–206.00] cells/µL vs 27.50 [5.00–101.00] cells/µL; P = .003). Brain MRI revealed tuberculomas in 30 (12.0%) patients, with a higher prevalence in the ONP group (29.4% vs 10.7%; P = .039). No other significant differences in CSF parameters or MRI findings were noted between patients with and without ONP (Table 2).
CSF Parameters and MRI Findings of the Study Participants
| General (n = 250) | ONP (n = 17) | Non-ONP (n = 233) | P Value | |
|---|---|---|---|---|
| CSF tests | ||||
| Intracranial pressure, mean ± SD, mmH2O | 196.67 ± 91.55 | 257.69 ± 68.12 | 191.65 ± 91.58 | .012* |
| CSF total WBC, median (IQR), 106/mL | 30.00 (5.50–112.00) | 116.00 (40.00–206.00) | 27.50 (5.00–101.00) | .003* |
| CSF protein, median (IQR), mg/L | 1006.90 (561.00–180.00) | 1702.00 (963.70–3074.75) | 967.45 (513.50–1708.73) | .016* |
| CSF sugar, median (IQR), mmol/L | 2.30 (1.52–3.13) | 2.22 (1.35–3.39) | 2.30 (1.52–3.11) | .946 |
| CSF chloride, mean ± SD, mmol/L | 115.64 ± 11.29 | 112.46 ± 6.51 | 115.90 ± 11.56 | .242 |
| CSF ADA, median (IQR), U/L | 3.35 (1.00–10.85) | 6.00 (1.00–7.40) | 3.00 (1.00–11.00) | .709 |
| CSF LDH, median (IQR), U/L | 40.50 (23.00–74.50) | 52.50 (33.75–104.00) | 39.00 (23.00–71.50) | .240 |
| Pandy test (+), No. (%) | 172 (68.8) | 14 (82.4) | 158 (67.8) | .212 |
| Culture positive for AFB, No. (%) | 29 (13.7) | 1 (6.3) | 28 (14.3) | .703 |
| Positive PCR (GeneXpert), No. (%) | 33 (24.6) | 4 (40.0) | 29 (23.4) | .261 |
| MRI abnormalities, No. (%) | ||||
| Infarction | 36 (14.4) | 4 (23.5) | 32 (13.7) | .280 |
| Tuberculoma | 30 (12.0) | 5 (29.4) | 25 (10.7) | .039* |
| Hydrocephalus | 46 (18.4) | 4 (23.5) | 42 (18.0) | .526 |
| Intracerebral hemorrhage | 3 (1.2) | 0 (0) | 3 (1.3) | .999 |
| Meningeal enhancement | 29 (11.6) | 1 (5.9) | 28 (12.0) | .702 |
| Ventricular enlargement | 42 (16.8) | 4 (23.5) | 38 (16.3) | .498 |
Abbreviations: ADA, adenosine deaminase; AFB, acid-fast bacillus; CSF, cerebrospinal fluid; IQR, interquartile range; LDH, lactate dehydrogenase; MRI, magnetic resonance imaging; ONP, ophthalmic nerve palsy; PCR, polymerase chain reaction; WBC, white blood cell count.
*P < .05.
Prevalence of ONP
In this cohort, the prevalence of visual disturbances due to ophthalmic nerve involvement was 6.8%, including isolated optic nerve palsy (6.0%), optic nerve combined with oculomotor nerve palsy (0.4%), and optic nerve combined with abducens nerve palsy (0.4%). At the time of first admission, the main symptoms in patients with ONP were headache in 13 (76.5%) patients and fever in 12 (70.6%) patients. The most common clinical signs included neck stiffness in 41.2% of patients and altered consciousness in 29.4%. After a follow-up period of 5.48 ± 3.96 months, 13 patients demonstrated recovery in visual disturbances. The Kaplan-Meier survival analysis revealed a median survival time of 6 months, indicating that half of the patients with ONP achieved visual recovery by the end of 6 months of antituberculous treatment (Figure 2). Subgroup comparisons based on age and disease severity revealed no statistically significant differences (all P > .05).
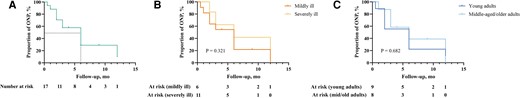
Kaplan-Meier survival curve for proportion of ophthalmic nerve palsy patients. A, The overall survival curve represents the cumulative proportion of ONP patients who experienced recovery over the follow-up period. B, Kaplan-Meier survival analysis comparing ONP recovery between mildly ill (GCS ≤ 8) and severely ill (GCS > 8) patients. C, Kaplan-Meier survival analysis comparing ONP recovery between young adults (age < 30 y) and middle-aged/older adults (age ≥ 30 y). Abbreviations: GCS, Glasgow Coma Scale scores; ONP, ophthalmic nerve palsy.
Assessment of Factors Associated With Ophthalmic Nerve Palsy
Univariate analysis identified pretreatment body temperature, heart rate, respiratory rate, meningeal irritation signs, hyperglycemia, ICP, tuberculomas, coexisting pulmonary tuberculosis, prothrombin time, and CD4% as factors potentially associated with ONP (P < .1). Multivariate logistic regression analysis revealed that ICP, CD4%, and the presence of tuberculomas were independently associated with ONP (Table 3). Logistic regression analysis suggested that the use of linezolid might be associated with the recovery of ophthalmic nerve function, with an odds ratio (OR) of 16.500 (95% CI, 1.088–250.176; P = .043). After further adjustment for sex, the association remained statistically significant (OR, 16.360; 95% CI, 1.004–266.666; P = .050).
Univariate and Multivariate Analysis of Factors Associated With Ophthalmic Nerve Paralysis
| Univariate | Multivariate | |||
|---|---|---|---|---|
| Variable | OR (95% CI) | P Value | OR (95% CI) | P Value |
| Temperature | 1.854 (0.978–3.516) | .059 | ||
| Heart rate | 0.96 (0.925–0.997) | .032 | ||
| Respiratory rate | 0.816 (0.659–1.010) | .062 | ||
| Meningeal irritation sign | 3.960 (1.413–11.099) | .009 | ||
| Blood glucose | 1.134 (0.987–1.304) | .076 | ||
| Intracranial pressure | 1.008 (1.002–1.014) | .010 | 1.012 (1.002–1.023) | .022* |
| Tuberculoma | 3.467 (1.128–10.654) | .030 | 78.047 (2.262–2693.312) | .016* |
| Pulmonary TB | 0.350 (0.125–0.978) | .045 | ||
| Prothrombin time | 0.626 (0.367–1.067) | .085 | ||
| CD4% | 0.945 (0.907–0.985) | .007 | 0.880 (0.793–0.977) | .016* |
Abbreviations: CD4, CD4 T-cell count; OR, odds ratio, TB, tuberculosis.
*P < .05.
Additionally, among the 250 patients, 7 (2.8%) experienced vision deterioration attributed to drug-related effects, confirmed after ophthalmologists ruled out organic lesions. These patients were on a regimen that included ethambutol, and 2 of them were also receiving linezolid. Prompt identification and discontinuation of the offending drugs led to an improvement in vision. At 6 months, the survival rate was 86.4% (216/250) for the entire cohort and 88.2% (15/17) for the ONP group.
Literature Review
We reviewed papers in PubMed and Google Scholar using the keyword “tuberculous meningitis” AND (“cranial nerve palsy” OR “optic nerve” OR “blurred vision”). Among the papers published since 1960, only English articles were reviewed, and cases of optic nerve damage due to drugs or other causes were excluded. Based on the search results, Table 4 summarizes the clinical and imaging features from these documents.
Summary of Literature Review Reporting Ophthalmic Nerve Paralysis in Patients With TBM
| Studies | Publication Types | Study Region | Cases and Gender | Age, y | ONP/TBM | Symptoms | Extracranial TB | Definite/Probable/Possible TBM | BMRC I/II/III | CSF Protein, mg/L | MRI Abnormalities | Prognosis | Main Finding | |
|---|---|---|---|---|---|---|---|---|---|---|---|---|---|---|
| 1 | An Wen et al. [7] | Retrospective case–control study | China | 69 M/45F | 37.25 ± 0.94 (CNP group) | 38/114 (33.3%) | Headache (78.9%) and stiff neck (73.7%) | 23 (60.5%) | 8/20/10 | 8/12/18 | 133.6 ± 59.5 | Meningeal reinforcement 74 (66.1%), cerebral infarction 57 (50.4%) | 3-mo follow-up: 3 deaths, 30 cases of complete recovery, 3 cases of no change in vision, 2 cases of worsening vision | CNP occurred in 33.3% of TBM patients, predominantly affecting the oculomotor, optic, and abducens nerves |
| 2 | Xuelian Li et al. [6] | Retrospective cohort study | China | 252 M/234F | 34.8 ± 16.7 (CNP group) | 67/414 (16.2%) | Headache (90.3%) and fever (90.3%) | 68 (94.4%) | 5/50/17 | 36/17/19 | 105.7 (71.2–156.9) | Meningeal enhancement 22 (38.6%), tuberculoma 36 (63.2%) | 2-mo follow-up: 65/67 (97.0%) fully recovered | In Beijing, the incidence of TBM with CNP is 14.8%, primarily affecting the oculomotor and optic nerves, with most cases responding to antituberculous treatment |
| 3 | Kunyi Li et al. [8] | Retrospective cohort study | China | 87 M/69F | 41 (16–82) | 28/154 (18.2) | Headache (>80%) and fever (>80%) | 35 (59.3%) in poor prognosis group, 46 (48.4%) in favorable prognosis group | 18/98/42 | 72/72/10 | Poor prognosis group: 2380 (1570–2540), favorable prognosis group: 1600 (940–2730) | Cephalomeningitis 73 (58.4%), tuberculomas 59 (42.1%) | / | In Western China, 31% of TBM patients experience poor outcomes, predicted by limb weakness, GCS scores, CNP, and hydrocephalus |
| 4 | Ali Moghtaderi et al. [11] | Retrospective case–control study | Iran | 64 M/45F | 41.1 ± 22.3 | CNP in 38 (34.9%) patients, with ONPs not separately specified | Stiff neck (75.2%) and loss of consciousness (51.0%) | / | / | / | / | Stroke 32 (29.9%) | / | CNP were the independent neurological predictor factor to differentiate TBM from ABM |
| 5 | Aaron S et al. (2010) | Retrospective cohort study | India | 84 M/79F | 33.3 ± 1.12 | 23/163 (14.1%) | Blind (82%) | 0 | / | 0/13/23 | 282.9 ± 5.6 | Basal arachnoiditis 20/23 (87.0%), hydrocephalus 11/23 (47.8%) | 6-mo follow-up: 4 improved vision, 5 worsened vision, 12 no significant change | Optochiasmatic arachnoiditis caused visual impairment in 14% of TBM patients, with female sex, age <27 y, and CSF protein content >260 mg being predisposing factors |
| 6 | Manish Kumar Sinha et al. [12] | Retrospective cohort study | India | 59 M/42F | 30 ± 13 | 27/101 (26.7%) | Fever, weight loss, headache, and/or vomiting (100%) | / | 39/40/32 | 21/39/41 | 100% abnormal | Meningeal enhancement 94 (93.1%), tuberculoma 38 (37.6%) | 6-mo follow-up: 13 patients (12.9%) expired, 74 patients (84.1%) no change in vision, 7 patients (8.0%) improved vision, 7 patients (8.0%) worsened vision | Vision impairment occurred in one-fourth of patients with TBM, primarily due to optochiasmatic arachnoiditis and optochiasmal tuberculoma |
| 7 | Kalita J. et al. [13] | Retrospective cohort study | India | 38 M/27F | 33.2 (13–80) | CNP in 38 (34.9%) patients, with ONPs not separately specified | / | 17 | / | 14/15/36 | / | Hydrocephalus 30/59 (50.8%), tuberculomas 20/59 (33.9%) | 1-y follow-up: optic atrophy in 24 (37%) | At 1 y, 78.5% of TBM patients had neurological sequelae, including cognitive impairment, motor deficits, and optic atrophy (37%) |
Abbreviations: ABM, acute bacterial meningitis; BMRC, British Medical Research Council; CNP, cranial nerve palsy; CSF, cerebrospinal fluid; F, female; M, male; ONP, ophthalmic nerve paralysis; TB, tuberculosis; TBM, tuberculous meningitis.
Based on the literature, headache (>70%) and fever (>60%) are the most common symptoms in TBM patients with ONP involvement [5–7, 13]. The oculomotor, optic, and abducens nerves (CN III, II, and VI) are the most frequently affected cranial nerves in TBM [5–7, 12].
Cranial nerve palsy is more common in TBM patients compared with those with other types of meningitis (TBM vs other meningitis: 38 [35.5%] vs 39 [21.1%]; P = .006), occurring in more than one-third of TBM patients, particularly affecting nerves related to eye movement [11]. It was proven to be an independent neurological predictor distinguishing TBM from other causes of meningitis (adjusted OR, 1.980; 95% CI, 1.161–3.376; P = .006) [11]. A study revealed that cranial nerve palsy is an independent predictor of poor prognosis in TBM (OR, 3.95; 95% CI, 1.19–13.25; P = .024) [8].
The prognosis for vision recovery varies significantly by region. In India, where TBM with cranial nerve palsy is highly prevalent, 1 study of 88 surviving TBM patients found that one-quarter experienced visual impairment [12]. The main causes of vision decline were optochiasmatic arachnoiditis and tuberculomas. Cumulative survival analysis showed that patients with impaired vision (acuity <6/18) had more frequent deaths and severe disability compared with those with normal vision (P = .04) [12]. After treatment, vision remained unchanged in 74 cases (84.1%), it improved in 7 cases (8.0%), and visual impairment was a predictor of death or severe disability. This heavy burden of optic nerve involvement may be related to the relatively long delay in diagnosis (51 ± 52 days) [12]. Another report found that among 65 TBM survivors, 51 (78.5%) had neurological sequelae within 1 year, including visual impairment (37%) and other cranial nerve palsies (23%) [13].
DISCUSSION
Our study provides valuable insights into the incidence and risk factors associated with ONP in patients with TBM. The identification of pretreatment intracranial pressure, CD4%, and tuberculomas as significant risk factors underscores the need for prompt and comprehensive management of TBM to mitigate neurological complications.
Visual impairment, either partial or complete loss of vision, is a common disabling complication of TBM, with studies reporting occurrence rates close to 50% and permanent residual visual loss in >10% of survivors following completion of antituberculous therapy [14]. TBM can affect all structures along the visual pathway, with the optic nerve and optic chiasm being most commonly and severely affected. Mechanisms such as compression from exudates, compression of the optic chiasm from third ventricle dilation, elevated intracranial pressure, arteritis, shunt failure, bacterial invasion of the optic nerve, and drug-induced optic neuropathy contribute significantly to visual loss [14–16].
ONP is a significant complication of tuberculous meningitis TBM. Previous studies, predominantly small to moderately sized retrospective cohort studies or case–control studies, have not sufficiently discussed this complication in TBM patients. Our study provides further evidence in this area. In our cohort, 6.8% (17/250) of patients with TBM developed ONP as a complication, with 23.5% (4/17) of cases resulting in visual impairment even after proper treatment. In our study, the incidence of ONP was notably lower than reported in previous studies [6–8, 12, 13], and cases of multiple cranial nerve involvement were also less frequent. This discrepancy may be attributed to the relatively younger age and milder disease severity of our study cohort, as well as regional differences, ethnic variations, baseline health status, comorbidities, and differences in tuberculosis burden across populations. Consistent with previous reports, headache was a prominent symptom in these patients.
One of the notable findings from our study is that the use of linezolid was associated with improved recovery from ONP. Linezolid, an oxazolidinone antibiotic with activity against drug-resistant TB, may offer neuroprotective benefits, potentially through its anti-inflammatory properties [17, 18]. This finding is particularly interesting given that linezolid is also known for its potential neurotoxic effects, which can lead to visual disturbances in some patients [17]. Our results suggest that, despite these concerns, linezolid may still be beneficial in the treatment of TBM patients with cranial nerve involvement, possibly due to its potent antituberculous efficacy. This indicates that incorporating linezolid into the treatment regimen for TBM could be advantageous for patients at risk of ONP.
Current TBM treatment largely mirrors pulmonary TB therapy, without accounting for TBM's unique challenges, such as the blood–brain barrier. Drugs like linezolid and cycloserine, with high brain penetration, should be considered more in TBM regimens to reduce mortality and long-term neurological complications. A clinical pharmacology study conducted in Tbilisi, Georgia, evaluated the ability of antituberculosis drugs to penetrate CSF in TBM patients. The results showed that linezolid and cycloserine exhibit moderate to high CSF penetration (80–100%), with linezolid's CSF/serum ratio unaffected by rifampin co-administration [19]. Additionally, a randomized controlled trial by Akhil Sahib et al. investigated the addition of linezolid to standard TBM therapy [20]. While no statistically significant difference in mortality was observed between groups, the linezolid group showed improved GCS and modified Rankin scale scores, suggesting potential benefits of linezolid in TBM treatment. However, larger sample sizes are needed to confirm its efficacy.
The addition of linezolid to TB treatment regimens has shown significant clinical improvements, particularly in critically ill patients. However, its potential for serious adverse effects cannot be overlooked. A database study covering reports from 2004 to 2023, which retrospectively analyzed adverse drug event (ADE) reports [21], revealed that in phase III and IV clinical trials, as well as randomized controlled trials, the most common adverse drug reactions (ADRs) associated with linezolid were gastrointestinal symptoms such as diarrhea, nausea, and vomiting, along with bone marrow suppression, peripheral neuropathy, and headaches. Concerns over more serious adverse events, such as myelosuppression, peripheral neuropathy, and anemia, have prompted investigations into lowering linezolid doses and shortening treatment durations. A recent study suggests that reducing the dose to 300 mg daily or shortening the therapy duration can preserve linezolid’s therapeutic efficacy while minimizing toxicity [22]. However, optimal dosing strategies remain to be fully established, and further research is essential to balance efficacy and safety. In clinical practice, real-time monitoring of patients’ symptoms, laboratory results, and imaging findings is also crucial for early detection of ADRs, allowing for timely intervention and management.
However, our study has several limitations. The single-center, retrospective design of this study inherently limits the generalizability of its findings, as it reflects the clinical characteristics and treatment approaches of a specific population. Retrospective studies rely on preexisting data, which may lead to missing or incomplete information, potentially introducing bias, as well as unconsidered potential confounding factors. The study's design also limits its ability to establish causality, as only associations between variables can be observed. Additionally, the small sample size of patients with ONP may have reduced the statistical power of our analyses. Future studies could overcome these limitations by incorporating multicenter, prospective designs, increasing the diversity of the patient population, and improving the robustness of data through real-time collection and control of confounding factors. Additionally, randomized controlled trials are needed to validate our findings and better assess the efficacy of linezolid in treating tuberculous meningitis. Moreover, exploring the impact of different treatment regimens, patient demographics, and disease severities on ophthalmic nerve outcomes will be important for developing optimal management strategies for TBM.
ONP is a significant complication of tuberculous meningitis, with 23.5% (4/17) of cases resulting in visual impairment even after proper treatment. Our study suggests that the development of ONP sequelae may be predictable based on certain risk factors, and early administration of linezolid may potentially reduce the incidence of ONP.
Acknowledgments
We would like to express our sincere gratitude to all the health care professionals and staff at the Shanghai Public Health Clinical Center for their invaluable assistance with patient care and data collection.
Author contributions. Z.T.-F., L.X., and Y.Y. analyzed the data, drafted and revised the manuscript. Y.Y., D.Y., and H.R.-L. designed or coded the figures and tables. P.L. provided critical feedback on data sources. W.H. offered guidance and support for statistical methods. F.L. and X.H.-L. designed the study, acquired the funding, and managed the project. All authors approved the final version. The corresponding author confirms that all listed authors meet authorship criteria and that no one meeting these criteria has been omitted.
Financial support. This work was supported by grants from the Shanghai Shenkang Hospital Development Center (SHDC12024115), managed by F.L.
References
Author notes
Zhen-Tao Fei, Lu Xia and Yang Yang equal contribution.
Potential conflicts of interest. All authors: no reported conflicts.


Comments