


Abstract
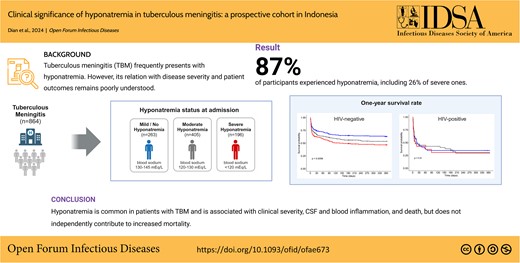
Hyponatremia is common in tuberculous meningitis (TBM), but its impact on disease severity and outcomes is unclear.
In a cohort of 864 adult patients with TBM in Indonesia, we assessed the prevalence and prognostic significance of hyponatremia, classified as moderate (120–130 mEq/L) or severe (<120 mEq/L). Patients received standard antituberculous therapy and corticosteroids and were followed for 1-year mortality.
Hyponatremia occured in 86.8% of patients, with 26% classified as severe. Severe hyponatremia associated with male, younger age, a lower Glasgow Coma Scale (GCS), and markers of more severe disease (P < .05). One-year mortality was 46.5% and associated with older age, HIV infection, lower GCS, markers of neurologic severity, fever, and thrombocytosis. Severe hyponatremia predicted mortality in univariate analysis showed no impact in HIV-positive patients.
Hyponatremia reflects disease severity in TBM but does not independently predict mortality, suggesting limited benefit from agressive correction.
This graphical abstract is also available at Tidbit: https://tidbitapp.io/tidbits/hyponatremia-in-tb-meningitis-4e62fd74-490f-4ccb-b9ab-00a4c7eecf8c
Meningitis is one of the most severe forms of tuberculosis [1, 2], often leading to death or neurologic disability [3]. Hyponatremia, defined as a blood sodium level <135 mEq/L [4], has been reported in 39% to 73% of adult patients with tuberculous meningitis (TBM) [5–8]. Its symptoms may vary, and severe hyponatremia may lead to neurologic abnormalities such as lethargy, seizures, and coma due to brain edema [4, 9–11]. Hyponatremia in TBM can be caused by the syndrome of inappropriate antidiuretic hormone (SIADH) or by cerebral salt wasting (CSW), but anorexia (including poor sodium intake), diarrhea, drugs, and recurrent vomiting may also disrupt the sodium and water balance in patients with TBM [6, 12].
However, it is unknown if hyponatremia is associated with disease severity or increased mortality. Two large cohort studies noted a connection between baseline hyponatremia and mortality in patients with TBM who were HIV infected [13], while some other studies did not [6, 14–16]. While hyponatremia can play a role in causing brain edema, which is harmful to patients, it remains unclear whether hyponatremia contributes to the mortality of TBM or if it simply reflects disease severity. Most studies have either been small or cross-sectional [15, 17].
Therefore, in the present study, we examined the prevalence and clinical relevance of hyponatremia in a large prospective cohort of patients with TBM from Indonesia, correlating hyponatremia to baseline clinical variables and adjusting its prognostic value for other risk factors.
METHODS
Setting and Patients
We included adult patients who presented with clinically suspected TBM at Hasan Sadikin Hospital, the top referral hospital for the approximately 50 million people living in the West Java province, Indonesia, between October 2006 and October 2023. TBM was clinically suspected if patients presented with a subacute illness characterized by headache, fever, or focal neurologic symptoms, with or without signs of extracranial tuberculosis.
Patient Consent Statement
Studies were conducted as part of the projects titled “Optimization of Diagnosis and Treatment of Meningitis” and “Indonesian Brain Infection Study,” which were approved by the ethical committee of Hasan Sadikin Hospital/Faculty of Medicine of Universitas Padjadjaran under approval 85/FKUP-RSHS/KEPK/Kep/EC/2006 and Universitas Indonesia under approval 1365/UN.2.F1/ETIK/2018. Patients’ written consent was obtained for collection of specimens for secondary use.
Study Measurements and Case Definition
In this prospective cohort, patients with suspected TBM, a subacute disease, underwent systematic clinical characterization. Those with positive results from cerebrospinal fluid (CSF) microscopy for acid-fast bacilli, Mycobacterium tuberculosis culture, or polymerase chain reaction (PCR) were classified as having definite TBM. Patients with negative results who met the uniform case definition were classified as having probable or possible TBM [18]. The British Medical Research Council (BMRC) grading system was adopted to categorize the severity of TBM [19]. Clinical characterization included neurologic and general physical examinations, chest radiographs, and blood tests (complete blood cell count, serum glucose, serum electrolytes, liver and kidney function tests, and HIV serostatus). For patients admitted before 2009 or those who died before consent could be obtained, retrospective HIV testing was performed anonymously.
Electrolyte analyzers (AVL 9180; Roche Diagnostics) were used for blood sodium assessment [20]. Hyponatremia was assessed on a case-by-case basis in consultation with internists. Patients with a CSF to blood glucose ratio <0.5 and a CSF cell count ≥5 cells/µL were defined as having probable TBM. Baseline blood sodium concentration was used to classify patients as having severe sodium levels (plasma sodium <120 mEq/L), moderate (120–130 mEq/L), or mild or normal (>130–145 mEq/L) [21]. We combined patients with mild hyponatremia with those with normal plasma sodium, as it is very unlikely that mild hyponatremia leads to worse disease outcomes. A 24-hour urine sample was analyzed for urinary sodium levels to differentiate between SIADH and CSW. Normovolemia or hypervolemia with moderate natriuresis (>20 mEq/L) and normal urine output was considered SIADH, warranting 20% fluid restriction. Patients with high natriuresis (>40 mEq/L) and increased urine output (>3 L/24 h) were considered to have CSW and did not receive fluid restriction [12, 22]. Patients with severe hyponatremia routinely received 0.9% NaCl, and some with acute signs received 3% NaCl, with correction not exceeding 12 mEq of sodium per 24 hours [23].
Clinical and ancillary data were recorded in an electronic study database. CSF was examined for protein, cells, glucose, bacteria, fungi, smear, and culture. Microbiological diagnosis included Ziehl-Nielsen and Gram staining for microscopy and M tuberculosis culture with solid Ogawa and liquid commercial culture (MODS). GeneXpert MTB/RIF has been used since 2015 [24]. India ink staining and Toxoplasma gondii CSF real-time PCR and serologic testing were performed for patients who were HIV infected [25].
Patients received a standard treatment regimen of rifampicin, isoniazid, ethambutol, and pyrazinamide administered via a nasogastric tube if unconscious. Repeated plasma sodium measurements during therapy and management of hyponatremia as part of routine care were not systematically recorded. Some patients participated in randomized clinical trials evaluating intensified antibiotic treatment, with separate ethical approval [26–28]. Since 2020, high-dose rifampicin (20 mg/kg) has been administered in combination with other standard antituberculosis drugs [26, 28, 29]. Dexamethasone was initially administered intravenously, with a transition to oral methylprednisolone upon discharge.
Patients were followed prospectively for at least 1 year. For patients not returning after discharge, field physicians or nurses made telephone calls, and a social worker conducted home visits. Deaths postdischarge were assessed through family interviews and death certificates from local authorities.
Data Analysis and Statistics
Patients' characteristics are presented as median (IQR) or proportion and were compared in terms of normal/mild, moderate, and severe hyponatremia, stratified for HIV status. Patients with hypernatremia (plasma sodium >145 mEq/L) were excluded from the analysis. Variables with significant results in univariate analysis were included in multivariate analysis. Dunn test and pairwise chi-square test were performed as the post hoc analysis to identify exactly which groups were different from each other. The Benjamini-Hochberg method was used to correct for multiple testing.
Univariate and multivariate Cox regression analysis was performed, resulting in survival probabilities and hazard ratios (HRs). Multivariate analysis was performed as a secondary analysis to explore the dependence of predictors for clinical, CSF, and blood variables separately, entering variables with P values <.05 in univariate analysis in the model. Kaplan-Meier curves were used to illustrate survival rate over time based on the hyponatremia status.
RESULTS
Baseline Clinical Characteristics
Patients mostly presented with severe disease and with hyponatremia. Out of 1562 patients with suspected TBM, 955 were diagnosed with definite or probable TBM. For further analysis, we included 864 patients with complete data on sex, age, HIV status, blood sodium, and 1-year survival, excluding 17 with hypernatremia (Figure 1, draw.io). A total of 467 patients (54.1%) had a positive CSF M tuberculosis culture, and an additional 115 patients (13.3%) had TBM confirmed through Ziehl-Neelsen staining, in-house PCR, or GeneXpert. Patients admitted to the hospital were relatively young (median age, 30 years; IQR, 23–38), 129 were HIV infected (14.9%), and most presented with BMRC grade II and III TBM (71.5%).
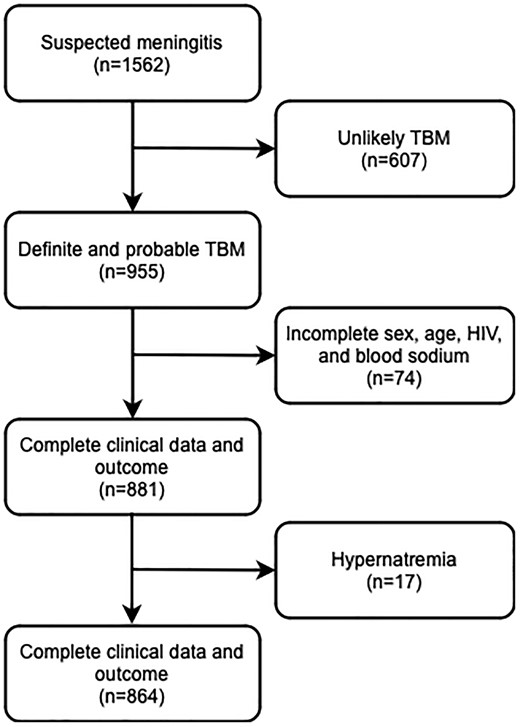
Patient flow. Hypernatremia was defined as a blood sodium level >145 mEq/L. TBM was classified as “definite” (microbiologically proven) if CSF microscopy for acid-fast bacilli, Mycobacterium tuberculosis culture, or polymerase chain reaction results were positive. Based on prior evaluation of CSF characteristics of definite and clinically suspected cases in a Bandung cohort, patients were classified as having “probable” TBM if they had a CSF/blood glucose ratio <0.5 combined with CSF cell count ≥5 cells/µL. CSF, cerebrospinal fluid; TBM, tuberculous meningitis.
Hyponatremia was found in 86.8% of patients and was more common among patients who were HIV uninfected than patients who were HIV infected (88.2% vs 78.3%, P = .004; Figure 2). Severe hyponatremia was found in 22.7% of patients. Post hoc analysis revealed associations between having severe hyponatremia, as opposed to normal/mild, and several factors: male gender, younger age, lower Glasgow Coma Scale (GCS) scores, advanced TBM grades, more severe neurologic symptoms, notable abnormalities in routine blood and CSF, and a positive CSF M tuberculosis culture. Conversely, patients with mild or normal blood sodium levels were less likely to have seizures, HIV infection, or concurrent pulmonary TB (Table 1, Supplementary Table 1). However, we found no significant relationship between low blood sodium and the actual mycobacterial load as measured by the CSF GeneXpert cycle threshold value (Supplementary Figure 1).
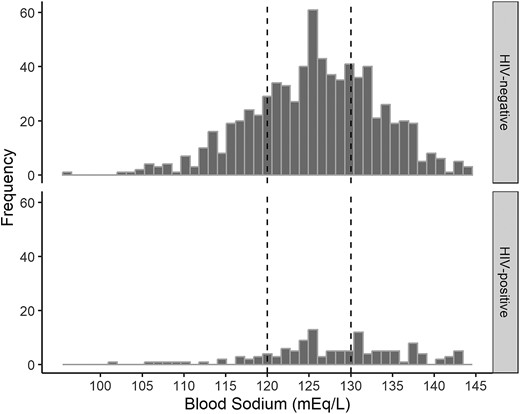
Blood sodium in patients with tuberculous meningitis at the time of diagnosis. Plasma sodium among 735 patients who were HIV negative (top) and 129 who were HIV positive (bottom). Dashed vertical lines separate patients by hyponatremia: severe (blood sodium <120 mEq/L, n = 237), moderate (121–130 mEq/L, n = 320), and mild or none (>130–145 mEq/L, n = 121).
Patient Characteristics According to the Level of Hyponatremia
| Severe, <121 mEq/L | Moderate, 121–130 mEq/L | Mild/No, 131–145 mEq/L | P | |
|---|---|---|---|---|
| Patients | 196 (17.5%) | 405 (46.3%) | 263 (36.2%) | |
| Variables | ||||
| Sex, Male | 136 (69.4) | 238 (58.8) | 149 (56.7) | * |
| Age, years (median [IQR]) | 28 [22–34] | 30 [23–38] | 30 [25–40] | ** |
| HIV (positive) | 21 (10.7) | 54 (13.3) | 54 (20.5) | ** |
| Grade | * | |||
| Grade I | 5 (2.7) | 33 (8.5) | 28 (11.4) | |
| Grade II | 145 (77.1) | 290 (74.9) | 183 (74.4) | |
| Grade III | 38 (20.2) | 64 (16.5) | 35 (14.2) | |
| Headache | 168 (91.8) | 349 (91.1) | 226 (90) | |
| Neck stiffness | 185 (95.4) | 364 (90.5) | 239 (90.9) | |
| Seizures | 18 (9.6) | 26 (6.9) | 39 (15.7) | * |
| Motor deficits | 120 (62.8) | 227 (59.7) | 135 (54.2) | |
| Cranial Nerve Palsy | 97 (53.9) | 190 (53.4) | 120 (48.8) | |
| Chest X-ray, TB | 140 (76.5) | 267 (73.8) | 142 (59.9) | *** |
| Temperature, oC (mean (SD)) | 37.3 [36.8–38] | 37.5 [36.8–38] | 37.2 [36.6–38] | |
| Fever | 16 (8.4) | 49 (12.7) | 34 (13.1) | |
| GCS (median [IQR]) | 12 [10–14] | 13 [11–14] | 13 [12–15] | *** |
| Cerebrospinal fluid (CSF) | ||||
| Leukocytes, cells/µL (median [IQR]) | 122 [36.8–311.8] | 127 [44–296] | 114 [23–265.75] | |
| HIV+ | 49 [16–197] | 98.5 [17.5–247.5] | 29 [8.5–108.25] | * |
| HIV− | 123 [44–312.5] | 131 [47–299] | 154 [43.8–331.3] | |
| Polymorphonuclear (PMN), cells/µL (median [IQR]) | 33.3 [8.5–111.5] | 25.62 [5.94–90.35] | 14.90 [2.28–80.53] | ** |
| HIV+ | 17.35 [5.25–120.81] | 14.3 [2.55–82.19] | 2.76 [0.84–11.76] | ** |
| HIV− | 39 [9.3–106.1] | 27 [6.3–90.5] | 24 [4–107.3] | |
| Mononuclear (MN), cells/ µL (median [IQR]) | 69 [20–160.5] | 75 [25–166] | 74 [20.3–180.8] | |
| HIV+ | 20.5 [7.8–66.8] | 62 [10.8–132.5] | 27 [8–98] | |
| HIV− | 83 [23.5–167] | 78 [28–171] | 91 [32–195] | |
| CSF protein, mg/dL (median [IQR]) | 222.5 [122–390] | 188 [109–340] | 160 [90–277] | ** |
| HIV+ | 100 [61–290] | 177.5 [111.5–266.75] | 136 [84–200] | |
| HIV− | 237 [137–397] | 190 [109–343.5] | 180 [90.5–291] | ** |
| CSF/blood glucose ratio (median [IQR]) | 0.16 [0.08–0.26] | 0.19 [0.12–0.32] | 0.27 [0.18–0.41] | *** |
| HIV+ | 0.21 [0.10–0.37] | 0.25 [0.11–0.35] | 0.35 [0.25–0.44] | ** |
| HIV− | 0.15 [0.08–0.24] | 0.19 [0.12–0.31] | 0.24 [0.16–0.38] | *** |
| Positive M. tuberculosis CSF culture | 132 (71.7) | 238 (61.5) | 97 (39.3) | *** |
| HIV+ | 11 (52.4) | 29 (58.8) | 12 (23.1) | *** |
| HIV− | 121 (74.2) | 208 (61.9) | 85 (43.6) | *** |
| Blood | ||||
| Hemoglobin, mg/dL | 11.9 [10.2–13] | 12.05 [10.4–13.4] | 12.25 [10.8–13.70] | * |
| X103/uL | ||||
| Leukocytes, cells/µL (median [IQR]) | 11.7 [8.26–14.85] | 10.1 [7.5–13.4] | 9.84 [6.28–13.15] | *** |
| Polymorphonuclear (PMN), cells/µL (median [IQR]) | 10.25 [7.2–12.9] | 8.05 [6–11.06] | 8 [5–11] | *** |
| Monocytes, cells/ µL (median [IQR]) | 0.7 [0.28–1] | 0.59 [0.16–1] | 0.51 [0.19–1] | * |
| Lymphocytes, cells/µL (median [IQR]) | 0.73 [0.33–1] | 1 [0.56–1.16] | 1 [0.66–1.65] | *** |
| Thrombocytes (median [IQR]) | 299 [218.5–379] | 306 [215–392.25] | 290.00 [224–370] |
Abbreviations: BMRC, British Medical Research Council; CSF, cerebrospinal fluid; GCS, Glasgow Coma Scale; M tuberculosis, Mycobacterium tuberculosis.
aFever is body temperature >38.5 °C.
*P ≤ .05. **P ≤ .01. ***P ≤ .001.
Patient Survival
A total of 864 patients had follow-up data up to 12 months (Figure 1). One-year overall mortality was 46.5%, with 43.4% for patients who were HIV negative and 64.3% for patients who were HIV positive. In univariate analysis, the following predicted mortality: HIV positivity, older age, higher BMRC TBM grade, motor deficits, fever, lower GCS score, higher level of CSF cells, higher CSF protein, lower CSF to blood glucose ratio, anemia, leucocytosis, thrombocytosis, and severe hyponatremia (Table 2). In multivariate Cox regression, HIV infection, older age, motor deficits, fever, lower GCS score, higher blood neutrophils, and thrombocytosis predicted mortality, while hyponatremia did not.
Univariate and Multivariate Cox Regression for Prediction of 1-Year Mortality
| Univariate analysis | Multivariate analysis | |||||||
|---|---|---|---|---|---|---|---|---|
| 365-Day mortality | ||||||||
| Variable | n | events | HR | 95% CI | P value | aHR | 95% CI | P value |
| HIV (positive) | 864 | 402 | 1.9 | 1.49–2.42 | *** | 1.79 | 1.27–2.47 | ** |
| Sex (Male) | 864 | 402 | 1.22 | 1–1.5 | ||||
| Age (per 10 –year increase) | 864 | 402 | 1.18 | 1.09–1.28 | *** | 1.26 | 1.12–1.41 | *** |
| BMRC grade | ||||||||
| Grade II (vs. grade I) | 821 | 379 | 1.78 | 1.12–2.84 | * | 1.04 | 0.54–2.01 | |
| Grade III (vs. grade I) | 821 | 379 | 4.34 | 2.65–7.11 | *** | 1.45 | 0.69–3.16 | |
| Motor abnormalities (Present) | 820 | 380 | 1.7 | 1.37–2.11 | *** | 1.52 | 1.15–2.01 | ** |
| Temperature (per 1o increase) | 837 | 387 | 1.32 | 1.18–1.47 | *** | 1.29 | 1.13–1.49 | *** |
| GCS (per 1-point increase) | 808 | 377 | 0.81 | 0.78–0.85 | *** | 0.90 | 0.84–0.97 | ** |
| Headache (Present) | 817 | 379 | 0.92 | 0.65–1.31 | ||||
| Neck stiffness (Present) | 859 | 398 | 1.31 | 0.89–1.92 | ||||
| Seizures (Present) | 815 | 373 | 1.14 | 0.83–1.58 | ||||
| Cranial nerve palsy (Present) | 782 | 356 | 1.07 | 0.87–1.32 | ||||
| Chest Xray (baseline), abnormal | 782 | 354 | 0.99 | 0.79–1.25 | ||||
| CSF | ||||||||
| CSF leukocytes (log10) | 863 | 401 | 0.91 | 0.79–1.04 | ||||
| PMN percentage (per 10% increase) | 838 | 386 | 1.07 | 1.03–1.1 | *** | 1.04 | 0.98–1.07 | |
| MN percentage (per 10% increase) | 838 | 386 | 0.94 | 0.91–0.98 | ** | 1.02 | 0.92–1.16 | |
| protein (per 10-fold increase) | 859 | 397 | 1.29 | 1.07–1.55 | ** | 1.27 | 0.96–1.68 | |
| CSF/blood glucose ratio | 856 | 394 | 0.94 | 0.88–1 | ** | 0.96 | 0.89–1.04 | |
| CSF xpert (Positive) | 671 | 307 | 1.23 | 0.98–1.55 | ||||
| CSF culture result (Positive) | 818 | 373 | 1.2 | 0.98–1.48 | ||||
| Blood | ||||||||
| Anemia (present) | 861 | 400 | 1.71 | 1.08–2.7 | * | 1.34 | 0.73–2.49 | |
| Leukocytes | 856 | 397 | 1.03 | 1.01–1.04 | ** | 1.03 | 0.83–1.31 | |
| Polymorphonuclear (per 10% increase) | 676 | 321 | 1.03 | 1.02–1.05 | *** | 1.03 | 1.01–1.05 | |
| Mononuclear | 677 | 321 | 0.82 | 0.69–0.97 | * | 1.02 | 0.84–1.24 | |
| Thrombocytes (per 1 × 10³) | 860 | 400 | 0.34 | 0.16–0.73 | ** | 0.30 | 0.1–0.88 | * |
| Hyponatremia | ||||||||
| Moderate | 864 | 402 | 1.19 | 0.94–1.51 | 1.01 | 0.75–1.36 | ||
| HIV− | 735 | 319 | 1.34 | 1.02–1.77 | * | 1.22 | 0.87–1.73 | |
| HIV+ | 129 | 83 | 1.03 | 0.64–1.66 | 0.78 | 0.35–1.71 | ||
| Severe | 864 | 402 | 1.42 | 1.09–1.86 | ** | 1.16 | 0.82–1.66 | |
| HIV− | 735 | 319 | 1.64 | 1.21–2.24 | ** | 1.44 | 0.96–2.15 | |
| HIV+ | 129 | 83 | 1.16 | 0.62–2.16 | 0.81 | 0.31–2.14 | ||
| Blood sodium | 864 | 402 | 0.99 | 0.98–1 | ||||
Multivariate Cox regression for survival, including variables with a P value <.05 in univariate analysis, for 365-day mortality in patients with TBM who were HIV negative.
Abbreviation: aHR, adjusted hazard ratio; BMRC, British Medical Research Council; CSF, cerebrospinal fluid; GCS, Glasgow Coma Scale; HR, hazard ratio; MN, mononuclear; PMN, polymorphonuclear.
aAnemia is blood hemoglobin <8 mg/dL [30].
*P ≤ .05. **P ≤ .01. ***P ≤ .001.
Regarding hyponatremia, among the patients uninfected with HIV, 1-year mortality was 36.9% for those with normal plasma sodium or mild hyponatremia (n = 209), 46.5% for those with moderate hyponatremia (n = 351), and 53.3% for those with severe hyponatremia (n = 175; P = .006; Figure 3A). This corresponds to an HR of 1.64 (95% CI, 1.21–2.44) for severe hyponatremia vs no/mild hyponatremia and an HR of 1.34 (95% CI, 1.02–1.77) for moderate vs mild/no hyponatremia. However, this effect was lost in multivariate analysis (Table 2). When we analyzed early mortality, severe hyponatremia was associated with mortality in univariate analysis but not in multivariate analysis (adjusted HR, 1.3 [95% CI, .77–2.2] for in-hospital mortality and 1.36 [95% CI, .81–2.29] for 1-month mortality). Among the patients who were HIV infected, 1-year mortality was 65.4% for patients with no/mild hyponatremia (n = 54), 70.6% for those with moderate hyponatremia (n = 54), and 69.4% for those with severe hyponatremia (n = 21), though the differences were not statistically significant (P = .9; Figure 3B) and likewise for in-hospital mortality (HR, 1.33; 95% CI, .65–2.74) as well as 1-month mortality (HR, 1.16; 95% CI, .59–2.27).

Survival according to plasma sodium. One-year mortality of patients who were (A) HIV uninfected (n = 735) and (B) HIV infected (n = 129) by hyponatremia: mild (plasma sodium >130 mEq/L), moderate (121–130 mEq/L), and severe (<120 mEq/L). In Cox regression, mortality was significantly higher among patients with severe hyponatremia vs mild/none (P = .0043) and among those with moderate vs mild/none (P = .055).
DISCUSSION
We examined the clinical relevance of hyponatremia in a prospective cohort of 864 patients diagnosed with TBM in Indonesia. Moderate and severe hyponatremia was notably prevalent, particularly among individuals who were HIV negative. Severe hyponatremia correlated with more severe disease and inflammation in blood and CSF at presentation. More severe hyponatremia was associated with higher mortality but only among patients uninfected with HIV and not when corrected for prognostic factors such as disease severity at the time of diagnosis.
Central nervous system disorders, infectious diseases [31], and critical illness [32, 33] are all well-established risk factors for hyponatremia [5, 33–35]. TBM embodies all 3 of these conditions, making hyponatremia a common and expected finding in patients with TBM. As compared with previous studies [5, 6, 36, 37], our cohort showed a higher prevalence and severity of hyponatremia. This might be attributed to the advanced stage (grade II or III BMRC) in our patient population. Severe hyponatremia was also associated with bacteriologic confirmation of disease, coprevalent pulmonary tuberculosis and CSF, and blood inflammation, all of which are more common among severely ill patients. Severe hyponatremia was relatively infrequent in patients presenting with seizures in our study. Traditionally, hyponatremia in TBM is considered chronic (existing for >48 hours) [32], whereas seizures are typically associated with acute hyponatremia [38–40].
We bacteriologically confirmed TBM in more than half of the patients: nearly two-thirds of patients uninfected with HIV and approximately half of patients who were HIV infected. Patients with culture-confirmed TBM in our cohort were younger and had more severe disease, with more concomitant pulmonary TB. They also presented with higher body temperatures, lower GCS scores, more severe hyponatremia, lower CSF to blood glucose ratios, higher CSF and blood leukocyte and neutrophil counts, and lower blood lymphocyte counts (Supplementary Figure 1). This finding is in agreement with previous studies showing that patients with bacteriologic confirmation have higher CSF cell counts [41, 42] and protein and lower CSF to blood glucose ratios [41].
The etiology of hyponatremia in this cohort is likely multifactorial, including poor oral intake, recurrent vomiting, gastrointestinal disturbance, CSWS with renal sodium and water loss mediated by natriuretic peptides, or SIADH that occurs due to brain inflammation leading to excessive release of vasopressin or antidiuretic hormone [43]. Of note, a definite cause of hyponatremia in TBM is notoriously hard to establish, especially in the absence of urine sodium and osmolality measurements, as is often the case in settings where TBM is prevalent. Regardless, distinguishing CSW from SIADH remains difficult because electrolytes and osmolality values may be similar and, indeed, diagnostic criteria vary [44].
Hyponatremia predicted mortality in univariate analysis, albeit only among patients who were HIV negative. However, hyponatremia was not associated with mortality in multivariate analysis. Previous studies in TBM have yielded conflicting results, with some showing a link between hyponatremia and death [13, 45] and others not [6, 15, 16]. Interestingly, while we showed a relation only between hyponatremia and death in patients who were HIV negative, 2 reports from Vietnam suggested low sodium levels to be associated with death mortality only among patients who were HIV infected [13, 45]. This difference might be due to differences in disease severity, with a much larger proportion of mild TBM (grade I) among individuals in Vietnam uninfected with HIV, while ours participants and those from a study in India were predominantly grade II and III (more severe) [6]. One potential explanation for the absence of an observed relationship between hyponatremia and TBM in patients who were HIV infected in this study is the relatively small number of individuals infected with HIV in this analysis. Furthermore, the significantly higher mortality rate among patients who were HIV infected suggests that other HIV-related factors may mitigate the potential impact of hyponatremia. It is also noteworthy that, even in patients uninfected with HIV, the association between hyponatremia and mortality did not reach statistical significance in the multivariate analysis. Our findings support the idea that hyponatremia in infections reflects severity rather than directly leading to death [31, 39]. As shown in our study, other factors influence mortality in our patients with TBM, and efforts should be made to optimize antimicrobial, supportive, and anti-inflammatory therapy. Our data suggest that aggressive correction of hyponatremia is unlikely to improve patients' outcomes.
Our study is one of the largest cohort studies examining the prevalence and clinical significance of hyponatremia in TBM. Still, it has several limitations. We used only baseline blood sodium data and were not able to examine changes in blood sodium over time or urine data to help distinguish SIADH or CSW as a cause of hyponatremia. Also, we could not assess the effects of clinical management of hyponatremia. Still, taken together, this study adds to our understanding of the role of hyponatremia in TBM. Current practice sometimes includes water restriction based on a presumptive diagnosis of SIADH. This might be detrimental, as patients with TBM are usually dehydrated, especially those with lowered consciousness and fever. Future studies may help determine the value of maintaining fluid and electrolyte balance in TBM.
Supplementary Data
Supplementary materials are available at Open Forum Infectious Diseases online. Consisting of data provided by the authors to benefit the reader, the posted materials are not copyedited and are the sole responsibility of the authors, so questions or comments should be addressed to the corresponding author.
Notes
Acknowledgments. The authors acknowledge the contributions of staff, residence, and nurses who cared for the study patients at the Department of Neurology, Hasan Sadikin Hospital, Bandung, Indonesia; Rani Trisnawati for data management; and Dr Basti SpPK from the clinical pathology department at Hasan Sadikin Hospital for providing the information related to blood sodium assessment.
Author contributions. S. D.: writing–original draft, method development, data collection/analysis, sample collection/processing, writing–reviewing and editing, funding acquisition, study conception. E. A.: data collection/analysis. L. C.: sample collection/processing. A. v. L.: writing–reviewing and editing. R. R.: writing–reviewing and editing, funding acquisition. B. A.: funding acquisition. A. R. G.: data collection/analysis, writing–reviewing and editing, study conception. R. v. C.: method development, writing–reviewing and editing, funding acquisition, study conception.
Financial support. This work was supported by the Royal Netherlands Academy of Arts and Sciences (09-PD-14 to RvC); Netherlands Organization for Health Research and Development (fellowship to RvC); the Netherlands Foundation for Scientific Research (VIDI grant 017.106.310 to RvC; Radboud University; Ministry of Research Technology and Higher Education of the Republic Indonesia (PKSLN research grant); US Agency for International Development–National Academy of Sciences (PEER Health project; subgrant 2000003601); the National Institutes of Health (R01AI145781); and Medical Research Council (United Kingdom) (MR/S004963/1).
References
Author notes
Potential conflicts of interest. All authors: No reported conflicts.


Comments