


Abstract
In chronic kidney disease, the activation of the renin–angiotensin–aldosterone system (RAAS) and renal inflammation stimulates renal fibrosis and the progression to end-stage renal disease. The low levels of vitamin D receptor (VDR) and its activators (VDRAs) contribute to worsen secondary hyperparathyroidism and renal fibrosis.
The 7/8 nephrectomy model of experimental chronic renal failure (CRF) was used to examine the anti-fibrotic effects of treatment with two VDRAs, paricalcitol and calcitriol, at equivalent doses (3/1 dose ratio) during 4 weeks.
CRF increased the activation of the RAAS, renal inflammation and interstitial fibrosis. Paricalcitol treatment reduced renal collagen I and renal interstitial fibrosis by decreasing the activation of the RAAS through renal changes in renin, angiotensin receptor 1 (ATR1) and ATR2 mRNAs levels and renal inflammation by decreasing renal inflammatory leucocytes (CD45), a desintegrin and metaloproteinase mRNA, transforming growth factor beta mRNA and protein, and maintaining E-cadherin mRNA levels. Calcitriol showed similar trends without significant changes in most of these biomarkers.
Paricalcitol effectively attenuated the renal interstitial fibrosis induced by CRF through a combination of inhibitory actions on the RAAS, inflammation and epithelial/mesenchymal transition.

What is already known about this subject?
in chronic kidney disease patients, the reductions of calcitriol and vitamin D receptor aggravates the renal and cardiovascular damage.
What this study adds?
paricalcitol reduces renal fibrosis at least partly through the reduction of the activation of the renin–angiotensin–aldosterone system;
paricalcitol reduces renal inflammation and leukocyte infiltration; and
paricalcitol impedes renal epithelial/mesenchymal transition, decreasing transforming growth factor beta and increasing E-cadherin.
What impact this may have on practice or policy?
paricalcitol has beneficial effects preventing renal fibrosis.
INTRODUCTION
In chronic kidney disease (CKD), hypertension and systemic inflammation are considered as major stimuli for the progression of renal fibrosis to end-stage kidney disease. In CKD patients, the reduction of the 1,25(OH)2D3 (calcitriol) and its receptor [vitamin D receptor (VDR)] contributes to trigger and worsen secondary hyperparathyroidism, but also impairs the hypertension and systemic inflammation aggravating renal and cardiovascular damage. Calcitriol directly reduces the activation of the renin–angiotensin system through the suppression of renin gene [1, 2] and influences the degree of systemic inflammation by attenuating the antigenicity of antigen-presenting cells and inflammatory cytokines synthesis and by inducing protective T-regulatory lymphocytes [3].
All these protective actions of VDR activators (VDRAs) conceptually support their utility to prevent cardiac hypertrophy and fibrosis as shown in previous studies [4]. Recently, a higher cardioprotective efficacy of paricalcitol compared with calcitriol has been reported [5, 6], which has been also confirmed in the kidney [7].
In addition, some studies in renal fibrosis suggest that around a third of all disease-related fibroblasts have a tubular epithelial origin, thus, the epithelial/mesenchymal transition (EMT) is considered as an important contributor of renal fibrosis [8]. Treatment with active vitamin D attenuates transforming growth factor beta (TGF-β)-driven reductions in E-cadherin [7], which is the main component of adherence junctions, essential for the maintenance of the epithelial tissue. Its down-regulation is considered as hallmark of EMT [9]. Despite these multiple beneficial effects of paricalcitol in experimental studies, there are some discrepancies with clinical trials. In fact, the PRIMO and OPERA studies showed no reductions in left ventricular (LV) mass in patient with CKD [10, 11].
Therefore, the aim of this study was to investigate the contribution of VDRA attenuation of the activation of the renin–angiotensin–aldosterone system (RAAS) and its downstream pro-inflammatory, pro-fibrotic signalling and/or of EMT to the renal anti-fibrotic effects of calcitriol and paricalcitol in an experimental chronic renal failure (CRF) model following the study design shown in Figure 1.
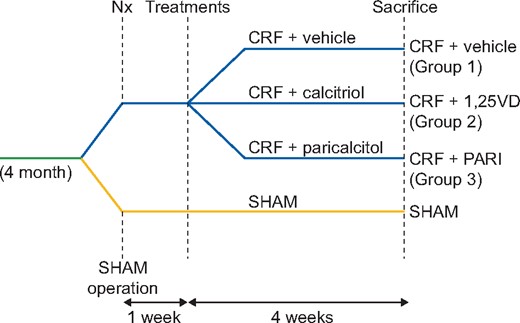
Experimental design of animal model of CRF. SHAM-operated (SHAM); CRF rats + vehicle (CRF + vehicle, Group 1), CRF rats + calcitriol (CRF + 1,25VD, Group 2), CRF rats + paricalcitol (CRF + PARI, Group 3). Nx = 7/8 nephrectomy.
MATERIALS AND METHODS
Experimental studies
All rat protocols were approved by the Research Ethics Committee of the Oviedo University.
CRF was induced in male Wistar rats (350–400 g) by 7/8 nephrectomy as previously detailed [12]. With the use of this model, it has been shown that is possible to achieve a more severe degree of renal failure than with 5/6 nephrectomy, obtaining a more pronounced secondary hyperparathyroidism and bone and vascular lesions that better reproduce the findings observed in the severe CKD in humans [13].
The animals were fed a standard rodent chow containing 0.6% calcium, 0.6% phosphorus and 1000 IU vitamin D3/kg (Panlab, Barcelona, Spain), and were housed in wire cages, in a controlled environment with a 12-h light/dark cycle, with water and food ad libitum. One week after surgery, animals were divided into three groups. Group 1 (CRF + vehicle, n = 7) received vehicle (corn oil 0.8 mL/kg body weight/day), Group 2 (CRF + calcitriol, n = 7) received calcitriol (10 ng/kg body weight/day) and Group 3 (CRF + paricalcitriol, n = 7) received paricalcitol (30 ng/kg body weight/day). The paricalcitol/calcitriol ratio (3/1) was used according to the previous studies [5, 14] in which it has been shown to achieve an equivalent parathyroid hormone (PTH) suppression without increasing vascular calcification. Compounds were dissolved in ethanol and diluted in corn oil to a final volume of 0.8 mL corn oil/kg body weight/injection and administered intraperitoneally 5 days/week over a period of 4 weeks. An additional group with simulated surgery (SHAM) (SHAM + vehicle, n = 7) served as reference group (Figure 1).
After 4 weeks of treatment the rats were introduced into metabolic cages and 24-h urine was collected. Rats were then sacrificed using CO2 anaesthesia. At sacrifice, blood was drawn and serum samples were frozen until analyses. The remnant kidney was removed and divided in three longitudinal sections: two sections were frozen in liquid nitrogen and stored at −80°C for RNA analysis, while the other section was fixed and embedded in paraffin for histological studies.
Analytical and technical procedures
Biochemical markers
Serum creatinine, calcium, phosphorus and creatinine were measured using a multichannel auto analyser (Hitachi 717; Boehringer Mannheim, Berlin, Germany). Serum intact PTH (iPTH) was measured by IRMA (Rat PTH kit Immutopics, San Juan Capistrano, CA, USA), serum intact fibroblast growth factor 23 (FGF23) and soluble klotho were assessed with a Sandwich enzyme-linked immunosorbent assay (ELISA) kit (Kainos Laboratories, Tokyo, Japan and USCN Life Science, China, respectively), ELISA kit was used to measure blood and urinary rat tumour necrosis factor alpha (TNF-α) (Abcam plc, Cambridge, UK), and chemiluminescent immunoassay was used to measure serum aldosterone and serum calcitriol (DiaSorin, Saluggia, Italy), following manufacturer’s protocols.
Blood pressure measurement
During the fourth week, systolic and diastolic blood pressures (SBP and DBP) were recorded using an automated, non-invasive tail-cuff method (LSI Letica, Barcelona, Spain). To minimize the procedure-induced stress, the animals were accustomed to the instrument for four consecutive days prior to the definitive measurements, which consisted in a set of a minimum of 10 repetitive measurements per rat.
Morphological and histological changes
Interstitial fibrosis was measured using an optical microscope (model DMRXA2, Leica Microsystems, Wetzlar, Germany) coupled to a digital video camera (model Dc-100, Leica Microsystems) in deparaffined 5-µm sections of the remained kidney stained with Masson’s trichrome. Samples were blinded to the reader. Captured images were analysed using an image analysis system and specific software (ImageJ). Results were expressed as percent of total kidney area measured.
Western blot analysis
Total protein extracts from kidney tissue were collected, quantified by the DC Protein Assay (Bio-Rad) and equal amounts of protein were separated by sodium dodecyl sulphate–polyacrylamide gel electrophoresis and transferred to polyvinylidene difluoride membranes (Amersham Hybond). Western blot analyses were performed following manufacturer’s protocol with specific antibodies: fibronectin (1:500; AB 2033), and glyceraldehyde-3-phosphate dehydrogenase (GAPDH) (dilution 1:3000; Santa Cruz Biotechnology). Anti-fibronectin antibody (dilution 1:5000; Santa Cruz Biotechnology) and anti-GAPDH (dilution 1:5000 Santa Cruz Biotechnology), secondary antibody binding was detected with the Western Blotting Detection Kit Clarity TM Western ECL substrate (Bio-Rad) and the ChemiDoc Gel Imaging System Model XRS (Bio-Rad) and quantified using Quantity One 1-D Analysis Software version 4 (Bio-Rad).
Immunohistochemistry
Five micro metre paraffin sections were deparaffinized and rehydrated. For CD45 immunohistochemistry (to determine leukocyte infiltration), samples were microwaved in 10-mM citric acid buffer pH 6.0 (Dako, REAL EnVision, Denmark) for 20 min. For the immunohistochemistry for E-cadherin the sample was incubated at 98°C with ethylenediamine tetraacetic acid; buffered solution (Tris–EDTA) pH = 9 (Dako) for 20 min. For TGF-β immunohistochemistry, 5-µm paraffin sections were placed in a stove at 58°C for 1 h. Samples were then incubated with 3% hydrogen peroxidase for 10 min, washed with phosphate-buffered saline (PBS) and blocked with 3% of bovine serum albumin (BSA) in PBS for 1 h. After an overnight incubation with primary antibody CD45 (1:50, Ab10558, Abcam), E-cadherin (1:10, anti-human E-cadherin, Dako) or TGF-β (1:100 AB92486) in 3% BSA in PBS at 4°C, slices were washed and incubated with biotinylated secondary antibody following manufacturer’s instructions (Dako). A negative control without primary antibody was used to set the level of the lowest detectable staining intensity.
Immune complexes with CD45, E-cadherin and TGF-β were visualized with diaminobenzidine substrate and samples were dehydrated and mounted with Entellan Merck. Semiautomatic image analysis software (ImageJ) evaluated protein expression. Results were expressed as percentage of total kidney area measured.
Total RNA isolation, cDNA synthesis and quantitative reverse transcription polymerase chain reaction (RT-PCR)
A kidney fragment was homogenized in an Ultraturrax (OmniHT) Total RNA was extracted by the TRIzol method (Sigma, St Louis, MO, USA). Total RNA concentration and purity were quantified by UV–Vis spectrophotometry (NanoDrop Technologies, Wilmington, DE, USA) measuring its absorbance at 260 and 280 nm. Reverse transcription was performed with a High Capacity cDNA Reverse Transcription Kit (Applied Biosystems, Foster City, CA, USA) following the manufacturer’s instructions. Gene expression was measured in kidney by qRT-PCR using an ABI Prism 7000 Sequence Detection System (AppliedBiosystems). TaqMan Real-time PCR amplification was performed with gene-specific primer (Gene Expression Assays from Applied Biosystems) for renin, angiotensin receptor 1 (ATR1) ATR2, mineralocorticoid receptor (Nr3c2), collagen I, TGF-β, TNF-α, Snail (a profibrotic transcription factor that inhibits E-cadherin), E-cadherin and a desintegrin and metaloproteinase (ADAM17) [also called tumour necrosis factor-α-converting enzyme (TACE)]. Rat GAPDH was used as housekeeping gene. The relative quantitative evaluation of target gene was performed by comparing threshold cycles using the ΔΔCt method [15].
Statistical analysis
Results were expressed as median and interquartile range. For all variables, the non-parametric Kruskal–Wallis test with Bonferroni correction was used [16]. Significant differences were considered when P < 0.05. The statistical programme used was R version 3.5.
RESULTS
Biochemical markers and BP
Table 1 shows that nephrectomy resulted in a similar decrease in creatinine clearance of ˃60% in all uraemic groups compared with SHAM (P < 0.05). Neither calcitriol nor paricalcitol treatment influenced significantly the reductions in the CRF induced by nephrectomy.
Biochemical parameters and SBP and DBP in the different groups of rats
| Biochemical markers and BP | SHAM (n = 7) | CRF + vehicle (Group 1) (n = 7) | CRF + 1,25VD (Group 2) (n = 7) | CRF + PARI (Group 3) (n = 7) |
|---|---|---|---|---|
| Creatinine clearance, mL/min | 2.06 (1.85–2.23)* | 0.81 (0.63–0.89) | 0.57 (0.52–0.67) | 0.67 (0.48–0.79) |
| Calcium, mg/dL | 10.8 (10.8–11.1) | 11.9 (11.5–12.0) | 14.5 (13.0–15.0)* | 14.2 (13.7–14.6)* |
| Phosphorus, mg/dL | 6.70 (6.30–7.75) | 5.40 (4.80–5.55) | 7.00 (5.60–7.70) | 7.40 (7.10–7.40) |
| PTH, pg/mL | 2.90 (1.55–5.75) | 8.40 (4.45–15.00) | 0.50 (0.5–1.40)* | 0.50 (0.5–1.90)* |
| Proteinuria, mg/24 h | 12.9 (7.24–14.18) | 8.26 (7.26–9.56) | 5.83 (2.95–9.01) | 7.60 (5.10–9.93) |
| FGF23, pg/mL | 355 (327–396)* | 681 (671–820) | 1257 (1252–1267)* | 1186 (1179–1196)* |
| Calcitriol, pg/mL | 8.32 (7.93–9.73) | 6.37 (5.23–7.42) | 30.4 (18.3–43.1)* | 13.8 (13.3–26.1)* |
| Soluble klotho, ng/mL | 5.82 (2.47–10.2) | 3.21 (1.30–4.07) | 2.02 (1.25–3.06) | 2.40 (2.21–2.56) |
| Aldosterone, pg/mL | 53.1 (48.1–60.1)* | 298 (230–362) | 69.8 (58.8–339) | 144 (52.5–154) |
| SBP, mmHg | 128 (124–137)* | 147 (144–148) | 147 (141–154) | 135 (133–137) |
| DBP, mmHg | 94 (87–97) | 107 (105–121) | 105 (93–108) | 102 (97–109) |
SHAM-operated (SHAM); CRF rats + vehicle (CRF + vehicle, Group 1); CRF rats + calcitriol (CRF + 1,25VD, Group 2); CRF rats + paricalcitol (CRF + PARI, Group 3). Data represent median and interquartile range.
P < 0.05 versus CRF + vehicle.
The CRF + vehicle group (Group 1) did not show a significant increase of serum calcium compared with the SHAM, but calcitriol and paricalcitol groups did compared with all groups. A marked suppression of PTH was also observed in the calcitriol and paricalcitol groups compared with the CRF + vehicle group. No significant differences were found in serum phosphorus levels and proteinuria among the different groups.
Increases in FGF23 were observed in all CRF groups (Groups 1–3) compared with the SHAM group (P < 0.05). The highest levels were observed in the calcitriol and paricalcitol groups (2-fold higher than Group 1).
Compared with the CRF + vehicle group, serum levels of calcitriol significantly increased in both VDRAs groups, particularly in the calcitriol group and with modest elevations in the paricalcitol group (Table 1).
Circulating soluble klotho levels were reduced by 50% in all uraemic groups compared with Sham, without reaching statistical significance (Table 1). All uraemic groups had significantly decreased renal klotho mRNA levels compared with SHAM group [SHAM: 0.82 (0.51–1.37); CRF + vehicle: 0.33 (0.17–0.38); CRF + calcitriol: 0.16 (0.07–0.25); CRF + paricalcitol: 0.07 (0.06–0.26)], without any differences among uraemic groups.
RAAS
Table 1 shows that SBP increased with uraemia (Group 1); meanwhile, there were no differences in DBP. There were no significant differences in the BP control between the CRF rats treated with VDRAs and Group 1, although the paricalcitol group showed a homogeneous but not significant decrease of SBP compared with the CRF + vehicle group.
The CRF + vehicle group showed the highest renin gene expression. Paricalcitol significantly prevented the median increases in renin gene expression induced by uraemia (Group 1, Figure 2A). In addition, both VDRAs attenuated the increase in ATR1 gene expression induced by uraemia, calcitriol by 36% and paricalcitol by 40% (Figure 2B). A positive and significant correlation between renin mRNA and FGF23 levels were found (R = 0.550, P = 0.041) in the rats without VDRAs treatment (SHAM and CRF groups). A trend was observed between AT1R mRNA and FGF23 levels, but differences were not significant (R = 0.308, P = 0.305).

RAAS expression evaluated by qPCR. SHAM-operated (SHAM); CRF rats + vehicle (CRF + vehicle, Group 1), CRF rats + calcitriol (CRF + 1,25VD, Group 2), CRF rats + paricalcitol (CRF + PARI, Group 3) (A). Renin mRNA. (B) ATR1 mRNA. (C) Serum levels of aldosterone. Data represent median and interquartile range. *P < 0.05 versus CRF + vehicle.
A significant increase in the ATR2 gene expression in the paricalcitol group was observed: 2.98 (2.79–3.68) compared not only with the CRF + vehicle group [0.99 (0.29–1.74), P = 0.0023] but also with the calcitriol group [1.67 (0.83–1.85), P = 0.038].
A significant increase in the serum levels of aldosterone was observed in the CRF + vehicle group compared with the SHAM group. This increase was partially attenuated in the groups treated with either VDRAs (Figure 2C).
In contrast, the mRNA expression of the mineralocorticoid receptor in the kidney did not show any significant differences amongst groups, although the paricalcitol group showed the lowest value [paricalcitol group: 0.49 (0.43–0.64), calcitriol group: 0.95 (0.72–1.23), CRF + vehicle group: 1.24 (0.54–1.39)].
Renal inflammation, EMT and fibrosis
The CRF + vehicle group did not show increase in ADAM17 compared with the SHAM, but a statistically significant reduction in the ADAM17 gene expression was observed in the paricalcitol group (54% compared with the CRF + vehicle group, P = 0.03) (Figure 3A), this decrease was not significant in the calcitriol group. Neither calcitriol nor paricalcitol was effective to significantly decrease the TNF-α gene expression induced by uraemia (47% reduction in paricalcitol, Figure 3B). Unfortunately, the TNF-α protein expression in serum and urine using the most adequate ELISA kit showed undetectable levels in either of these two fluids (data not shown). The immunohistochemical analysis of renal leukocyte CD45 expression showed seven times higher infiltration in the CRF + vehicle group compared with the SHAM. Calcitriol was ineffective to reduce the CD45 increase, but paricalcitol significantly reduced it (Figure 3C and D).
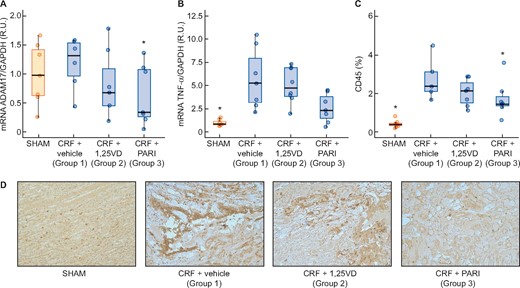
Renal inflammation markers expression evaluated by qPCR. SHAM-operated (SHAM); CRF rats + vehicle (CRF + vehicle, Group 1), CRF rats + calcitriol (CRF + 1,25VD, Group 2), CRF rats + paricalcitol (CRF + PARI, Group 3). (A) ADAM17 mRNA. (B) TNF-α mRNA. (C) CD45 immunohistochemical quantification in all rats. (D) Representative photo of CD45 immunohistochemistry 20×. Data represent median and interquartile range. *P < 0.05 versus CRF + vehicle.
The CRF (Group 1) increased more than three times the TGF-β gene and protein expression compared with the SHAM. Paricalcitol significantly reduced the TGF-β mRNA and protein levels induced by uraemia, whereas calcitriol did not (Figure 4). Changes in E-cadherin expression were opposed to those of TGF-β gene expression as shown in Figure 5A, the uraemia (Group 1) significantly reduced E-cadherin by 67% compared with SHAM and paricalcitol effectively prevented the reduction of E-cadherin induced by CRF (P < 0.001) (Figure 5C). Snail mRNA significantly increased 3.5 times in the CRF + vehicle group, but neither calcitriol nor paricalcitol significantly affected Snail levels (Figure 5B).
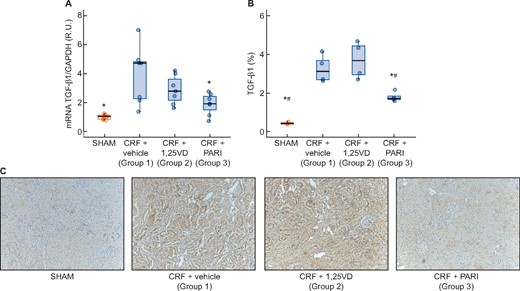
TGF-β gene expression evaluated by qPCR and immunohistochemitry. SHAM-operated (SHAM); CRF rats + vehicle (CRF + vehicle, Group 1), CRF rats + calcitriol (CRF + 1,25VD, Group 2), CRF rats + paricalcitol (CRF + PARI, Group 3). (A) TGF-β mRNA. (B) TGF-β immunohistochemistry. (C) Representative photo of TGF-β immunohistochemistry 10×. Data represent median and interquartile range. *P < 0.05 versus CRF + vehicle; #P < 0.001 versus CRF + 1,25VD.
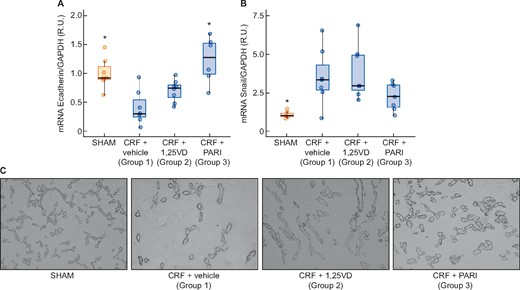
Immunohistochemistry renal EMT: E-cadherin immunohistochemistry and E-cadherin and Snail expression evaluated by qPCR. SHAM-operated (SHAM); CRF rats + vehicle (CRF + vehicle, Group 1), CRF rats + calcitriol (CRF + 1,25VD, Group 2), CRF rats + paricalcitol (CRF + PARI, Group 3). (A) E-cadherin mRNA. (B) Snail mRNA. (C) Representative photo of E-cadherin immunohistochemistry 10×. Data represent median and interquartile range. *P < 0.05 versus CRF + vehicle.
The CRF + vehicle group showed a 3-fold increase in collagen I and 8-fold increase in interstitial fibrosis compared with the SHAM group. Calcitriol did not significantly reduce the collagen I mRNA nor the fibrosis induced by the uraemia, but paricalcitol did (Figure 6A, B and D; P < 0.001 and P < 0.05, respectively). The CRF + vehicle group showed an increase in fibronectin protein expression compared with SHAM group; the calcitriol group did not reduce significantly the fibronectin protein expression, but paricalcitol did (Figure 6C).
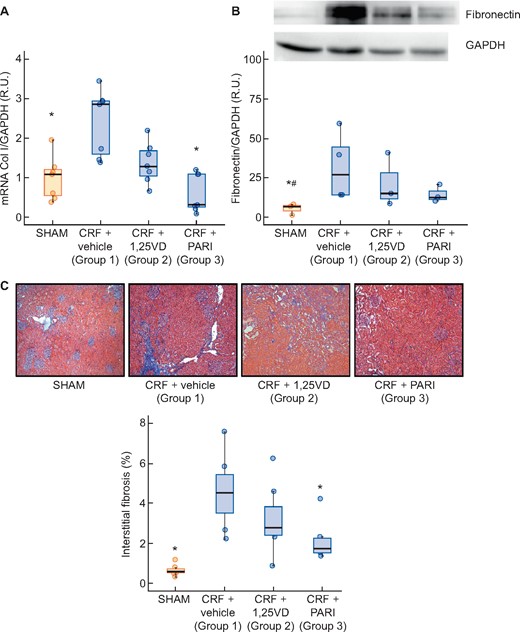
Collagen I gene expression evaluated by qPCR and renal interstitial fibrosis: Masson’s thrichromic staining. SHAM-operated (SHAM); CRF rats + vehicle (CRF + vehicle, Group 1), CRF rats + calcitriol (CRF + 1,25VD, Group 2), CRF rats + paricalcitol (CRF + PARI, Group 3). (A) Collagen I (Col I) mRNA. (B) Representative Western blot of fibronectin and GAPDH and Fibronectin western blot quantification. (C) Masson’s trichrome staining interstitial fibrosis representative photo of Masson’s trichrome staining 10× and quantification in all rats. Data represent median and interquartile range. *P < 0.05 versus CRF + vehicle; #P < 0.05 versus CRF + 1,25VD.
DISCUSSION
This study shows that paricalcitol was effective to attenuate the renal interstitial fibrosis induced by CRF through a combination of inhibitory actions on the RAAS, inflammation and EMT. Calcitriol showed a similar trend but without significant changes in most of these positive effects. These beneficial effects of VDRAs on renal fibrosis, particularly with paricalcitol, could partly explain some of the positive actions of the VDRAs in the amelioration of the progression of CKD at cardiac and vascular level [17].
The main objective for the use of VDRAs in CRF has been the control of secondary hyperparathyroidism. In our study, this important effect of VDRAs has been observed and a similar PTH suppression was achieved using equivalent doses of paricalcitol and calcitriol (ratio: paricalcitol 30 ng/day/calcitriol 10 ng/day). Like in other studies [18, 19], a minor and not significant decrease in creatinine clearance was observed with the use of the VDRAs and there were no differences between paricalcitol and calcitriol regarding their hypercalcaemic effects [5, 20]. In our study, the 3/1 paricalcitol/calcitriol (dose ratio) was based in previous studies [14, 20, 21], but the serum calcium and PTH levels achieved indicates the use of 3/1 dose ratio possibly exceeded the optimal dose, a finding also in keeping with the increments of FGF23 serum levels observed [22, 23]. Several studies have shown undetectable levels of serum calcitriol following paricalcitol treatment, an effect attributed to the stimulation of CYP24A1 activity to degrade excessive circulating calcitriol levels [24]. In our study, both VDRAs significantly increased serum levels of calcitriol compared with those in the uraemic control group, an effect more remarkable in the calcitriol group supporting the adequacy of the doses used [25].
Apart from the PTH control, the use of VDRAs seems to produce other additional benefits, which in the end could contribute to reduce the fibrosis. It is well known that the activation of the renin–angiotensin system, currently present in CRF, together with the low levels of 25(OH)D3 and calcitriol contribute, among other things, to the impairment of the renal damage [26–30]. Calcitriol and paricalcitol directly inhibit the transcription of the renin gene [1, 31]; in fact, VDR knockout mice and 1-α-hydroxylase-deficient mice exhibit high BP [1]. In addition, paricalcitol has shown to be able to inhibit the renin–angiotensin system, reducing glomerular and tubulointerstitial damage, BP and proteinuria [31].
Our results confirm these findings. Paricalcitol treatment significantly reduced both the renal renin and AT1R gene expression induced by 1 month of CRF (Group 1) by 80 and 40%, respectively. Calcitriol was similar to paricalcitol at reducing ATR1 but failed to suppress renal renin expression. In addition, a significant increase of ATR2 gene expression was observed in the paricalcitol group compared not only with the CRF + vehicle group, but also with the calcitriol group. Probably, the differential effect of paricalcitol with calcitriol found in our study might be attributed to the high ATR2 gene expression in the paricalcitol group promoting vasodilation, and reducing renal fibrosis and inflammation [32], through a reduction in the TGF-β in renal proximal tubular cells [33].
Circulating aldosterone, a profibrotic factor [34], increased with nephrectomy. This increase was similarly attenuated by both VDRAs [35, 36]. However, VDRAs treatment did not alter the mRNA levels for the mineralocorticoid receptor. Despite the ability of VDRAs to mildly reduce aldosterone, which could contribute to renal klotho reductions, neither the protection against aldosterone elevations nor the prevention of klotho reductions reached statistical significance. Furthermore, in agreement with reports demonstrating that high FGF23 increases RAAS activation in the kidney [37], this study demonstrates a correlation between FGF23 and renin in untreated uraemic rats. Both high FGF23 and high renin are recognized markers of a higher susceptibility to CKD progression. Interestingly, this correlation was lost upon VDRA treatment. Since both VDRAs markedly increased FGF23 and effectively reduced renin mRNA, our results demonstrate that the efficacy of VDRA to reduce renin expression prevailed over their induction of FGF23 in the control of the RAAS.
VDRA could have an additional anti-fibrotic effect, attenuating FGF23 deleterious effects by decreasing FGFR4 receptor at cardiac and vascular level [17]. Neither VDRAs were effective to maintain circulating levels of soluble klotho or to prevent the decreases in renal klotho gene expression induced by the progressive deterioration of renal function in a month [38]. As in other studies, calcitriol and paricalcitol were not able to reduce BP [39], a result that is not surprising as the kidney-protective effects of VDRAs are independent of their effects on BP control.
In CRF, another key aspect in the control of the fibrosis is the prevention of inflammation and EMT. Several inducers of inflammation are currently increased in CKD of all aetiologies. Conversely, in our study, the uraemia itself (Group 1) did not show a significant increase in the renal ADAM17 expression, one of the core inflammation molecules. However, in spite of no increases in ADAM17 with the uraemia, paricalcitol significantly reduced ADAM17. Different from what happened with ADAM17, the uraemia did induce a significant increase in TNF-α (Group 1, Figure 3A), but this increase was not significantly reduced by any of the VDRAs used. Finally, the leucocyte infiltration, as expected, showed a significant increase in the non-treated uraemic rats (Figure 3C and D), which was significantly reduced by paricalcitol.
Taking all the previous results together, we may speculate that simultaneous suppression of renin, RAAS activation and ADAM17 gene expression by paricalcitol could have contributed to attenuate the induction of ADAM17 activity by angiotensin II at the renal cell surface, which causes the activation of the epithelial growth factor receptor signalling including inflammatory cell infiltration as well as pro-fibrotic and pro-inflammatory signals [40]. Unfortunately, as in our study, the uraemia did not induce significant increases in ADAM17, therefore we cannot strongly support the influence of ADAM17 in the increase of fibrosis observed in Group 1. Nevertheless, despite of that, paricalcitol induced significant decreases of ADAM17 in parallel with its effect on TGF-β, leucocyte infiltration and renal interstitial fibrosis. In fact, recently some authors have proposed the anti-inflammatory actions of paricalcitol preventing the activation of the non-canonical nuclear factor-κB2 pathway through the reversion of TNF receptor-associated factor 3 down regulation, in a VDR-independent manner [41].
Reducing the changes in EMT is another of the important targets to reduce fibrosis. Paricalcitol reduced TGF-β and consequently attenuated the 80% decreases in renal E-cadherin induced by uraemia. These results are in agreement with previous studies [7], which found that paricalcitol largely preserved E-cadherin in vivo and abolished TGF-β-mediated E-cadherin suppression in tubular epithelial cells in human tumours and in vitro [7, 9, 42, 43]. All these beneficial effects of the VDRAs, particularly those observed with paricalcitol, may help to maintain the E-cadherin levels reducing the possibilities of the development of renal fibrosis.
The combination of the down-regulation of the three factors, renin–angiotensin system activation, renal inflammation and EMT, by paricalcitol helps to explain the remarkable reduction observed in collagen I gene expression, fibronectin protein expression and renal interstitial fibrosis. This protective effect has been also demonstrated in models of unilateral urethral obstruction by other authors [7, 44, 45].
In all experiments, calcitriol was either not effective or less effective than paricalcitol; this differential and weaker effect of calcitriol could have been partly due several factors such as the higher doses of calcitriol used and the different experimental model to induce renal damage as some authors have observed [18]. The choice of a 10 ng/kg body weight/day dose of calcitriol was based on its effective suppression of secondary hyperparathyroidism without increasing aortic calcium deposition, as reported by our group and others [4, 5, 46].
In agreement with the beneficial effect of paricalcitol observed in kidney fibrosis, similar results have been reported for the prevention of myocardial fibrosis using the same experimental model [5, 6] and also in a model of aortic constriction [4]. This effect of paricalcitol has been partly attributed to an increase of the collagen degradation promoted by increases in matrix metalloproteinase 1, an interstitial collagenase that degrades Types I–III structural collagens.
Other additional beneficial action of paricalcitol could be due to its capacity to down-regulate miR-29b and miR-30c, previously reported as possible responsible of the reductions of cardiac fibrosis [6]. In clinical studies like PRIMO [10] and OPERA [11], paricalcitol did not reduce the LV mass; however, part of the discrepancies between the results from clinical (PRIMO, OPERA) and experimental studies could be due to the fact that the image technique used in PRIMO to measure the LV mass (magnetic resonance imaging) does not differentiate muscle from fibrotic tissue. In fact, in experimental studies using two histological techniques to stain muscle and fibrotic tissue, the main differential advantage observed with the use of paricalcitol [5] was not the reduction of the ventricular mass but its capacity to reduce the percentage of ventricular myocardial fibrosis, maintaining the normal muscle/fibrotic ratio of the left ventricle. These experimental morphological findings could explain the functional benefits observed in the PRIMO trial, where without reductions in the LV mass the diastolic LV function and B-type natriuretic peptide levels were preserved.
As strengths of this study, we can highlight the comparison of the efficacy of two VDRAs at counteracting three main determinant of renal fibrosis: reductions in inflammatory markers, the RAAS and EMT, with identification of the earliest biomarkers of these changes. One likely limitation is the short 4-week period of treatment. A longer treatment could have increased differences between VDRA treatments with those in the CRF + vehicle group, particularly with those in the calcitriol group. As limitations, we cannot exclude the use of doses of VDRAs that increased serum calcium, even though there were insufficient to significantly increase aortic calcium deposition or the vascular phenotype, as demonstrated by no reductions in aortic alpha-actin content, at least after a 4-week treatment.
In summary, in rats with CRF, the VDRAs, particularly paricalcitol, attenuated uraemia-induced renal fibrosis. The graphical abstract summarizes the likely mechanisms involved in the amelioration of kidney fibrosis that can be attributed to the vitamin D hormonal system. The beneficial effects of paricalcitol seem to be multifactorial, involving at least the control of RAAS, renal inflammation and EMT. Several of these favourable actions of vitamin D observed in the kidney may also explain some of the benefits attributed to this hormone in the cardiovascular system.
ACKNOWLEDGEMENTS
Paricalcitol and calcitriol were donated by Abbott Pharmaceuticals Company.
FUNDING
This study was supported by Instituto de Salud Carlos III (ISCIII)—Fondo de Investigación Sanitaria (FIS07/0893, FIS10/00896; FIS13/00014, FIS16/00637, FIS17/00715 and FIS19/00532), Fondo Europeo de Desarrollo Regional (FEDER), Plan de Ciencia, Tecnología e Innovación 2013-2017 y 2018-2022 del Principado de Asturias (GRUPIN14-028, IDI-2018-000152), Fundación Renal Íñigo Álvarez de Toledo (FRIAT) and Retic REDinREN from ISCIII (RD06/0016/1013, RD12/0021/0023, RD16/0009/0017, RD12/0021/0006 and RD16/0009/0018) and Abbott Pharmaceuticals (ACA-SPAI-08-22/2008). L.M.-A. has been supported by ISCIII-FINBA (PI16/00637); S.P. by FINBA-REDinREN and IDI-2018- 000152; C.A.-M. by ISCIII FINBA-REDinREN; N.C.-L. by GRUPIN14-028 and IDI-2018-000152; S.F.-V. by IDI-2018-000152; J.M.-V. by Oviedo University fellowship; and B.M.-C. by ISCIII-FINBA (PI17/00384).
CONFLICT OF INTEREST STATEMENT
The authors declare no conflict of interest.
REFERENCES
Author notes
Laura Martínez-Arias and Sara Panizo Equal contribution as first authors.
Equal contribution as corresponding authors.
Jorge B Cannata-Andía and Manuel Naves-Díaz Equal contribution as senior authors.


Comments